HAL Id: hal-00448395
https://hal.archives-ouvertes.fr/hal-00448395
Preprint submitted on 18 Jan 2010
HAL is a multi-disciplinary open access
archive for the deposit and dissemination of sci-entific research documents, whether they are pub-lished or not. The documents may come from teaching and research institutions in France or
L’archive ouverte pluridisciplinaire HAL, est destinée au dépôt et à la diffusion de documents scientifiques de niveau recherche, publiés ou non, émanant des établissements d’enseignement et de recherche français ou étrangers, des laboratoires
Increasing stability and interpretability of gene
expression signatures
Anne-Claire Haury, Laurent Jacob, Jean-Philippe Vert
To cite this version:
Anne-Claire Haury, Laurent Jacob, Jean-Philippe Vert. Increasing stability and interpretability of gene expression signatures. 2010. �hal-00448395�
Improving stability and interpretability of gene
expression signatures
Anne-Claire Haury∗
Mines ParisTech, CBIO Institut Curie, Paris, F-75248 INSERM, U900, Paris, F-75248 [email protected]
Laurent Jacob Mines ParisTech, CBIO Institut Curie, Paris, F-75248 INSERM, U900, Paris, F-75248
[email protected] Jean-Philippe Vert
Mines ParisTech, CBIO Institut Curie, Paris, F-75248 INSERM, U900, Paris, F-75248 [email protected]
January 18, 2010
Abstract
Motivation Molecular signatures for diagnosis or prognosis estimated from large-scale gene expression data often lack robustness and stability, rendering their biological interpretation challenging. In-creasing the signature’s interpretability and stability across per-turbations of a given dataset and, if possible, across datasets, is urgently needed to ease the discovery of important biological processes and, eventually, new drug targets.
Results We propose a new method to construct signatures with in-creased stability and easier interpretability. The method uses a gene network as side interpretation and enforces a large connec-tivity among the genes in the signature, leading to signatures typ-ically made of genes clustered in a few subnetworks. It combines the recently proposed graph Lasso procedure with a stability se-lection procedure. We evaluate its relevance for the estimation of a prognostic signature in breast cancer, and highlight in particu-lar the increase in interpretability and stability of the signature. Availability The code and data are available upon request.
Contact [email protected]
∗To whom correspondance should be addressed: 35, rue Saint Honor´e, F-77300
1
Introduction
In recent years a large number of diagnostic, prognostic and predictive molecular signatures have been identified through analysis of genome-wide expression profiles (Golub et al.,1999;Alizadeh et al.,2000;Ramaswamy et al., 2001;van de Vijver et al., 2002). Common signatures involve a few tens of genes whose expression levels allow to classify a sample in a given disease subtype, or assess its prognosis. They have been quickly adopted by the med-ical community for their ability to provide accurate classification and predic-tion, and for their direct usefulness in the clinical context. For example, the 70-gene MammaPrint signature is now marketed as a molecular diagnostic test to assess the risk of metastasis for breast cancer (van de Vijver et al., 2002).
Besides their predictive accuracy, signatures should bring useful biologi-cal information for further biomedibiologi-cal research, such as the identification of genes or pathways with strong prognostic power which may lead to a new understanding of the underlying biology, and eventually to the identification of new drug targets. However, the signatures proposed in different studies have generally very few genes in common, and it is now well documented that many non-overlapping signatures can have similar predictive accuracy (Ein-Dor et al., 2005). The lack of stability of signatures across datasets can also be observed within a given dataset, as signatures obtained after random perturbations of a given dataset can also have poor overlaps, i.e., lack stability (Abeel et al.,2009). An unfortunate consequence of this lack of stability is that the biological interpretation of possible functions and pathways underlying the signature is difficult a posteriori.
To remedy the lack of stability and the difficult interpretation of signa-tures, several authors have proposed to use side information, such as known biological pathways and gene networks, to analyze expression data and build signatures. For example,Chuang et al.(2007) identifies groups of connected genes in the network (subgraphs) differentially expressed between two con-ditions; Rapaport et al. (2007) proposed a formulation of support vector machines (SVM) to estimate a predictive model by constraining the weights of connected genes to be similar, allowing to associate positive or nega-tive contributions to regions of the network. These approaches assume that connected genes should contribute similarly to the class prediction, by com-puting average expression over subnetworks or assuming similar predictive weights of connected genes; however one may argue that this is too strong an hypothesis for many networks.
Here we investigate a related question: how to estimate a molecular signature, typically of a few tens of genes, that would be ”coherent” with a given gene network given a priori in the sense that genes in the signature would tend to be connected to each other in the network. Note that here we do not want to constrain connected genes in the signature to have similar
weights, we would just like them to be clustered in a limited number of connected components of the graph. The resulting connected components could then be more amenable to biological interpretation than individual genes, and could potentially be more stable across datasets due to the soft constraint induced on the choice of genes.
We assess the relevance of a new method named the graph Lasso, pro-posed recently byJacob et al. (2009), to automatically learn such a signa-ture given a training set of expression data and a gene network. The graph Lasso is an extension of the Lasso regressionTibshirani(1996), a widely-used and state-of-the-art method for feature selection and identification of sparse signature. In graph Lasso, the penalty used in the Lasso is modified to in-corporate the gene network information, leading to the selection of features that are often connected to each other. The resulting algorithm is a convex optimization problem, whose unique solution can be found by efficient op-timization methods. While the graph Lasso increases the interpretability of the signature by increasing the number of network edges between its compo-nents, it may suffer from lack of stability like many other feature selection methods including its cousin the Lasso. Recently randomization and ag-gregation have been proposed as a powerful way to increase the stability of feature selection methods in large dimensionAbeel et al.(2009). To further increase the stability of the graph Lasso, we propose a procedure akin to stability selection (Meinshausen and Buhlmann, 2009) in this context.
We evaluate the relevance of the resulting procedure for the estimation of a prognostic signature in breast cancer. We highlight in particular the increase in interpretability and stability resulting from the incorporation of a large gene network in the graph Lasso procedure, coupled with stability selection.
2
Methods
2.1 Learning a signature with the Lasso
Given a training set of gene expression data for p genes in n samples belong-ing to two classes (e.g., good and poor prognosis tumor samples), estimatbelong-ing a discriminative signature is a typical problem of feature selection for su-pervised classification. For example, a popular approach in bioinformatics is to select genes by ranking them according to their correlation with the class information (eg., van ’t Veer et al.,2002). Once genes are selected, it is necessary to estimate a predictive model using these genes only. In this study, we build on a different and increasingly popular approach in statisti-cal learning where the selection of features and the estimation of a predictive model using this features are more tightly coupled. For example, one may look for a model which predicts the outcome as well as possible under the constraint of involving as few genes as possible. A direct formulation of this
joint requirement is :
βsig = arg min
β∈RpL(β, data) + λ
p
X
j=1
1{βj6=0}, (1)
where L is a function measuring the error made by using β to predict the outcome on the data, and 1{βj6=0} is 1 if parameter βj is non-zero, 0
other-wise, so that the second term counts the number of non-zero elements in β. If β contains few zeros, many genes can be involved in the prediction and it is easy to make few errors on the training data, corresponding to small values for L. Conversely, if β is very sparse, then is becomes more difficult to discriminate the training set correctly. The optimum βsig is a trade-off
between these two extremes. The hyperparameter λ ≥ 0, which must be fixed before optimization, adjusts this tradeoff : at one extreme (λ = 0) all the genes are involved in the model, and at the other extreme we obtain βsig = 0 (no gene involved). Now the exact solution of problem (1) cannot
be computed even for a reasonable number of genes, due to the combina-torial nature of the problem. This motivates the introduction of methods such as the Lasso (Tibshirani,1996), where the second term is replaced by kβk1
∆
=Pp
j=1|βj|. The new problem can be solved exactly, and also results
in efficient feature selection.
2.2 The Graph Lasso
The group Lasso (Yuan and Lin,2006) is a useful variant of the Lasso when the features are clustered into groups a priori, and one wishes to select features by groups. It replaces the kβk1 term in the Lasso formulation by
P
g∈Gkβgk, where G is the set of groups of variables which should be either
all zero or all non-zero. Like kβk1 approximates the behavior of the count of
selected genes,P
g∈Gkβgk approximates the count of groups which have at
least one non-zero gene, and leads to solutions where several groups contain only genes at 0, which is exactly equivalent to selecting groups in G as long as G is a partition of the genes, i.e., that each gene belongs to one and only one group.
When some genes belong to several groups, a situation which arises for example when considering gene pathways as groups, the group lasso does not result anymore in the selection of a union of groups. In Jacob et al.(2009), a generalized version of this penalty was proposed which allows to select unions of pre-defined groups which potentially overlap, e.g. the pathways. The overlapping group lasso penalty was empirically shown to select fewer groups than the simple Lasso, and some results were given on its statistical properties, in particular its model selection consistency.
Another interesting case which can be handled by this last penalty is when a graph is defined on the genes, for example to represent biological in-formation such as co-regulation or protein-protein interaction. In this case,
finding a signature which is formed by few connected subgraphs instead of a mere list of genes can make the solution more interpretable as it defines new gene sets which are optimal to predict the outcome (Chuang et al., 2007). To obtain this effect, one can simply use an overlapping group lasso penalty, and define the groups to be the edges of the graph. Since the over-lapping group lasso leads to solutions in which a union of groups is selected, and since a union of is more likely to form few connected subgraphs than randomly chosen genes, one can expect that the solution will tend to form connected components. This effect was observed on some simple examples in Jacob et al. (2009). Here we investigate this effect more thoroughly on an outcome prediction problem.
2.3 Stability selection
An issue with many feature selection methods, including the Lasso, is their lack of stability in the presence of many highly correlated features, which is to be expected with gene expression. In order to improve stability of feature selection, randomization and aggregation have been proposed as a powerful way to increase the stability of feature selection methods in large dimension (Meinshausen and Buhlmann,2009;Abeel et al.,2009). The general idea is to repeat the feature selection process on many randomly perturbed training sets (e.g., by bootstrapping the samples in the original training set), and to keep the features that are often selected in this procedure.
We propose a group selection procedure to the graph lasso algorithm based on (Meinshausen and Buhlmann, 2009). The baseline of this proce-dure is shown in algorithm 1.
This randomization-based procedure computes the proability Πλ
g that an
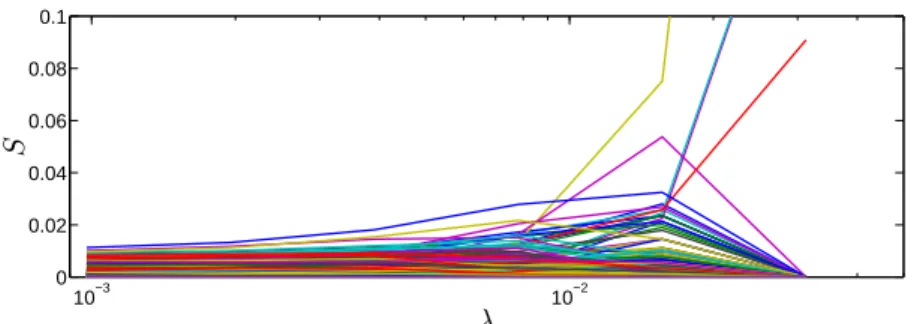
edge g is included in the signature for the parameter λ. Figure1 illustrates these probabilities as a function of λ for each edge g. From these probability curves, Meinshausen and Buhlmann (2009) suggests to select the features with the largest maximum probability over λ. While this is a nice way to select groups that are robust to the perturbations of the data, we found it hard to apply. Indeed, computation requires to fix a positive lower bound on λ and the probability for a given group to exceed the threshold increases when λ decreases, adding an extra parameter to be tuned. Therefore, we propose a slightly different way to score the groups according to their sta-bility across the perturbations of our data. For each edge g we define the following score: Sg = max λ∈Λ Πλ g P gΠλg ! ,
which is intuitively large for a group that often enters the signature very early, while many others are not yet considered as relevant. Note that this scoring function tends to decrease when λ decreases, since more and more
Input: Data Z = (X, Y ) divided into a training and a test sets, number of draws ndraw, Λ a grid
Output: Probabilities (Πλj)g=1...pgroups,λ∈Λ
for i ∈ {1...ndraw} do
Draw I a subsample of {1...n} of size [n/2] without replacement; for λ ∈ Λ do
Run a variable selection algorithm on I with regularization parameter λ;
Store the active set A(I, λ); end
end
for g ∈ {1...pgroups} do for λ ∈ Λ do
Compute the selection probability Πλ
g = P(g ∈ A(I, λ)|I);
end end
Algorithm 1:Stability Selection
10−3 10−2 10−1 0 0.1 0.2 0.3 0.4 0.5 0.6 0.7 0.8 0.9 1 λ Π
Figure 1: Stability selection scores for all edges, as a function of λ.
groups are selected. Moreover, it constitutes a way not to have to select a value for the regularization parameter. As a matter of fact, figure2 shows the scores that were computed for the groups from figure1. It is clear from this picture that most groups in the final signature are selected for an early λ.
Finally, we obtain a ranked list of edges by decreasing score, which allows us to define signatures of various sizes by selecting the groups whose scores are above a threshold. We note that, without stability selection, Lasso and
10−3 10−2 0 0.02 0.04 0.06 0.08 0.1 λ S
Figure 2: Sg-scores for all edges, as a function of λ.
graph Lasso also provide a ranked list of genes, in the order in which they enter the signature.
2.4 Preprocessing
In order to limit the computational burden and discard irrelevant genes we apply the following preprocessing steps each time a signature is built on a training set of gene expression.
• Scaling. Each gene is scaled to mean zero and variance one.
• Outliers. For each gene, we remove the outliers from the training set, i.e. for each gene g, the examples in set I are removed with I = {i, |xi,g| > 1.96}. We then compute the correlation between the
gene expression and the response.
• Threshold. We keep the ng genes with the greatest correlation with
the response. In practice we fix ng= 1500
• Genes kept. Among the ng genes, we discard those that are not
connected to any other genes in the gene network. This is to ensure that all genes have the possibility to get connected when the signature is built.
2.5 Postprocessing and accuracy computation
Given a signature A, we estimate a predictive model by fitting a logistic regression. The performance is estimated by 5-fold cross-validation, in terms of balanced accuracy, i.e. (sensitivity + specif icity)/2.
2.6 Connectivity of a signature
To quantify whether a set of genes is connected on the gene network, we compute the following connectivity score:
CA=
Size of the greatest connected component
The larger this score, the more connective the solution. The maximum score 1 is obtained if the active set consists of one and only connected component.
3
Data
We work on the Van’t Veer breast cancer data set fromvan de Vijver et al. (2002), and on the Wang dataset from Wang et al. (2005), both restricted to 8, 141 genes by Chuang et al. (2007). The Van’t Veer set contains 295 tumors, split into 78 metastatic and 217 non-metastatic ones, while the Wang dataset contains 286 tumors among which 106 are metastatic.
We borrow from Chuang et al. (2007) a human protein-protein interac-tion network comprising 57, 235 interacinterac-tions among 11, 203 proteins, inte-grated fom yeast two-hybrid experiments, predicted interactions via orthol-ogy and co-citation, and curation of the literature.
4
Results
Throughout this section, we use the Lasso as a baseline method for gene selection, and are interested in the effect of using the graph information and the stability selection on three main quantities. Our first criterion is the predictive accuracy obtained by each algorithm. This accuracy is estimated by the standard 5-fold cross-validation procedure, where the data is split into 5 parts, and each part is used to evaluate the performance of a model which is trained on the union of the 4 others. We use the same folding in all the experiments, and make sure that the ratio of metastasic and non-metastasic prognosis is the same across the 5 parts. Second, we consider the stability of signatures. This involves both the stability within a dataset with respect to random perturbations of the training set, which we estimate by the number of selected genes that are common to the five folds, and the stability across two different datasets, which we estimate by comparing the signatures estimated on the Van’t Veer and on the Wang datasets. Finally, we assess how connected the signature is on the biological graph of Chuang et al. (2007), as an indicator of its interpretability.
4.1 Preprocessing facts
Before further investigating the results, it is worth noting that after the preprocessing step where 1500 genes are kept in each fold, only 355 genes (connected through 901 edges) appear in the five folds after applying the procedure described in Section2.4on Van’t Veer data. On the Wang dataset, this reduction is even more dramatic : only 145 genes connected by 97 edges are selected in all folds. This illustrates the high instability of the gene selection when changing even partly the set of patients on which the
selection is made. This also upper-bounds the stability which is obtained by the learning algorithm, since some genes which are selected on one fold may not be present in another fold in the first place. Since the selection made in preprocessing does not follow the same criterion as the learning algorithm which selects the signature, it is technically possible that some genes would enter the signature if the preprocessing step was skipped. However, it is quite unlikely that the instability which is observed on the pre-processing procedure would be much reduced by directly using the learning algorithm. Regarding the upcoming assessment of the stability across the datasets, it is worth pointing out that, after pre-processing, the Van’t Veer and Wang datasets have only 118 genes in common, connected by 78 edges.
4.2 Accuracy
Figures3,4,5and6illustrate the 5-fold cross-validation performances on the Van’t Veer dataset for the four gene selection algorithms, i.e., respectively the Lasso, the Lasso with stability selection, the graph Lasso and the graph Lasso with stability selection. We plot the balanced accuracy as a function of the size of the signature.
All curves look quite similar. For all methods, we observe that the per-formance degrades when signature is too small. It appears that the accu-racies are overall very similar, i.e. neither the use of the graph information through the graph lasso penalty not the stability selection procedure signif-icantly change the performance.
0 10 20 30 40 50 60 70 80 90 100 0.45 0.5 0.55 0.6 0.65 0.7 0.75
Number of genes in the signature
B a la n c e d A c c u ra c y
Figure 3: Balanced accuracy of the unpenalized logistic regression model trained on the signature selected by the Lasso as a function of the size of the signature.
0 10 20 30 40 50 60 70 80 90 100 0.45 0.5 0.55 0.6 0.65 0.7
Number of genes in the signature
B a la n c e d A c c u ra c y
Figure 4: Balanced accuracy of the unpenalized logistic regression model trained on the signature selected by the Lasso with stability selection, as a function of the size of the signature.
0 10 20 30 40 50 60 70 80 90 100 0.4 0.45 0.5 0.55 0.6 0.65 0.7 0.75
Number of genes in the signature
B a la n c e d A c c u ra c y
Figure 5: Balanced accuracy of the unpenalized logistic regression model trained on the signature selected by the graph Lasso as a function of the size of the signature.
In all cases, signatures with less than 30 genes are less performant. How-ever, there does not seem to be a clear number of genes that comes out as the best performer. We decide to look further into the four signatures of size 60. It seems a reasonable size according to the signatures proposed in the literature.
0 10 20 30 40 50 60 70 80 90 100 0.4 0.45 0.5 0.55 0.6 0.65 0.7 0.75
Number of genes in the signature
B a la n c e d A c c u ra c y
Figure 6: Balanced accuracy of the unpenalized logistic regression model trained on the signature selected by the graph Lasso with stability selection, as a function of the size of the signature.
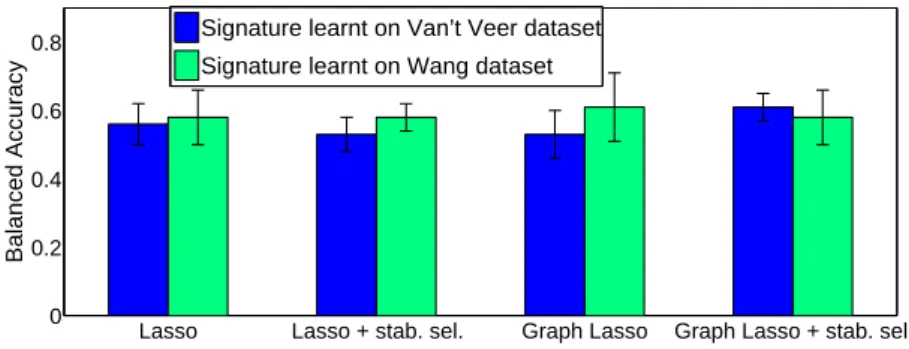
a useful signature on the independent Wang dataset. We thus train four classifiers on the Wang dataset described in Section3restricted to the genes present in each of the four signatures obtained on Van’t Veer dataset. We also train four classifiers using the same algorithms as the ones used to generate the signatures on the Wang dataset directly. The objective is to assess what we lose when selecting the genes on a different dataset for the four algorithms.
The results obtained are shown on Figure 7. They suggest that signa-tures estimated on the Van’t Veer dataset are in fact almost as good on Wang as signatures estimated on Wang itself, if not better in the case of the graph Lasso with stability selection procedure.
Lasso Lasso + stab. sel. Graph Lasso Graph Lasso + stab. sel. 0 0.2 0.4 0.6 0.8 Balanced Accuracy
Signature learnt on Van’t Veer dataset Signature learnt on Wang dataset
Figure 7: Balanced accuracy on the Wang dataset when selecting the genes on Wang (green) and Van’t Veer (blue) datasets for the four algorithms.
4.3 Stability
Here we compare the stability of gene selection by the algorithms, i.e. our concerns are both the number of genes selected frequently in the five folds and the intersection of the signatures learnt on two different sets of data.
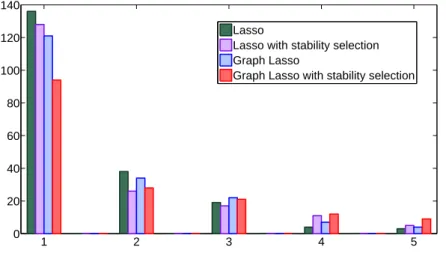
Figure 8which shows how many genes are in the signatures of 1, 2, 3, 4 or 5 of the five folds, for each algorithm. A stable feature selection method should have more genes occurring five times, and less genes occurring only once. 1 2 3 4 5 0 20 40 60 80 100 120 140 Lasso
Lasso with stability selection Graph Lasso
Graph Lasso with stability selection
Figure 8: Number of genes present in exactly 1, 2, 3, 4 and 5 of the 5 folds for the four algorithms.
From a stability point of view, a first improvement over the Lasso is due to the grouping of the variables, as the graph Lasso shows more overlap of more than three folds. However, it appears clearly that stability selection further improve the number of overlaps. Thus, the best stabilization perfor-mance is logically obtained by the graph Lasso with stability selection, that combines these two advantages.
Obviously, even though grouping and randomization give better stability results, the solution is still very inconsistent across folds. We believe that this might be due to the heterogeneity of our dataset, more precisely to the fact that there are different tumor subtypes which we consider altogether instead of as many as there are subtypes. However the small size of our data set does not allow us to do so.
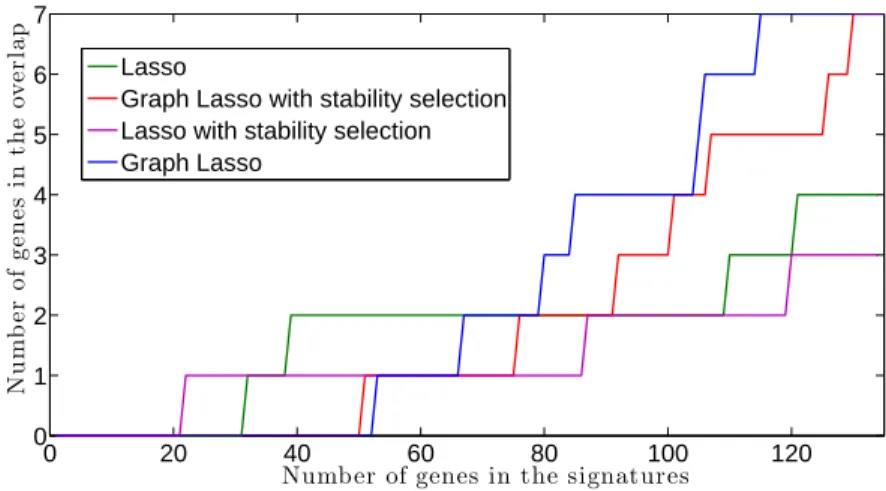
A different question is whether these algorithms achieve an overlap be-tween two signatures learnt on different datasets, i.e. for what we may hope in terms of reproducibility or exportability of the signatures. Figure9sheds some light on this question for it shows the number of genes found in the two signatures from Van’t Veer and Wang datasets respectively. While it
seems difficult to achieve overlapping with a signature smaller than a few dozen, grouping variables a priori still seems to be a way to improve the reproducibility. Randomization does apparently not improve this type of stability. 0 20 40 60 80 100 120 0 1 2 3 4 5 6 7
Number of genes in the signatures
N u m b e r o f g e n e s in th e o v e rl a p Lasso
Graph Lasso with stability selection Lasso with stability selection Graph Lasso
Figure 9: Number of genes present in both the signature generated on the Van’t Veer and the Wang datasets, as a function of the number of genes considered in the signature.
However, even when we do find some genes overlapping between the two signatures, there are very few of them. We believe that there could be two main explanations for this fact. First, the distribution of the tumor subtypes may be very different from a dataset to another, leading to very different overall expression patterns. Second the normalization of the data also probably plays a disrupting role for the matter of stability.
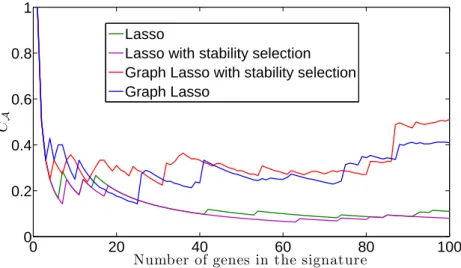
4.4 Connectivity
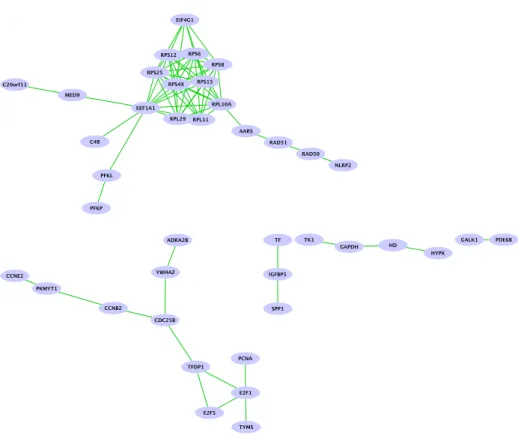
Given a graph, it may be interesting to look at the connectivity of the so-lution, i.e. the number and the size of the connected components induced by a selected signature. Recall that we use the scoring function defined by equation (2). First, it is worth noting that both the Lasso ran as a single algorithm and the Lasso with stability selection induce very low connectivity (see figure10). However, it seems that using prior information from a graph, e.g. running either a group Lasso algorithm with edges as groups or that same procedure with stability selection greatly improves the connectivity. Note that using stability selection does not significantly improve the con-nectivity of the solution. This suggests that mostly the prior is responsible for it i.e. the way to choose the groups, in this case as edges from a graph. Figure 12 shows the two 60-genes signatures obtained with the graph Lasso with stability selection and the Lasso.
0 20 40 60 80 100 0 0.2 0.4 0.6 0.8 1
Number of genes in the signature
C
A
Lasso
Lasso with stability selection Graph Lasso with stability selection Graph Lasso
Figure 10: Connectivity index of the signatures as a function of the number of genes considered in the signature.
Figure 12: Signature obtained with the graph Lasso algorithm with stability selection.
Obviously, the graph Lasso with stability selection provides a signature that is biologically more relevant than the one chosen with the Lasso. Indeed, the connected components are related to biological processes (see section4.5) and hence make more sense as a whole.
4.5 Biological Interpretation
Two main connected components are induced by the signature showed in figure 12. The largest includes 20 genes, among which 9 are ribosomal proteins. This component also includes RAD50 and RAD51, which are two known DNA repair genes that also belong to the ATMPathway (Tumor Suppressor) and the ATRBRCAPathway along with BRCA1 and BRCA2. The second largest component almost exclusively contains genes involved in cell cycle, such as transcription factor E2F 1, cyclins CCN B2 and CCN E2 or cell division cycle gene CDC25B.
Among the 29 genes left in the signature, two more are involved in cell cyle and five belong to known cancer pathways.
The second signature (from the Lasso algorithm) is harder to interpret since many genes are singletons. The largest connected component (of size 6) contains 4 genes from the ribosomes. 6 genes in the rest of the signature are known to be involved in some cancer pathways and 4 belong to the cytokine-cytokine receptor interaction pathway. Overall, the second signature is less interpretable in terms of biological functions than the first one.
These informations were found using both the KEGG pathways and the canonical pathways from MsigDB.
5
Discussion
In these experiments we assessed the effect of using a biological graph and stability selection on various characteristics of the solution. A first im-portant remark is that neither of these methods significantly improved the estimated prediction accuracy. On the one hand this is a negative result, as one could have expected that incorporating prior biological information or selecting more stable signatures would improve the performance. On the other hand, the methods are intended to promote the connectivity of the signature on the graph and making the signature more robust to changes in the set of patients respectively. Each method seems to succeed at the task it is intended for : stability selection tends to produce more stable sig-natures accross the 5 folds and graph lasso outputs sigsig-natures which form a few interpretable connected components on the biological while signature given by the Lasso essentially gives a list of disconnected genes which then have to be interpreted independently. These two improvements are obtained without harming the prediction accuracy, i.e., these methods allow to obtain signatures which are as effective as the one output by the Lasso with the additional benefit of being more stable and more interpretable.
We note however that the obtained signatures remain quite unstable when changing the set of patients (e.g. by considering the different folds). A first factor which can explain this variability is the fact that the considered datasets contain several subtypes of breast cancer tumors, some of which (e.g. basal versus luminal) are considered by practitioners to be distinct diseases, known to involve distinct biological processes. Finding a unique signature across these different signals may not be possible, and considering different models for the different subtypes, or a global model taking these differences into account may be a better option, although the subtypes are not strictly defined, and very few patients are available for some of them.
Another possible explanation is that there does not exist such a small set of genes which are much more involved than the others in the process of metastasis, e.g. that the underlying signal is not sparse at the gene level, so
that small changes in the dataset give very different restricted signatures. This of course would not imply that finding a small set of genes with a good predictive power (e.g. to build prognosis tools) is hopeless, only that there is no “true” signature and that there is no point to looking for something stable against variations in the dataset. Even in this case, looking for signatures under some constraints which make them suitable for analysis, like the one of being connected on a pre-defined graph may uncover various important aspects of the biological process.
References
Abeel, T., Helleputte, T., Van de Peer, Y., Dupont, P., and Saeys, Y. (2009). Robust biomarker identification for cancer diagnosis with ensemble feature selection methods. Bioinformatics. Alizadeh, A. A., Eisen, M. B., Davis, R. E., Ma, C., Lossos, I. S., Rosenwald, A., Boldrick, J. C., Sabet,
H., Tran, T., Yu, X., Powell, J. I., Yang, L., Marti, G. E., Moore, T., Hudson, J., Lu, L., Lewis, D. B., Tibshirani, R., Sherlock, G., Chan, W. C., Greiner, T. C., Weisenburger, D. D., Armitage, J. O., Warnke, R., Levy, R., Wilson, W., Grever, M. R., Byrd, J. C., Botstein, D., Brown, P. O., and Staudt, L. M. (2000). Distinct types of diffuse large B-cell lymphoma identified by gene expression profiling. Nature, 403(6769), 503–511.
Chuang, H.-Y., Lee, E., Liu, Y.-T., Lee, D., and Ideker, T. (2007). Network-based classification of breast cancer metastasis. Mol. Syst. Biol., 3, 140.
Ein-Dor, L., Kela, I., Getz, G., Givol, D., and Domany, E. (2005). Outcome signature genes in breast cancer: is there a unique set? Bioinformatics, 21(2), 171–178.
Golub, T. R., Slonim, D. K., Tamayo, P., Huard, C., Gaasenbeek, M., Mesirov, J. P., Coller, H., Loh, M. L., Downing, J. R., Caligiuri, M. A., Bloomfield, C. D., and Lander, E. S. (1999). Molecular Classification of Cancer: Class Discovery and Class Prediction by Gene Expression Monitoring. Science, 286, 531–537.
Jacob, L., Obozinski, G., and Vert, J. (2009). Group Lasso with Overlap and Graph Lasso. In Proc. ICML.
Meinshausen, N. and Buhlmann, P. (2009). Stability selection. Preprint, arXiv , 809.
Ramaswamy, S., Tamayo, P., Rifkin, R., Mukherjee, S., Yeang, C., Angelo, M., Ladd, C., Reich, M., Latulippe, E., Mesirov, J., Poggio, T., Gerald, W., Loda, M., Lander, E., and Golub, T. (2001). Multiclass cancer diagnosis using tumor gene expression signatures. Proc. Natl. Acad. Sci. USA, 98(26), 15149–15154.
Rapaport, F., Zynoviev, A., Dutreix, M., Barillot, E., and Vert, J.-P. (2007). Classification of microarray data using gene networks. BMC Bioinformatics, 8, 35.
Tibshirani, R. (1996). Regression shrinkage and selection via the lasso. J. Royal. Statist. Soc. B., 58(1), 267–288.
van de Vijver, M. J., He, Y. D., van’t Veer, L. J., Dai, H., Hart, A. A. M., Voskuil, D. W., Schreiber, G. J., Peterse, J. L., Roberts, C., Marton, M. J., Parrish, M., Atsma, D., Witteveen, A., Glas, A., Delahaye, L., van der Velde, T., Bartelink, H., Rodenhuis, S., Rutgers, E. T., Friend, S. H., and Bernards, R. (2002). A gene-expression signature as a predictor of survival in breast cancer. N. Engl. J. Med., 347(25), 1999–2009.
van ’t Veer, L. J., Dai, H., van de Vijver, M. J., He, Y. D., Hart, A. A. M., Mao, M., Peterse, H. L., van der Kooy, K., Marton, M. J., Witteveen, A. T., Schreiber, G. J., Kerkhoven, R. M., Roberts, C., Linsley, P. S., Bernards, R., and Friend, S. H. (2002). Gene expression profiling predicts clinical outcome of breast cancers. Nature, 415(6871), 530–536.
Wang, Y., Klijn, J., Zhang, Y., Sieuwerts, A., Look, M., Yang, F., Talantov, D., Timmermans, M., Meijer-van Gelder, M., Yu, J., et al. (2005). Gene-expression profiles to predict distant metastasis of lymph-node-negative primary breast cancer. The Lancet, 365(9460), 671–679.
Yuan, M. and Lin, Y. (2006). Model selection and estimation in regression with grouped variables. J. R. Stat. Soc. Ser. B, 68(1), 49–67.