2
REMERCIEMENTS
Je tiens à exprimer ma gratitude à mes directeurs de thèse, Monsieur le Professeur A. Sarrafi et Monsieur le Professeur B. Yazdi-Samadi pour la confiance qu’ils m’ont témoigné en me proposant ce sujet, pour leurs précieux conseils et grande disponibilité. Ces quelques années ont été pour moi très enrichissantes, tant sur le plan professionnel que sur le plan humain.
Je tiens à exprimer ma profonde reconnaissance à Monsieur le Dr. P. Vincourt et Dr. N.B. Langlade, qui en m’accueillant dans leur équipe, au sein du Laboratoire PV de l’INRA, m’ont permis de réaliser une partie important de ce travail.
Je remercie Monsieur le Professeur Y. Henry de l’Université Paris-Sud et Professeur M. Valizadeh de m’avoir fait l’honneur d’accepter d’être rapporteurs de ce travail. Qu’ils trouvent ici l’expression de ma plus haut considération.
Je tiens à exprimer ma profonde reconnaissance à Dr M. Berger et Dr. A. Calmon, qui en m’accueillant dans leur équipe, au sein du Laboratoire d'Agro-Physiologie de l’Ecole d’Ingénieurs de Purpan, pour la réalisation d’une partie de ce travail.
Merci à l’ambassade de France en Iran, particulièrement Dr. Duhamel et Madame Mirbaha, pour avoir financé mon séjour en France.
Je tiens à remercier chaleureusement tous les membres scintific Unversité de Téhéran, en particulier, j'adresse un grand merci à M. le Prof. A. Zali et M. le Prof. M.R. Naghavi et à Monsieur M. Kamali.
J’adresse également un immense merci à Dr D. Rengel et Monsieur N. Pouilly pour toutes les connaissances qu’ils m’ont apportées.
Je voudrais vivement remercier tous les membres du laboratoire PV de l’INRA pour m’avoir accueillie si chaleureusement. Je garderai un merveilleux souvenir de ces années passées parmi eux. Tout particulièrement, j’adresse un grand merci à Dr. L Godiard, Mlle A. Bordat et M. F. As-Sadi qui ont rendu mon quotidien plus agréable au cours de ces quelques années.
Pour finir, un grand merci à mes parents et mes amis (M. Ghadrdan, Mlle A. Kalantari, Dr A. Ebrahimi et tous les autres) qui m’ont supporté.
Abstract:
The genetic control of tocopherol, phytosterol, percentage of seed protein, oil and fatty acids content in a population of recombinant inbred lines (RILs) of sunflower under various conditions are studied through QTL analysis using genetic-linkage map based on SSR markers and introducing some important tocopherol and phytosterol pathway-related genes, enzymatic antioxidant-related genes, drought-responsive family genes and Arabidopsis SEC14 homologue genes. Three important candidate genes (HPPD, VTE2 and VTE4), which encode enzymes involved in tocopherol biosynthesis, are mapped to linkage group 8(LG8) and LG14. One of the most important candidate genes coding for sterol methyltransferase II (SMT2) enzyme is anchored to LG17 by CAPS marker. Four SNPs are identified for
PAT2, Arabidopsis Sec14 homologue gene, between two parents (PAC2 and RHA266). PAT2 is assigned
to LG2 by CAPS marker. Squalene epoxidase (SQE1) is also assigned to LG15 by InDel marker. Through other candidate genes, POD, CAT and GST encoding enzymatic antioxidants are assigned to LG17, LG8 and LG1, respectively. The major QTL for total tocopherol content on linkage group 8 accounted for 59.5% of the phenotypic variation (6.TTC.8), which is overlapped with the QTL of total phytosterol content (7.TPC.8). Under late-sowing condition, a specific QTL of palmitic acid content on linkage group 6 (PAC-LS.6) is located between ORS1233 and SSL66_1 markers. Common chromosomic regions are observed for percentage of seed oil and stearic acid content on linkage group 10 (PSO-PI.10 and
SAC-WI.10) and 15 (PSO-PI.15 and SAC-LS.15). Overlapping occurs for QTLs of oleic and linoleic acids
content on linkage groups 10, 11 and 16. Seven QTLs associated with palmitic, stearic, oleic and linoleic acids content are identified on linkage group 14. These common QTLs are linked to HPPD homologue, HuCL04260C001. QTLs controlling various traits such as days from sowing to flowering, plant height, yield and leaf-related traits are also identified under well-, partial-irrigated and late-sowing conditions in a population of recombinant inbred lines (RILs). The results do emphasis the importance of the role of linkage group 2, 10 and 13 for studied traits. Genomic regions on the linkage group 9 and 12 are important for QTLs of leaf-related traits in sunflower. We finally identified AFLP markers and some candidate genes linked to seed-quality traits under well-irrigated and water-stressed conditions in gamma-induced mutants of sunflower. Two mutant lines, M8-826-2-1 and M8-39-2-1, with significant increased level of oleic acid can be used in breeding programs because of their high oxidative stability and heart-healthy properties. The significant increased level of tocopherol in mutant lines, 862-1N1 and M8-641-2-1, is justified by observed polymorphism for tocopherol pathway-related gene; MCT. The most important marker for total tocopherol content is E33M50_16 which explains 33.9% of phenotypic variance. One of the most important candidate genes involving fatty acid biosynthesis, FAD2 (FAD2-1), is linked to oleic and linoleic acids content and explained more than 52% of phenotypic variance.
4
Résumé:
Le tocophérol, le phytostérol, le pourcentage de protéines des graines, l'huile et les teneurs en acides gras ont été mesurés dans une population de lignées recombinantes (RILS) de tournesol, cultivées sous conditions de sécheresse, irrigation et semis tardif. Une analyse génétique de QTL a été réalisée à partir de ces mesures, en utilisant une carte génétique basée sur des marques SSR et avec des gènes candidats (1) impliqués dans la voie métabolique de tocophérol et phytostérol, (2) des gènes codant des antioxydants enzymatiques, (3) des gènes liés à la sécheresse et (4) des gènes homologues à SEC14 chez Arabidopsis. Trois gènes candidats importants (VTE4, VTE2 et HPPD), qui codent pour des enzymes impliquées dans la biosynthèse du tocophérol, ont été cartographiés sur les groupes de liaison LG8 et LG14. Quatre SNPs sont identifiés pour PAT2, le gène homologue chez Arabidopsis SEC14, entre les deux parents (PAC2 et RHA266) et un SNP, identifié par alignement de séquences est converti en marqueur CAPS pour permettre l'analyse génotypique des RIL. Les gènes homologues à SFH3, HPPD, CAT et CYP51G1 ont été cartographiés grâce à la mise au point de marqueurs dominants, tandis que des marqueurs co-dominants ont permis la cartographie des gènes homologues à SEC14-1, VTE4, DROU1, POD, SEC14-2 et AQUA. Les gènes POD, CAT et GST, codant pour des antioxydants enzymatiques, ont également été cartographiés sur les groupes de liaison 17, 8 et 1, respectivement. Le QTL majeur pour la teneur en tocophérol a été identifié sur le groupe de liaison 8, qui explique 59,5% de la variation phénotypique (6.TTC.8). Il colocalsie également avec le QTL identifié pour la teneur en phytostérol (7.TPC.8). Sous condition de semis tardif, un QTL spécifique de la teneur en acide palmitique a été identifié sur le groupe de liaison 6 (PAC-LS.6). Il est situé entre les marqueurs ORS1233 et SSL66_1. Les QTLs pour le pourcentage d'huile de graines et la teneur en acide stéarique colocalisent sur les groupes de liaison 10 (PSO-PI.10 et SAC-WI.10) et 15 (PSO-PI.15 et SAC-LS.15). Sept QTLs associés à teneur en acides palmitique, stéarique, oléique et linoléique sont identifiés sur le groupe de liaison 14. Ils sont liés à l’homologue du gène HPPD. Par ailleurs, les caractères agronomiques tels que les jours du semis à la floraison, la hauteur des plantes, le rendement et la morphologie foliaire ont été étudiés. Des analyses association génétique ont permis d’identifier des QTLs intérêts sur les groupes de liaison 2, 10 et 13 pour les caractères étudiés, d’autres QTLs identifies sur les groupes de liaison 9 et 12 mettent en avant l'importance de ces régions génomiques pour les caractères de morphologie foliaire. Nous avons finalement identifié des marqueurs AFLP et quelques gènes candidats liés aux caractères impliqués dans la qualité des graines sous conditions irriguée et stress hydrique chez une population de mutants (M8). Deux lignées mutantes, M8-826-2-1 et M8-39-2-1, produisent un niveau significativement élevé d'acide oléique peuvent être utilisées dans les programmes de sélection en raison de la haute stabilité à l'oxydation et des propriétés cardiovasculaire apportés par l’acide oléique qu’elles produisent. L'augmentation du niveau de tocophérol dans les lignées mutantes, M8-862-1N1 et M8-641-2-1, est justifiée par le polymorphisme observé pour le gène, MCT, impliqué dans la voie métabolique du tocophérol. Le marqueur le plus important pour le contenu en tocophérol total est E33M50_16 qui explique 33,9% de la variation phénotypique. Un des gènes candidats les plus importants concernant la biosynthèse des acides gras, FAD2 (FAD2-1), est lié à la teneur en acides oléique et linoléique. Il explique plus de 52% de la variation phénotypique.
Abbreviations:
RILs: recombinant inbred lines DSF: days from sowing to flowering PH: plant height
LN: leaf number
DLN: dried leaf number LAF: leaf area at flowering LAD: leaf area duration HD: head diameter HW: head weight HN: head number
TGW: 1000 grain weight GYP: grain yield per plant BIO: biomass
PSP: percentage of seed protein PSO: percentage of seed oil PAC: palmitic acid content SAC: stearic acid content OAC: oleic acid content LAC: linoleic acid content TTC: total tocopherol content TPC: total phytosterol content
CG: candidate genes
HRM: high-resolution melting
CAPS: cleaved amplified polymorphic sequence
GG: genetic gain
6 Contents
Chapter 1: General introduction
1.1 Sunflower ... 13
1.2 Seed and germination ... 14
1.3 Sunflower seed compositions ... 14
1.3.1 Protein ... 15
1.3.2 Fatty acids ... 15
1.3.3 Tocopherol and phytosterol ... 15
1.3.3.1 Tocopherol pathway ... 16
1.3.3.1.1 Synthesis of homogentisic acid (HGA) ... 17
1.3.3.1.2 Synthesis of phytylpyrophosphate (PDP) ... 17
1.3.3.1.3 Joining of HGA and PDP ... 19
1.3.3.1.4 Methylation of an aromatic ring ... 21
1.4 Molecular map of sunflower ... 21
1.5 Objectives ... 21
Chapter 2: Materials and methods
2.1 Plant materials ... 242.1.1 Population of recombinant inbred lines (RILs) ... 24
2.1.2 Population of mutants (M8)... 24
2.2 Experimental conditions ... 24
2.2.1 Experimental conditions for RILs ... 24
2.2.2 Experimental conditions for mutants ... 25
2.3 Trait measurements ... 25
2.3.1 Morpho-physiological traits ... 25
2.3.2 Seed-quality traits ... 26
2.3.2.1 Solvent extraction of lipids ... 27
2.3.2.2 Tocopherol determination ... 27
2.3.2.3 NIRS calibration ... 27
2.4 Molecular analysis ... 28
2.4.1 DNA Extraction and PCR program ... 29
2.4.2 AFLP genotyping ... 29
2.4.3 Candidate Genes (CGs) ... 29
2.4.4 High-Resolution Melting (HRM) ... 29
2.4.5 Cleaved Amplified Polymorphic Sequence (CAPS) marker ... 30
2.5 Statistical analysis ... 30
2.5.2 Statistical analysis for mutants ... 30
2.6 QTL and map construction ... 31
Chapter 3: Genetic dissection of tocopherol and
phytosterol in recombinant inbred lines of
sunflower through QTL analysis and the
candidate gene approach
Abstract ... 333.1 Introduction ... 34
3.2 Materials and methods ... 36
3.2.1 Plant materials and experimental conditions ….…...……..36
3.2.2 Trait measurements …….………..………...37
3.2.3 Molecular and statistical analysis ... 39
3.2.3.1 DNA Extraction and PCR program ... 39
3.2.3.2 Candidate Genes (CGs) ... 39
3.2.3.3 High-Resolution Melting (HRM) ... 40
3.2.3.4 Cleaved Amplified Polymorphic Sequence (CAPS) marker40 3.2.4 Statistical analysis and map construction ... 40
3.3 Results ... 41
3.3.1 Phenotypic variation ... 41
3.3.2 Linkage map ... 42
3.3.3 QTL analysis ... 43
3.4 Discussion ... 43
Chapter 4: Genetic control of protein, oil and fatty
acids content under partial drought stress and late
sowing conditions in sunflower
Abstract ... 674.1 Introduction ... 67
4.2 Materials and methods ... 70
4. 2.1 Plant materials and experimental conditions... 70
4.2.2 Trait measurements ... 70
8
4.3 Results ... 71
4.3.1 Phenotypic variation ... 71
4.3.2 QTL analysis ... 72
4.4 Discussion ... 73
Chapter 5: QTL analysis of agronomic traits in
recombinant inbred lines of sunflower under
partial irrigation
Abstract ... 895.1 Introduction ... 90
5.2 Materials and methods ... 91
5.2.1 Plant materials and experimental conditions... 91
5.2.1 Investigation of agronomic traits ... 91
5.2.3 QTL and statistical analysis ... 92
5.3 Results ... 92
5.4 Discussion ... 94
Chapter 6: QTL mapping of morpho-physiological
traits in recombinant inbred lines of sunflower
under different sowing dates
Abstract ... 1086.1 Introduction ... 108
6.2 Materials and methods ... 110
6.2.1 Plant materials and experimental conditions... 110
6.2.2 Traits measurement ... 110
6.2.3 QTL and statistical analysis ... 110
6.3 Results ... 111
6.3.1 Analysis of variance and phenotypic variation ... 111
6.3.2 Linkage map and QTL mapping ... 111
6.3.2.1 QTLs for DSF and PH ... 112
6.3.2.2 QTLs controlling leaf-related traits ... 112
6.3.2.2 QTLs controlling yield-related traits ... 112
6.4 Discussion... 113
6.4.1 Phenotypic variation among genotypes ... 113
6.4.2 QTLs controlling DSF and PH ... 113
6.4.4 QTLs controlling yield-related traits ... 115
Chapter 7: Genetic variability of seed-quality
traits in sunflower mutants under water-stressed
condition
Abstract ... 1317.1 Introduction ... 131
7.2 Materials and methods………. ….………….…..133
7.2.1 Plant materials and experimental conditions....………..…....133
7.2.2 Trait measurements………. ….………133 7.2.3 Molecular analysis …….………..……….…135 7.2.4 Statistical analysis .…….………..……….…136 7.3 Results.........136 7.3.1 Phenotypic variation......… ...... ……...……… ...... …136 7.3.2 Molecular analysis..…….………..…....……....……137 7.4 Discussion...………...………...…137 Conclusion et Perspective…..……….………150 References……….……….…..………160 Appendix..……….……….…..………176 .
10
List of figures and tables
Chapter 1: General introduction
Fig. 1.1 ...14 Fig. 1.2 ...16 Fig. 1.3 ...17 Fig. 1.4 ...18 Fig. 1.5 ...19 Fig. 1.6 ………..20
Chapter 2: Materials and methods Fig. 2.1……….………..26
Fig. 2.2……….………..28
Chapter 3: Genetic dissection of tocopherol and phytosterol in recombinant inbred lines of sunflower through QTL analysis and the candidate gene approach Table 3.1………..……..48 Table 3.2………..……..50 Table 3.3………..……..50 Table 3.4……….….…..51 Table 3.5……….….…..52 Table 3.6……….….…..53 Fig. 3.1 ………..………55 Fig. 3.2 ………..………56 Fig. 3.3 ………..………57 Fig. 3.4 ………..………58
Chapter 4: Genetic control of protein, oil and fatty acids content under partial drought stress and late sowing conditions in sunflower Table 4.1……….………….….….77 Table 4.2……….…….….….78 Table 4.3……….…….….….79 Table 4.4……….…….….….80 Fig. 4.1……….…….….…83 Fig. 4.2……….….….……84
Chapter 5: QTL analysis of agronomic traits in recombinant inbred lines of sunflower under partial irrigation Table 5.1………..……….……97
Table 5.2………..……….…….98
Table 5.4………..………....…100
Fig. 5.1………..………..………….……101
Chapter 6: QTL mapping of morpho-physiological traits in recombinant inbred lines of sunflower under different sowing dates Table 6.1……….117 Table 6.2……….118 Table 6.3………..119 Table 6.4………..120 Table 6.5……….121 Table 6.6………..122 Table 6.7………..123 Table 6.8………..…124 Fig. 6.1 ………126
Chapter 7: Genetic variability of seed-quality traits in sunflower mutants under water-stressed condition Table 7.1………..141 Table 7.2………..143 Table 7.3………..144 Table 7.4………..145 Fig. 7.1 ………..………..147 Fig. 7.2 ………148 Fig. 7.3 ………149
12
Chapter 1
1.1 Sunflower
Sunflower (Helianthus annuus L.) is a member of the family Compositae (Asteraceae). The basic chromosome number is n = 17. The genus includes diploid, tetraploid and hexaploid species. The closest relatives appear to be Tithonia, Viguiera and Phoebanthus (Heiser et al. 1969). The common sunflower (H. annuus) is the most important species grown commercially, although other species are also cultivated, e.g. H. tuberosus, which is grown for production of edible tubers, and several other species grown as ornamentals.
Sunflower (Helianthus annuus L.) is one of the few crop species that originated in North America. It was probably a "camp follower" of several of the western native American tribes who domesticated the crop (possibly 1000 BC) and then carried it eastward and southward of North America. Sunflower was probably first introduced to Europe through Spain, and spread through Europe as a curiosity until it reached Russia where it was readily adapted. The Spanish name for sunflower, ‘‘girasol,’’ and the French name ‘‘tournesol’’ literally mean ‘‘turn with the sun,’’ a trait exhibited by sunflower until anthesis, after which the capitula (heads) face east. Heiser et al. (1969) proposed a species classification of the genus Helianthus including 14 annual and 36 perennial species from North America (in three sections and seven series) and 17 species from South America. More recent classifications (Jan and Seiler 2007) have introduced some modifications. The new classification brings the number of species to 51, with 14 annual and 37 perennial species.
Sunflower seed oil is the fourth most important vegetable oil in world trade at present. Conventional sunflower produces a healthful oil with great consumer acceptance because of its high content of monounsaturated and polyunsaturated fatty acids as well as high vitamin E content. In recent years, new sunflower oil types for specific applications, mainly in the food industry, have been developed through conventional breeding approaches. Unlike other oilseed crops such as soybean and canola, commercial sunflower has not been subject to transgenic breeding so far. However, sunflower breeders have been very successful in attaining a wide diversity of breeding objectives, from developing novel seed oil quality types to incorporating genetic resistance to most of the pests and diseases that threaten the crop.
14
1.2 Seed and germination
A sunflower seed is an ‘Achene’. When dehulled, the edible remainder is called the ‘sunflower kernel’. The ‘seed coat’ consists of the ovary wall and testa fused together. The sunflower’s germination differs from the broad bean and pea because, once the radicle has emerged, it is the hypocotyl which elongates. This has the effect of either dragging the cotyledons from the fruit wall or carrying the entire fruit above soil. Hypocotyl elongates and draws cotyledons from the fruit wall. Often the fruit wall is carried out of the soil with the cotyledons. It falls off when the cotyledons expand. All steps of sunflower seed germination are illustrated in Fig 1.1.
Fig. 1.1 Sunflower seed germination a) radicle emerges b) hypocotyl elongates and draws cotyledons from the fruit wall c) cotyledons are brought above the soil d) cotyledons open out, exposing the plumule
(www.biology-resources.com/documents/plants-seeds-4.doc) hypocotyl root hairs hypocotyl root hairs lateral roots cotyledons plumule a b c d radicle
1.3 Sunflower seed compositions
1.3.1 Protein
Sunflower is an important oil seed crop that can also be a valuable source of protein. Sunflower meal is a potential source of protein for human consumption owing to its high nutritional value and lack of antinutritional factors (Sosulski 1979). The structure and functionality of two major protein fractions in sunflower seed are described in detail by Gonzàlez-Pérez and Vereijken (2007).
.3.2 Fatty acids
Sunflower seed oil is composed of unsaturated fatty acids (90%); oleic and linoleic acids and the rest (10%) containing saturated fatty acids; palmitic and stearic acids (Dorrel and Vick, 1997; Pérez-Vich et al., 2002a).
Biosynthesis of fatty acids is now well understood in sunflower seeds. Palmitic acid can be generated by fatty acid synthetase I (FASI) (Cantisán et al., 2000). Stearic acid is formed from palmitic acid by fatty acid synthetase II (FACII), which lengthens palmitic acid (16:0) by two carbon atoms to produce stearic acid (18:0) (Pleite et al., 2006). Later, stearic acid can be either desaturated by ∆9-desaturase (stearoyl-ACP desaturase) which catalyses the first desaturation of stearic acid (18:0) to oleic acid (18:1) (Heppard et al., 1996; Lacombe et al., 2001; Vega et al., 2004) or hydrolyzed by acyl-ACP thioesterase. Finally, linoleic acid is formed from oleic acid by ∆12-desaturase (oleoyl-PC desaturase), which catalyses the second desaturation of oleic acid (18:1) to linoleic acid (18:2) (Garcés and Mancha, 1991).
1.3.3 Tocopherol and phytosterol
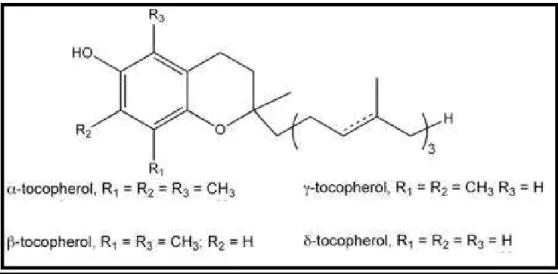
Sunflower contains minor components such as tocopherol and phytosterol with interesting properties for human health. Tocopherols are fat-soluble compounds with vitamin E activity. In sunflower seed oil, total tocopherol content represents the sum of α, β, γ, and δ tocopherol and total phytostertol content is the sum of campesterol, stigmasterol, β-sitosterol, ∆7-campesterol, ∆5-avenasterol, ∆7-stigmasterol and ∆7-avenasterol (Ayerdi Gotor et al. 2007). Forms of tocopherol determined by the number of methyl groups on the chromanol ring (Fig 1.2). Oilseed crops reveal large variation in the levels of the different tocopherols and total
16
tocopherol content (Marwede et al. 2005). In sunflower seed oil, 96% of total tocopherol is α tocopherol whereas in soybean 59% of total tocopherol is γ tocopherol (Kamal-Eldin and Andersson 1997). The function of tocopherols in animal systems is generally related to the level of α tocopherol activity. Tocopherols have the ability to quench free radicals in cell membranes, protecting polyunsaturated fatty acids from damage. An imbalance in the production of free radicals and the natural protective system of antioxidants may lead to oxidized products, capable of harming tissues (Food and Nutrition Board and Institute of Medicine, 2000). Tissue damage from free radicals is considered to be related to chronic diseases such as cardiovascular disease, neurological disorders, cancer, cataracts, in flammatory diseases, and age-related macular degeneration (Bramley et al., 2000). In plants, it is suggested that the protection of photosynthetic apparatus and polyunsaturated fatty acids from oxidative damage caused by reactive oxygen species (ROS) are the main photosynthetic and non photosynthetic function of tocopherol, respectively (Trebst et al. 2002; Velasco et al. 2004; Cela et al. 2009; Semchuk et al. 2009).
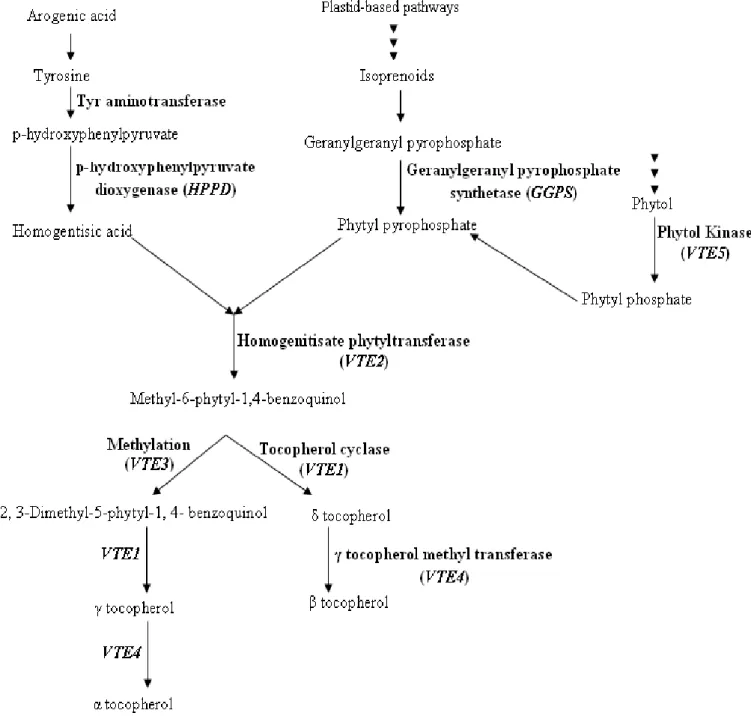
1.3.3.1 Tocopherol pathway
Tocopherol biosynthetic pathway can be divided in to four following steps: Fig. 1.2 Forms of tocopherol determined by the number of methyl groups on the chromanol ring
1.3.3.1.1 Synthesis of homogentisic acid (HGA)
Homogentisic acid (HGA) contributes to the chromanol head of tocopherol. HGA is the common precursor to tocopherols, can originate either via the conversion of chorismate to prephenate and then to p-hydroxyphenylpyruvate (HPP) via a bifunctional prephenate dehydrogenase in bacteria (Fig 1.3) or via the synthesis and conversion of the intermediates arogenate, tyrosine, by the shikimate pathway, and HPP in plants. HPP is then converted to HGA by p-hydroxyphenylpyruvate dioxygenase (HPPD) (Fig 1.3) (Norris et al 1998; Valentin et al. 2006).
1.3.3.1.2 Synthesis of phytylpyrophosphate (PDP)
Tocopherols are a member of the class of compounds referred to as the isoprenoids. Other isoprenoids include carotenoids, gibberellins, terpenes, chlorophyll and abscisic acid. A central intermediate in the production of isoprenoids is isopentenyl diphosphate (IPP). 2 pathways, Cytoplasmic and plastid-based pathways (Fig. 1.4) to generate IPP have been reported. Phytyl pyrophosphate (PDP) is an intermediate in the side chain of tocopherol. In
18
plastid-based pathway or MEP pathway (Fig. 1.4); 4-phosphocytidyl-2C-methyl-D-erythritol is converted into 4-diphosphocytidyl-2C-methyl-D-erythritol-2 phosphate by the action of the translation product of chB. 4-diphosphocytidyl-2C-methyl-D-erythritol-2 phosphate is converted into 2-C-methyl-D-erythritol, 2, 4-cyclophosphate by the translation product of
ygbB. The latter compound is converted by the translation product of gcpE into
(E)-1-(4-hydroxy-3-methylbut-2-enyl) diphosphate. Subsequently, the translation product of LytB, in turn catalyzes the conversion of (E)-1-(4-hydroxy-3-methylbut-2-enyl) diphosphate to isopentenyl diphosphate. Geranylgeranyl diphosphate (GGDP) is synthdized from isopentenyl diphosphate by geranylgeranyl diphosphate synthase1. PDP can be generated either from GGDP directly by geranylgeranyl diphosphate reductase (GGDR) or phytol and ATP by a phytol kinase (VTE5) present in chloroplast stroma (Fig. 1.5) (Valentin et al. 2006).
Cytoplasmic-based pathway
Isopentenyl diphosphate (C5H12O7P2)
1.3.3.1.3 Joining of HGA and PDP
2-Methyl-6-phytyl-1,4-benzoquinol (MPBQ) is formed after the condensation of HGA and PDP by homogenitisate phytyltransferase (VTE2). MPBQ can be either cyclized by tocopherol cyclase (VTE1) to form δ tocopherol or methylated by VTE3 to form 2, 3-Dimethyl-5-phytyl-1, 4- benzoquinol (DMPBQ) (Fig. 1.6) (Porfirova et al. 2002; Shintani et
geranylgeranyl diphosphate synthase1
Geranylgeranyl diphosphate(GGDP) (C20H36O7P2)
Isopentenyl diphosphate (IPP)
geranylgeranyl diphosphate reductase (GGDR)
Phytylpyrophosphate (PDP) (C20H42O7P2)
20
al. 2002; Collakova and DellaPenna 2003; Semchuk et al. 2009). DMPBQ can be cyclized by VTE1 to form γ tocopherol (Sattler et al. 2003).
1.3.3.1.4 Methylation of an aromatic ring
α-tocopherol can be generated by methylation of γ-tocopherol via γ-tocopherol methyl-transferase (VTE4) (D'Harlingue and Camara 1985). β-tocopherol is formed from δ-tocopherol by methylation of the 5 position by VTE4 (Fig. 1.6). Also β-δ-tocopherol can be directly converted to α-tocopherol by tMT2 via the methylation of the 3 position (Norris et al. 2004).
1.4 Molecular map of sunflower
Sunflower, as one of the most important dicot crops, has been studied for construction of
molecular genetic map. The first map of sunflower was reported by Gentzbittel et al. (1995) and Berry et al. (1995), using RFLPs markers. Gentzbittel et al. (1999) presented an updated version of the above-mentioned map, using more RFLPs markers. Two other maps were also published, using RFLPs (Jan et al. 1998) and RFLPs and AFLPs (Gedil et al. 2001). Molecular genetic-linkage map based on 459 SSRs, has been constructed by Tang et al. (2002), which is the first reference map of sunflower based on single- or low-copy public SSR markers. Genetic map of our department (Poormohammad Kiani et al. 2007) contains 304 AFLP and 191 SSR markers with the total length of 1824.6 cM and a mean density of one locus every 3.68 cM.
1.5 Objectives
The objectives of this research are:
- To map some important tocopherol and phytosterol pathway-related genes, enzymatic antioxidant-related genes, drought-responsive family genes and Arabidopsis Sec14 homologue genes,
- To identify chromosomal regions associated with quantitative variation of tocopherol, phytosterol, protein, oil and fatty acid compositions under several environments and conditions and to validate the extent to which these candidate genes affect quantitative phenotypic variability for the studied traits in sunflower grains.
- to map QTLs for leaf-related traits such as dried leaf number (DLN), leaf number (LN), leaf area at flowering (LAF) and leaf area duration (LAD), yield-related traits such as head diameter (HD), head weight (HW), 1000 grain weight (TGW), grain yield per plant (GYP), biomass (BIO) and other traits such as days from sowing to flowering (DSF) and plant
22
height (PH) in recombinant inbred lines by using saturated SSR and AFLP linkage map of our department (Poormohammad Kiani et al. 2007a), in the field with well-, partial-irrigated and late-sowing conditions
- To assess the genetic variability and to identify AFLP markers and polymorphic candidate genes associated with seed-quality traits under well-irrigated and water-stressed conditions in gamma-induced mutants of sunflower.
Chapter 2
24
2.1 Plant materials
2.1.1 Population of recombinant inbred lines (RILs)
The recombinant inbred lines (RILs) used in this research have been developed through single seed descent from F2 plants, derived from a cross between PAC2 and RHA266 (Flores Berrios et al. 2000). Both parental lines are sunflower public inbred lines. RHA266 has been obtained from a cross between wild H. annuus and Peredovik by USDA and PAC2 is an INRA-France inbred line from a cross between H. petiolaris and ‘HA61’ (Gentzbittel et al. 1995).
2.1.2 Population of mutants (M8)
The sunflower restorer inbred line ‘AS613’ has been produced in our laboratory from a cross between two genotypes (‘ENSAT-125’ and ‘ENSAT-704’) through a single-seed descent (SSD) programme (Sarrafi et al. 2000). The seeds of ‘AS613’ were exposed to gamma rays at the Atomic Energy Center (Cadarache, France) with a dose of 75 Grays. Mutants population have been developed through modified SSD method (Sarrafi et al. 2000). Regarding to morpho-physiological studies, among a population of about 2000 gamma-induced mutants of sunflower, 23 M8 mutants were selected for quantitative analysis.
2.2 Experimental conditions
2.2.1 Experimental conditions for RILs
Three independent experiments were undertaken at Teheran University campus of Karaj.
Experimental design was a randomized complete block with three replications. Seeds of 89 RILs and their two parents were sown in the field under well-, partial-irrigated and late-sowing conditions. Each genotype per replication consisted of one row, 4m long, 50cm between rows and 25cm between plants in rows. The distance between the replications of well-irrigated and partial-irrigated treatments was 7m. The so-called ‘well-irrigated’ condition plots were irrigated once every week, whereas for the second condition
(partial-irrigated), irrigation was controlled and adjusted by the observation of wilting threshold of the leaves. Partial water deficit was started 45 day after sowing at the near flower bud formation stage and continued up to maturity. The sowing dates were: normal sowing on May and late sowing on July.
2.2.2 Experimental conditions for mutants
Two independent experiments were undertaken in randomized complete block design with three replications. Seeds of mutants and original line (AS613) were sown in the field under well-irrigated and water-stressed conditions. Each genotype per replication consisted of one row, 4m long, 50 cm between rows and 25 cm between plants in rows. The distance between replications of well-irrigated and water-stressed treatments was 7m. The so-called ‘well-irrigated’ condition plots were irrigated once every week, whereas for the second condition (water-stressed), water deficit was started 45 days after sowing at the stage near flower bud formation and continued up to maturity.
2.3 Trait measurements
2.3.1 Morpho-physiological traits (Fig. 2.2)
DSF (days from sowing to flowering) and PH (plant height) were measured for RILs and their parental lines at the plot scale (on the line, when 50% of the plants were at the flowering stage). Leaf-related traits such as LN (leaf number), DLN (dried leaf number), were recorded at anthesis, and leaf length (L) and width (W) of all green leaves were measured at flowering stage, and total leaf area at flowering (LAF) was calculated with the formula: LAF= 0.7L×W (Alza and Fernandez-Martinez 1997). Green leaf area of the plants was determined weekly from flowering to harvest in order to evaluate green leaf area with respect to time. An integral of weekly leaf area was considered as being an estimate of leaf area duration (LAD, m2 days). At harvest, yield components such as HD (head diameter), HW (head weight), HGW (100 grain weight), GYP (grain yield per plant) and BIO (biomass) were measured. HN (head number) was also measured when 50% of the plants were at the anthesis. Three plants per genotype per condition per replication were randomly chosen for evaluation of the mentioned traits.
26
2.3.2 Seed-quality traits (Fig. 2.2)
Percentage of seed protein (PSP), percentage of seed oil (PSO), palmitic acid content (PAC), stearic acid content (SAC), oleic acid content (OAC), linoleic acid content (LAC), total tocopherol content (TTC) and total phytosterol content (TPC) were measured by the FOSS NIRSystems 6500. Forty grams of sunflower seeds per genotype per condition per replication were ground in a Knifetec 1095 Sample Mill (1975, FOSS, Tecato, Hoganas, Sweden) three times for 10 s each. A FOSS NIRSystems 6500 spectrophotometer (Foss Analytical, Denmark) was used to collect spectra from the ground sunflower seeds using a small round cup with a quartz window. The reflectance (R) of each sample was measured as log of 1/R from 400 to 2500 nm at 2 nm intervals. Eight hundred sixty and 660 spectra database were used for tocopherol and phytosterol prediction, respectively. The absorption maximum around 1700-1800 and 2300-2400 nm were due to oil and fatty acid content. The area near to 2180 nm was related to protein content.
1-Forty grams of sunflower seeds were ground in a Knifetec 1095
Sample Mill (1975, FOSS,
Tecato, Hoganas, Sweden) three times for 10s each.
2-Transferred to small round cup with a quartz window
3- A FOSS NIRSystems 6500 spectrophotometer (Foss Analytical, Denmark) was used to collect spectra from the ground sunflower seeds using a small round cup with a quartz window.
Fig. 2.1 Near-infrared spectrum of sunflower ground seed from 400 to 2500 nm expressed as log (1/Reflectance)
2.3.2 .1 Solvent extraction of lipids
The extraction of the total oil content was performed by hexane (n-hexane, Prolabo/Subra, Toulouse, France) extraction using an accelerated solvent extractor apparatus (ASE 200, Dionex, France) with an isopropanol/hexane mixture (5:95 v/v) during 20 min. Then, the solvent was removed from the extracts under low pressure evaporation (Rotavapor, Bioblock Scientific HS 40 HUBER, Heildorph, Germany). Lipid extracts were weighed and tocopherol content was analyzed.
2.3.2.2 Tocopherol determination
Total tocopherol for some samples was achieved using a high-performance liquid chromatography (HPLC) (SpectraPhysics, Thermo Separation Products, USA) with a normal-phase LiChrosorb Si60 column, 250cm x 4mm x 5µm (CIL, Cluzeau, France) (ISO 9936, 1997). The mobile phase was a mixture of hexane/isopropanol (99.7:0.3 v/v) at 1mL/min flow rate. One gram of oil sample was diluted in 25 mL of hexane and 20µl was injected into the HPLC. Detection was performed with fluorescence detector (excitation wavelength = 298 nm and emission wavelength=344nm: Waters 2475 multi λ). Total tocopherol content was calculated as the sum of α, β, γ, and δ-tocopherol contents and expressed in mg kg-1 oil.
2.3.2.3 NIRS calibration
Prediction equations were calculated with a modified partial least-squares regression (MPLS) model after 4 outlier elimination passes (WINISI 1.02 - Infrasoft International LLC). With the MPLS regression method, factors are extracted in decreasing order of reliance measured by covariance with the response variable. To prevent overfitting in calibration, the number of factors is optimized by cross-validation in calibration set. Previous mathematical treatment was applied on each spectrum: a standard normal variate and detrend (SNV/detrend) scatter correction, a first-derivative transformation, and a smoothing on four data points. The equation with the highest coefficient of determination (R²) and the lowest standard error (SE) of the calibration was used to predict the tocopherol and the phytosterol values of the validation set.
The performance of this NIRS model, for the estimation of tocopherols and phytosterols, was determined by the following parameters: the standard error of calibration (SEC), the coefficient of determination in calibration (RSQ), the standard error of cross-validation (SECV), the coefficient of determination of cross-validation (1–VR) and the standard error
28
of prediction (SEP). Near infrared reflectance (NIR) spectroscopy, has been successfully used as an alternative technique to classical methods in due to determine multiple parameters such as proteins, oil content, fatty acid compositions (Pérez-Vich et al., 1998; Velasco & Becker, 1998; Biskupek-Korell & Moschner, 2007; Ebrahimi et al., 2008; Ebrahimi et al., 2009). In previous study in our laboratory,a relatively good correlation between NIRS results and HPLC and GC method for total tocopherol (R2 = 0.64) (Ayerdi Gotor et al., 2007) and total phytosterol content (R2 = 0.61) (Ayerdi Gotor et al., 2008; Calmon et al. 2009) were observed. We have obtained a very good correlation between the HPLC analysis and the NIRS predictions (R² = 0.76).
2.4 Molecular analysis
2.4.1 DNA Extraction and PCR program
The genomic DNA of PAC2, RHA266, RILs, original and mutant lines were isolated and DNA quantification was performed by picogreen (protocole is included in appendix). The PCR program was: 4 min at 94 °C followed by 35 cycles; 30 s at 94 °C, 30 s at (55 °C or 58 °C), 1 min at 72 °C and at last, 5 min at 72 °C.
2.4.2 AFLP genotyping
Different MseI/EcoRI primer combinations were used for AFLP genotyping. The AFLP procedure was conducted as described by Rachid Al-Chaarani et al. (2004).
2.4.3 Candidate Genes (CGs)
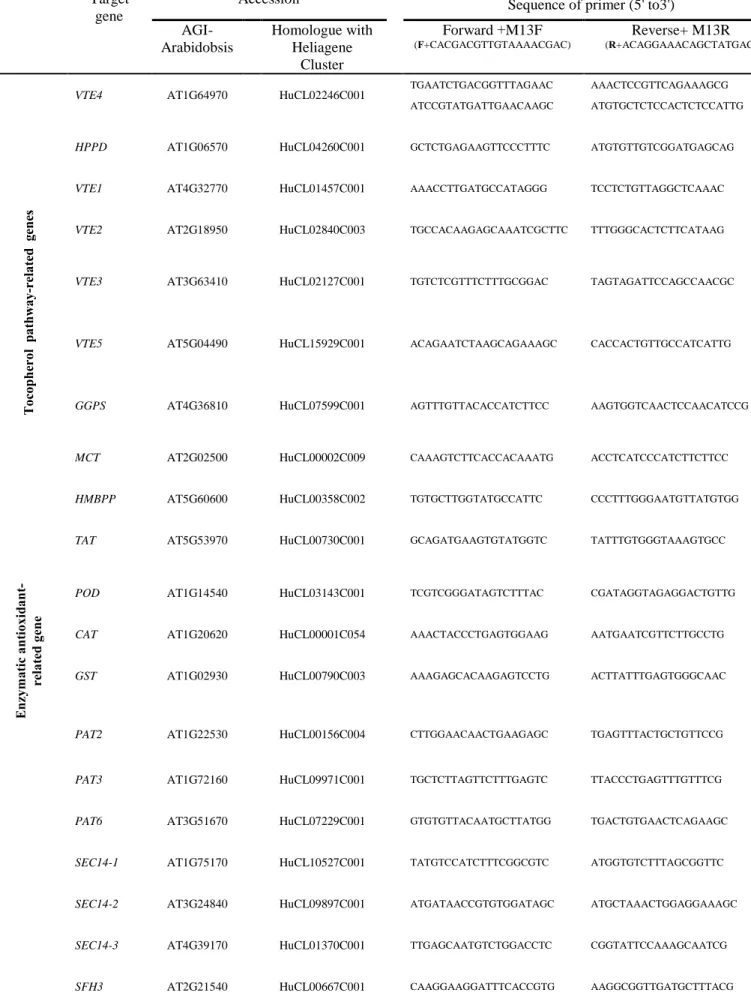
Some important tocopherol pathway-related genes, phosphoglyceride transfer-related genes, enzymatic antioxidant-related genes, drought-responsive genes and fatty acid biosynthesis-related genes were studied. Respective sequencedata for candidate genes coding for these proteins were obtained from The Arabidopsis Information Resource (www.arabidopsis.org). In order to seek the helianthus homolog sequences to the Arabidopsis genes, we used the Compositae EST assembly clusters, available at the Helianthus-devoted bioinformatics portal Heliagene (www.heliagene.org). The Helianthus EST clusters presenting the reciprocal blast with the highest score and lowest E value with regarding to the original Arabidopsis genes were chosen for our studies. All primers were designed by MATLAB. Between 2 to 4 various primer combinations per each candidate gene were tested on agarose gel. After sequencing; SNP-PHAGE, through the website at http://www.heliagene.org/, was applied for analyzing sequence traces from both parents to identify SNPs. Genotyping was done by SNP-based CAPS marker and high resolution melting (HRM) as well as directly on agarose gel.
2.4.4 High-Resolution Melting(HRM)
HRM was performed in capillaries of a Light Cycler® 480 Real-Time (Roche Applied Science) with the cycling program consisting of 5 min of initial denaturation at 95 °C and 60 cycles of 15 s at 95 °C, 15 s at 58 °C and 20 s at 72 °C. Melting curves were generated by ramping from 70 to 95 °C at 0.02 °C/s. The gene scanning module in the LightCycler® 480
30
software was used to normalize raw melting curve data by setting pre-melt and post-melt signals of all RILs and parental lines to uniform values and then to modify the normalized curves across a temperature axis as well as to plot the melting curve differences between them.
2.4.5 Cleaved Amplified Polymorphic Sequence (CAPS) marker
SNPs between PAC2 and RHA266 for sterol C-methyltransferase (SMT2), delta24-sterol reductase (DWF1) and patellin2 (PAT2), Arabidopsis Sec14 homologue gene, were identified through multiple sequence alignments using SNP-PHAGE. Then they were converted to CAPS marker to allow genotyping of RILs via www.biophp.org/minitools/restriction_digest/demo.php and http://helix.wustl.edu/dcaps/dcaps.html (alll sequences are included in appendix). The following protocol was used for DNA digestion: sterile and deionized water 6.8µl, RE 10X buffer 1 µl, PCR-product 2 µl and restriction endonuclease (10 u/µl) 0.2 µl. Incubation at 37 °C for 2 hours was performed (Promega-usage information). All samples were incubated at 65 °C for 10 min to deactivate restriction enzyme.
2.5 Statistical analysis
2.5.1 Statistical analysis for RILs
Data were analyzed using SAS PROC GLM (SAS Institute Inc. 1996) and SPSS. Statistical analysis was carried out in order to determine the main effect of RILs for the studied traits. The mean of RILs and that of their parents were compared for both traits. Genetic gain (GGB) when the best RIL is compared with the best parent and genetic gain (GG10%) when the mean of the top 10% selected RILs is compared with the mean of the parents, were determined for the studied traits. Additive and environmental variances as well as narrow-sense heritability were calculated according to Kearsey and Pooni (1996), using least-square estimates of genetic parameters.
2.5.2 Statistical analysis for mutants
The data were analyzed using SPSS. Correlations among traits in each of condition were determined. The association between AFLP markers and candidate genes with the quantitative traits was estimated through stepwise multiple regression analysis, where each quantitative trait was considered as an dependent variable while AFLP markers and candidate genes were treated as an independent variable. To select independent variables for the regression
equation, F-values with 0.045 and 0.099 probability were used to enter and remove, respectively.
2.6 QTL and map construction
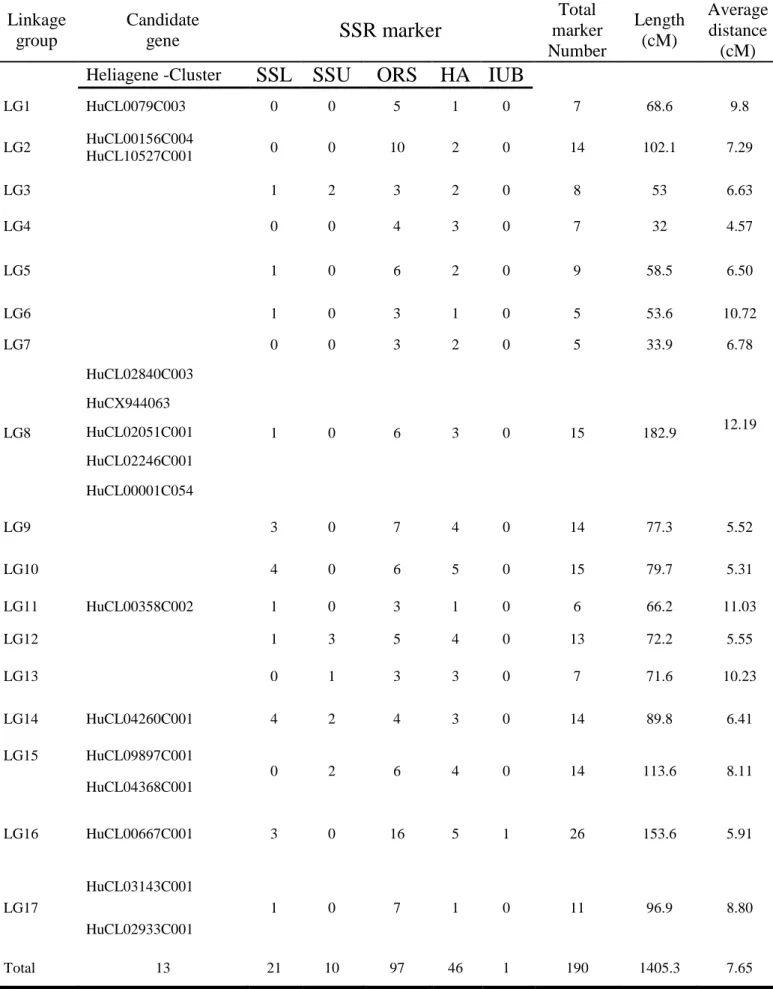
Some of the studied candidate genes were introduced in our map (Poormohammad Kiani et al. 2007) based on SSR markers using CarthaGene 0.999 (Schiex and Gaspin 1997). Chi-square-tests were performed for segregation distortion of each locus. Loci were assembled into groups using likelihood odds (LOD) ratios, with a LOD threshold of 4.0 and a maximum recombination frequency threshold of 0.35. Multiple locus order estimates were performed for each linkage group. The likelihoods of different locus orders were compared and the locus-order estimate with the highest likelihood was selected for each linkage group. The Kosambi mapping function was used to calculate map distances (cM) from recombination frequencies. Mapchart 2.1 was used for graphical presentation of linkage groups and map position of the studied candidate genes. The chromosomal locations of QTLs for the studied traits were resolved by composite interval mapping (CIM), using Win QTL Cartographer, version 2.5 (Wang et al. 2005) with the mean values of three replications for each RIL in each condition. The genome was scanned at 2-cM intervals; with a window size of 15 cM. Up to 15 background markers were used as cofactors in the CIM analysis with the programme module Srmapqtl (model 6). Additive effects of the detected QTLs were estimated with the Zmapqtl program. The percentage of phenotypic variance (R2) explained by each QTL was estimated by Win QTL Cartographer.
32
Chapter 3
Genetic dissection of tocopherol and phytosterol in
recombinant inbred lines of sunflower through QTL
analysis and the candidate gene approach
SubmittedAbstract
Sunflower contains tocopherol, non-enzymatic antioxidant known as lipid-soluble vitamin E, and phytosterol with interesting properties, which can result in decreased risk for chronic diseases in human and with several beneficial effects in plants. The genetic control of tocopherol and phytosterol content in a population of recombinant inbred lines (RILs) of sunflower under several environments and conditions is studied through quantitative trait loci analysis (QTL) using genetic-linkage map based on SSR markers and introducing some important tocopherol and phytosterol pathway-related genes, enzymatic antioxidant-related genes, drought-responsive family genes and Arabidopsis Sec14 homologue genes. Three important candidate genes (HPPD, VTE2 and VTE4), which encode enzymes involved in tocopherol biosynthesis, are mapped to linkage group 8(LG8) and LG14. One of the most important candidate genes coding for sterol methyltransferase II (SMT2) enzyme is anchored to LG17 by CAPS marker. Four SNPs are identified for PAT2, Arabidopsis Sec14 homologue gene, between two parents. PAT2 is assigned to LG2 by CAPS marker. Squalene epoxidase (SQE1) is also assigned to LG15 by InDel marker. Through other candidate genes, POD, CAT and GST encoding enzymatic antioxidants are assigned to LG17, LG8 and LG1, respectively. One to 6 QTLs are identified, depending on the trait and environments. The major QTL for total phytosterol content on linkage group 8 accounted for 55.1% of the phenotypic variation, which is overlapped with the QTL of total tocopherol content. GST,
POD, SMT2 and SEC14-2 genes showed co-localization with QTL for phytosterol content.
Two candidate genes, HPPD and SFH3, exhibited co-localization with QTL for tocopherol content (7.TTC.14, 6.TTC.14, 7.TTC.16, 5.TTC.16). The candidate genes associated with tocopherol and phytosterol, especially HPPD and SMT2, could be precisely used for alternation of the tocopherol and phytosterol content of sunflower seeds by development of functional markers.
Key words: Tocopherol, Phytosterol, QTL, candidate gene, Sunflower
Abbreviation: RIL, recombinant inbred line; SSR, simple sequence repeats; CG, candidate gene; SNP, single-nucleotide polymorphism; CAPS, cleaved amplified polymorphic sequence; InDel, insertion/deletion; HRM, high-resolution melting; NIRS, near-infrared reflectance spectrometry; HPLC, high-performance liquid chromatography; TTC, total tocopherol content; TPC, total phytosterol content; CIM, composite interval mapping; QTL, quantitative trait locus.
34
3.1. Introduction
Sunflower contains minor components such as tocopherol and phytosterol with interesting properties for human health. Phytosterols are products of the isoprenoid biosynthetic pathway naturally present in plants and occurring exclusively in the cytoplasm. Phytosterols are present in different plant parts and mostly in seeds. Their level depends on species and sunflower seeds contain a quite high concentration (Mouloungui et al., 2006). The role of phytosterols in plant growth and developmental processes like cell division, polarity and morphogenesis (Lindsey et al. 2003; Schaller 2004), embryogenesis (Clouse, 2000), membrane fluidity and permeability (Schaller 2003), as anti-inflammatory (Bouic, 2001) and as anti-oxidation activities (Van Rensburget et al., 2000) has been also well known. In sunflower seed oil, total phytostertol content represents the sum of campesterol, stigmasterol, β-sitosterol, campesterol, ∆5-avenasterol, stigmasterol and ∆7-avenasterol (Ayerdi Gotor et al. 2007). Tocopherol (α, β, γ, and δ-tocopherol) belongs to the Vitamin E class of lipid soluble antioxidants that are essential for human nutrition. The function of tocopherol in human and animal systems is generally related to the level of α-tocopherol activity. Alpha-α-tocopherol has a maximum vitamin E activity (Kamal-Eldin and Appelqvist 1996). Oilseed crops reveal large variation in the levels of the different tocopherols and total tocopherol content (Marwede et al. 2005). Among oil seed crops sunflower grains mainly contain α tocopherol, which accounts for more than 95% of the total tocopherols, whereas in soybean 59% of total tocopherol is γ tocopherol (Kamal-Eldin and Andersson 1997). In plants, it is suggested that the protection of photosynthetic apparatus and polyunsaturated fatty acids from oxidative damage caused by reactive oxygen species (ROS) are the main photosynthetic and non photosynthetic function of tocopherol, respectively (Trebst et al. 2002; Velasco et al. 2004; Cela et al. 2009; Semchuk et al. 2009). Epidemiological evidence indicates that tocopherol and phytosterol supplementation can result in decreased risk for chronic diseases such as cardiovascular disease, cancer, neurological disorders, cataracts, and age-related macular degeneration (Bramley et al. 2000) and reduction of cholesterol levels in blood (Ostlund 2002). The amount of α tocopherol in sunflower seed can be controlled by 3 loci; Tph1 (m), Tph2 (g) and d (Demurin 1993; Hass et al. 2006; Tang et al. 2006). The epistasy between Tph1 and d loci are reported by Tang et al. (2006) .The level of β tocopherol is increased by d locus in mutant inbred lines (m m). The level of γ tocopherol is increased by g locus in mutant inbred lines (g g) as a result of knockout of γ tocopherol methyl transferase (Hass et al. 2006). The
d locus is mapped to linkage group 4 and the Tph2 locus is placed in linkage group 8
between ORS312 and ORS599 makers (Hass et al. 2006). The co-segregation of Tph1 with SSR markers ORS1093, ORS222 and ORS598 is observed (Vera-Ruiz et al. 2006) .
2-methyl-6-phytyl-1,4-benzoquinone/2-methyl-6-solanyl-1,4-benzoquinone
methyltransferase (MPBQ/ MSBQ-MT) paralogs from sunflower (MT1 and MT2) are isolated and sequenced (Tang et al. 2006). InDel markers are developed for MT1 and MT2 and the MT1 Locus is assigned to linkage group 1 (Tang et al. 2002; Tang et al. 2003). Sunflower has been considered for construction of molecular map. The first map of sunflower was reported by Gentzbittel et al. (1995) and Berry et al. (1995), using RFLPs markers. Gentzbittel et al. (1999) presented an updated version of the above-mentioned map, using more RFLPs markers. Two other maps were also published, using RFLPs (Jan et al. 1998) and RFLPs and AFLPs (Gedil et al. 2001). Genetic-linkage map based on 459 SSR, has been also constructed (Tang et al. 2002), which is the first reference map of sunflower based on single- or low-copy public SSR markers. Genetic map of our department (Poormohammad Kiani et al. 2007) contains 304 AFLP and 191 SSR markers with the total length of 1824.6 cM and a mean density of one locus every 3.7 cM. Identification of chromosomal regions with effects on tocopherol and phytosterol would increase our understanding of the genetic control of these traits. As far as we know QTLs controlling total tocopherol content in sunflower have not been reported in the literature. One QTL for total sterols was identified on linkage group one that explained 14.3 % of the total variability (Alignan et al. 2008). QTLs associated with tocopherol in maize and winter oilseed rape are detected (Wong et al. 2003; Marwede et al. 2005). One to five QTLs are identified for α, γ and total tocopherol content and α/β tocopherol ratio in winter oilseed rape (Marwede et al. 2005). Thirty-one QTLs associated with tocopherol content and its compositions were identified by composite interval mapping (CIM) in RILs of maize (Chander et al. 2008). These QTLs are mapped on sixteen linkage groups except linkage group4. Eight QTLs were identified for total tocopherol. On LG5, the QTL of total tocopherol was linked to HPPD gene and explained 7.13% of phenotypic variance (Chander et al. 2008). Three QTLs controlling total phytosterol content are identified on LG8, 13, 18 in a population consisted of 148 DH lines of rapeseed and explained 60% of phenotypic variance (Amar et al. 2008). The objectives of this research are to map some important tocopherol and phytosterol pathway-related genes, enzymatic antioxidant-related genes, drought-responsive family genes and Arabidopsis Sec14 homologue genes, to identify chromosomal regions associated with quantitative variation of tocopherol and phytosterol content under several environments
36
and conditions and to validate the extent to which these candidate genes affect quantitative phenotypic variability for tocopherol or phytosterol content in sunflower grains.
3.2. Materials and methods
3. 2.1 Plant materials and experimental conditions
The recombinant inbred lines (RILs) used in this research have been developed through single seed descent from F2 plants, derived from a cross between PAC2 and RHA266 (Flores Berrios et al. 2000). Both parental lines are sunflower public inbred lines. RHA266 has been obtained from a cross between wild H. annuus and Peredovik by USDA and PAC2 is an INRA-France inbred line from a cross between H. petiolaris and ‘HA61’ (Gentzbittel et al. 1995).
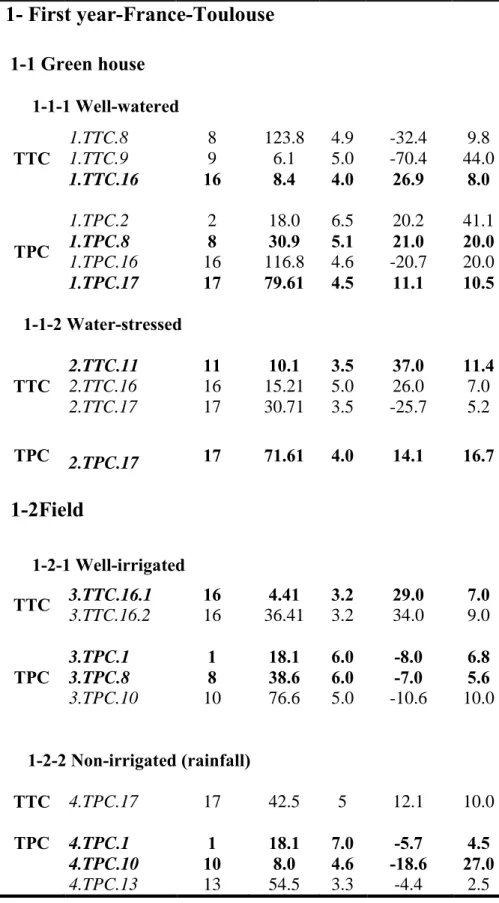
3.2.1.1 First year - France-Toulouse
3.2.1.1a Greenhouse experiment- Seventy-two RILs and their parents (PAC2 and RHA266) were grown in a greenhouse in plastic pots containing a mixture of 40% soil, 40% compost, and 20% sand. Temperature was controlled at 25/18 ± 2°C (day/night), relative humidity was 65/85 ± 5%, and light was provided to obtain a 16h light period. The experiment consisted of a split-plot design with three blocks and one plant per genotype per water treatment per block. The main plot was water treatment (well-watered and water-stressed) and subplot was genotype (RILs and their parents). The RILs and their parents were randomized within each treatment–block combination. To simulate water-deficit conditions similar to the field, a progressive water stress was imposed at the stage near flower bud formation (R1; Schneiter and Miller 1981) by progressively decreasing the irrigation to 30% of field capacity during 12 days. Water-stressed plants were then irrigated at 30% of field capacity until harvest. Well-watered plants received sufficient water to maintain soil water content close to field capacity. Both well-watered and water-stressed plants were weighed to maintain the desired soil water content. Midday leaf water potential of the youngest fully expanded leaf was about –1.8 MPa in water-stressed plants, corresponding to a severe water stress (Maury et al. 1996). According to Tezara et al. (2002), field water capacity of about 60% is considered as mild stress and 33% is considered as severe stress in sunflower.
3.2.1.1b Field experiment- Ninety-nine RILs and their parents (PAC2 and RHA266) were grown in the field under both well-irrigated and non-irrigated (rainfall) treatments. In each water treatment, 3 replications were designed and each replication consisted of 2 rows, each 4.6 m long, with 50 cm between rows and 25 cm between plants in a row. Thirty-two plants were obtained per plot. Plants in the well- irrigated treatment were watered two times, at two critical stages: before flowering and during grain filling (determined according to the sunflower irrigation programme in the Toulouse region, France). Plants in the water-stress (rainfall) treatment were not irrigated at all. Four plants per genotype per water treatment per replication were randomly chosen for our studies.
3.2.1.2 Second year- Iran-Karaj
Three independent experiments were undertaken at Teheran University campus of Karaj. Experimental design was a randomized complete block with three replications. Seeds of 89 RILs and their two parents (PAC2 and RHA266) were sown in the field under well-, partial-irrigated and late-sowing conditions. Each genotype per replication consisted of one row, 4m long, 50cm between rows and 25cm between plants in rows. The distance between the replications of well-irrigated and partial-irrigated treatments was 7m. The so-called ‘well-irrigated’ condition plots were irrigated once every week, whereas for the second condition (partial-irrigated), plots were irrigated once every two weeks. Partial water deficit was started 45 day after sowing at the near flower bud formation stage and continued up to maturity. The sowing dates were: normal sowing on May and late sowing on July.
3.2.2 Trait measurements
3. 2.2.1 Tocopherol measurement
Pre-measurements for total tocopherol content (TTC) were carried out by both FOSS NIRSystems 6500 and reference method (HPLC, ISO 9936, 1997) for core collection. Forty grams of sunflower seeds were ground in a Knifetec 1095 Sample Mill (1975, Foss Tecator, Höganäs, Sweden) three times for 10 s each. A FOSS NIR Systems 6500 spectrophotometer (Foss Analytical, Denmark) was used to collect spectra from the ground sunflower seeds using a small round cup with a quartz window. The reflectance (R) of each sample was measured as log of 1/R from 400 to 2500 nm at 2nm intervals. Total oil content was extracted and TTC was thus determined using the following protocol:
38
Solvent extraction of lipids
The extraction of the total oil content was performed by hexane (n-hexane, Prolabo/Subra, Toulouse, France) extraction using an accelerated solvent extractor apparatus (ASE 200, Dionex, France) with an isopropanol/hexane mixture (5:95 v/v) during 20 min. Then, the solvent was removed from the extracts under low-pressure evaporation (Rotavapor, Bioblock Scientific HS 40 HUBER, Heildorph, Germany). Lipid extracts were weighed and tocopherol content was analyzed.
Tocopherol determination
Total tocopherol was achieved using a high-performance liquid chromatography (HPLC) (SpectraPhysics, Thermo Separation Products, USA) with a normal-phase LiChrosorb Si60 column, 250cm x 4mm x 5µm (CIL, Cluzeau, France) (ISO 9936, 1997). The mobile phase was a mixture of hexane/isopropanol (99.7:0.3 v/v) at 1mL/min flow rate. One gram of oil sample was diluted in 25 mL of hexane and 20µl was injected into the HPLC. Detection was performed with fluorescence detector (excitation wavelength = 298 nm and emission wavelength=344nm: Waters 2475 multi λ). Total tocopherol content was calculated as the sum of α, β, γ, and δ-tocopherol contents and expressed in mg kg -1 oil.
3.2.2.2 Phytosterol measurement
Pre-measurements for total phytosterol content (TPC) were also carried out by both FOSS NIRSystems 6500 and reference method (GC) for core collection. Total phytosterol content for core collection was measured by gas chromatography after saponification with KOH 0.5M during 15 min and a purification on an aluminium oxide basic colum. One µl of trimethylsylil (TMS) solutions were injected into fused silica capillary (ZB-5) column (Phenomenex, Paris, France) in a Fisons gas chromatography (GC 8000 series MMFC 800 Multi-function controller, Italy) fitted with a flame ionization detector. Sterols were identified by their retention time relative to betulin (Internal standard –Sigma-France). Total phytosterol was calculated as campesterol, stigmasterol, β-sitosterol, ∆7-campesterol, ∆5-avenasterol, ∆7-stigmasterol and ∆7-avenasterol content and expressed in mg 100 g -1 oil. A modified partial least-squares regression (MPLS) model, after 4 outlier elimination passes (WINISI 1.02 – Infrasoft International LLC) was used. The performance of our NIRS model, for the estimation of tocopherols and phytosterols was determined by the following
parameters: the standard error of calibration (SEC), the coefficient of determination in calibration (RSQ), the standard error of cross-validation (SECV), the coefficient of determination of cross-validation (1–VR) and the standard error of prediction (SEP). We have obtained a high significant correlation between the HPLC analysis and the NIRS predictions for TTC (R² = 0.76) and good relatively correlation between the GC analysis and the NIRS predictions for TPC. In previous studies in our department, a relatively good correlation between NIRS results and GC method for total phytosterol content (R2 = 0.61) (Ayerdi Gotor et al. 2008; Calmon et al. 2009) was also observed. Then, TTC and TPC were measured for all 1827 samples.
3. 2.3 Molecular and statistical analysis
3.2.3.1 DNA Extraction and PCR program
A set of 123 RILs and their parents (PAC2, RHA266) were used for DNA extraction and DNA quantification was performed by picogreen. The PCR program was: 4 min at 94 °C followed by 35 cycles; 30 s at 94 °C, 30 s at (55 °C or 58 °C), 1 min at 72 °C and at last, 5 min at 72 °C.
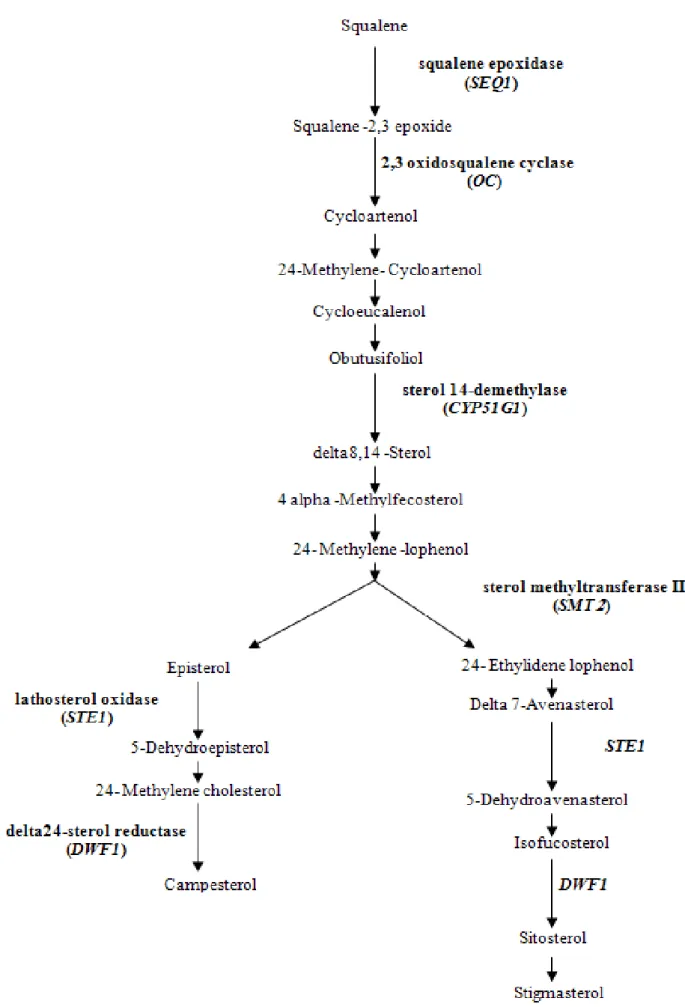
3.2.3.2 Candidate Genes (CGs)
Some important tocopherol and phytosterol pathway-related genes, enzymatic antioxidant-related genes, drought-responsive genes and Arabidopsis Sec14 homologue genes were selected to introduce in our map (Poormohammad Kiani et al. 2007). Reactions catalyzed by proteins of the tocopherol and phytosterol biosynthetic pathway are illustrated in Fig. 3.1 and 3.2, respectively. Respective sequencedata for candidate genes (CGs) coding for these proteins were obtained from The Arabidopsis Information Resource (www.arabidopsis.org). In order to seek the helianthus homolog sequences to the Arabidopsis genes, we used the Compositae EST assembly clusters, available at the Helianthus-devoted bioinformatics portal Heliagene (www.heliagene.org). The Helianthus EST clusters presenting the reciprocal blast with the highest score and lowest E value with regarding to the original
Arabidopsis genes were chosen for our studies. All primers were designed by MATLAB.
Between 2 to 4 various primer combinations per each candidate gene were tested on agarose gel. After sequencing; SNP-PHAGE, through the website at http://www.heliagene.org/, was applied for analyzing sequence traces from both parents to identify SNPs. Genotyping was
40
done by SNP-based CAPS markers, InDel marker and high resolution melting (HRM) as well as directly on agarose gel. Primers used for PCR, HRM, InDel and CAPS makers are summarized in Table 3.1.
3.2.3.3 High-Resolution Melting (HRM)
HRM was performed in capillaries of a Light Cycler® 480 Real-Time (Roche Applied Science) with the cycling program consisting of 5 min of initial denaturation at 95 °C and 60 cycles of 15 s at 95 °C, 15 s at 58 °C and 20 s at 72 °C. Melting curves were generated by ramping from 70 to 95 °C at 0.02 °C/s. The gene scanning module in the LightCycler® 480 software was used to normalize raw melting curve data by setting pre-melt and post-melt signals of all RILs and parental lines to uniform values and then to modify the normalized curves across a temperature axis as well as to plot the melting curve differences between them. All RILs and their parents were clustered into groups, based on their melting curves.
3.2.3.4 Cleaved Amplified Polymorphic Sequence (CAPS) marker
SNPs between PAC2 and RHA266 for sterol methyltransferase II (SMT2), delta24-sterol reductase (DWF1) and patellin2 (PAT2), Arabidopsis Sec14 homologue gene, were identified through multiple sequence alignments using SNP-PHAGE. Then they were converted to CAPS marker to allow genotyping of RILs via
www.biophp.org/minitools/restriction_digest/demo.php and http://helix.wustl.edu/dcaps/dcaps.html.
The following protocol was used for DNA digestion: sterile and deionized water 6.8µl, RE 10X buffer 1 µl, PCR-product 2 µl and restriction endonuclease (10 u/µl) 0.2 µl. Incubation at 37 °C for 2 hours was performed (Promega-usage information). All samples were incubated at 65 °C for 10 min to deactivate restriction enzyme.
3.2.4 Statistical analysis and map construction
Data were analyzed using SAS PROC GLM (SAS Institute Inc. 1996) and SPSS. Statistical analysis was carried out in order to determine the main effect of RILs for the studied traits. The mean of RILs and that of their parents were compared for both traits. Genetic gain (GGB) when the best RIL is compared with the best parent and genetic gain (GG10%) when the mean of the top 10% selected RILs is compared with the mean of the parents, were determined for the studied traits. Some of the studied candidate genes were introduced in our map (Poormohammad Kiani et al. 2007) based on SSR markers using CarthaGene 0.999