Saliency Maps of High Dynamic Range Images
Josselin PetitUniv. Claude Bernard, Lyon (France) and Univ. Paris Est (France)
Roland Br´emond Jean-Philippe Tarel Univ. Paris Est (France)
Abstract
A number of computational models of visual attention have been proposed based on the concept of saliency map, most of them val-idated using oculometric data. They are widely used for Computer Graphics applications with Low Dynamic Range images, mainly for image rendering, in order to avoid spending too much comput-ing time on non salient areas. However, these algorithms were not used so far with High Dynamic Range (HDR) inputs. In this pa-per, we show that in the case of HDR images, the predictions us-ing algorithms based on [Itti and Koch 2000] are less accurate than with 8-bit images. To improve the saliency computation for HDR inputs, we propose a new algorithm derived from [Itti and Koch 2000]. From an eye tracking experiment with a HDR scene, we show that this algorithm leads to good results for the saliency map computation, with a better fit between the saliency map and the oc-ular fixation map than Itti’s algorithm.
1
Previous Work
The concept of visual saliency was introduced in the image com-munity by the influential paper of Itti, Koch & Niebur in 1998. The purpose of these algorithms is to compute, from an image, a Saliency Map, which models the image-driven part of visual atten-tion (gaze orientaatten-tion), for observers looking at the image. Current research in visual saliency focus on three main compo-nents: bottom-up selection from salient features, top-down biases linked to factors like current task, and competition among the fea-tures for the limited resources and selection of behaviourally rele-vant stimuli. In case of bottom-up selection, [Itti and Koch 2000] provides an efficient computational model of the bottom-up visual saliency. The algorithm extracts three early visual features from an image (intensities, opponent colours and orientations), at several spatial scales. Then, the saliency map is build using center-surround differences and normalization steps from each feature.
Alternative algorithms for the bottom-up selection exist but are not tested in this paper, so that our findings are restricted to Itti’s com-putational strategy, which is the most popular in computer science, and led to the more convincing oculometric validations.
2
Saliency Maps of HDR Images
A direct computation of the saliency map with [Itti and Koch 2000] may lead to poor results for HDR images in terms of information: the saliency map on the left on Fig. 1 selects the most salient item, loosing other salient items (Memorial Church from P. Debevec). By looking at each features map, the colour conspicuity map seems to include more information than the two others. In fact, the Colour feature is normalized, at every pixel, with respect to intensity I, whereas the Intensity and Orientation features process differences (between spatial scales). Knowing that biological sensors are sensi-tive to contrasts rather than to absolute differences, we use formulas introducing Contrast-Feature for Intensity and Colours, where c and s are different scales (result on the middle of the Fig. 1.):
I′(c, s) =|I(c) − I(s)|
I(s) (1) O
′(c, s, θ) = O(c, θ)
I(s) (2)
Figure 1: (Left) Itti Saliency map. (Middle) Contrast-Feature Saliency map. (Right) Tone mappedMemorial Church HDR image.
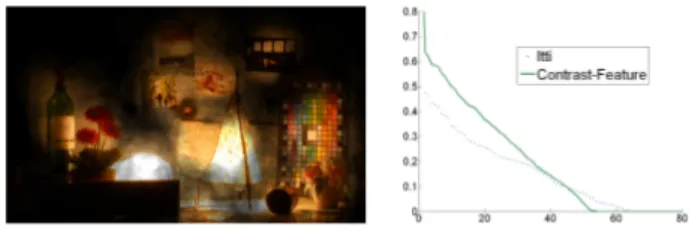
Figure 2: (Left) Fixation map recorded on HDR scene. (Right)
Dice coefficient for the Contrast-Feature and Itti’s Saliency Maps.
3
Validation
In order to test the relevance of a given saliency map computation for HDR images, a ground truth is needed. This was done on a lim-ited scale in a psycho-visual experiment, where 17 observers were asked to look at an HDR physical scene, with an eye-tracker col-lecting oculometric data. The visual task of observers was chosen in order to avoid strong top-down biases. The resulting fixation map is shown on the left of the Fig. 2.
Then, the scene was scanned with a camera with various exposures, in order to build a HDR image. This allowed to compute saliency maps from the HDR image with [Itti and Koch 2000] and with the Contrast-Feature algorithm. Thus, the fixation map could be com-pared to predictions from these saliency maps.
4
Results
The two Saliency Maps were compared using the Dice coefficient (Fig. 2, right). For each threshold probability value, the higher the Dice coefficient is, the more similar are the Saliency Maps. The Contrast-Feature algorithm was rated best compared to [Itti and Koch 2000]. We also checked that it gives better results than 6 tone mapping operators from the literature, followed by [Itti and Koch 2000]. However, the Dice values of the curves remain quite low, whatever the method. This is partly due to the fact that visual attention is not only driven by the bottom-up visual saliency.
References
ITTI, L.,ANDKOCH, C. 2000. A saliency-based search mecha-nism for overt and covert shifts of visual attention. Vision