Science Arts & Métiers (SAM)
is an open access repository that collects the work of Arts et Métiers Institute of
Technology researchers and makes it freely available over the web where possible.
This is an author-deposited version published in: https://sam.ensam.eu Handle ID: .http://hdl.handle.net/10985/10828
To cite this version :
Adrien BARTHOU, Andras KEMENY, Gilles REYMOND, Frédéric MERIENNE, Alain BERTHOZ -Driver trust and reliance on a navigation system: Effect of graphical display - In: Driving
Simulation Conference, France, 2010-09-09 - Les Collections de l'INRETS - 2010
Any correspondence concerning this service should be sent to the repository Administrator : [email protected]
Driver Trust and Reliance on a
Navigation System: Effect of
Graphical Display
Adrien Barthou1,2, Aandras Kemeny2,3, Gilles Reymond2,Frédéric Mérienne3 Alain Berthoz1
1
LPPA, CNRS-Collège de France, 11, place Marcelin Berthelot, 75005 Paris
2
CTS, RENAULT,
1, Avenue du Golf, 78288 Guyancourt
3
LE2I, CNRS- Arts et Métiers,
2, rue Thomas Dumoret, 71110 Chalon-sur-Saône
[email protected], [email protected], [email protected], [email protected], [email protected]
Abstract – The present study investigates the influence of in-car navigation
system graphic’s appearance on driver trust and reliance on the system. Two navigation systems were used: one with a realistic interface and one with a symbolic interface. During driving sessions on a simulator, the systems committed some guidance incoherencies regarding road signs present in the virtual environment. Subject’s trust and reliance on navigation systems were measured and compared between both systems. Result showed a higher level of trust for the realistic appearance system than for the symbolic one during the whole experiment. The presence of incoherencies decreased trust level for both systems but without any significant difference. No difference in system’s reliance was found but two groups of subjects were identified. One group is highly relying on both navigation systems’ indication when incoherence occurs whereas the other group was not. This study highlights the interaction of subjective items, as system graphical appearance, on user trust. Further experiments using a modified experimental setup may be needed to analyze precisely the influence on user reliance
Résumé - Cette étude analyse l’influence de l’apparence graphique d’un système
d’aide à la navigation sur le niveau de confiance et d’utilisation du système par le conducteur. Deux systèmes d’aide sont utilisés : un avec une interface graphique réaliste, et un avec une interface graphique simpliste. Durant des sessions de conduite réalisées sur simulateur, des incohérences dans le guidage du système vis-à-vis des panneaux présent dans l’environnement routier seront commises. Le niveau de confiance des sujets envers le système et son utilisation sont
enregistrés et comparés entre les deux systèmes d’aide à la navigation. Les résultats montrent un niveau de confiance plus élevé tout au long de l’expérience pour le système avec une interface graphique réaliste. La présence d’incohérences de guidage engendre bien une diminution du niveau de confiance mais sans différence notable entre les deux systèmes. Aucune différence du niveau d’utilisation n’est enregistrée mais deux groupes de sujets sont identifiés. Un groupe de sujets se fie largement aux directions indiquées par les deux systèmes lors des incohérences, alors que l’autre groupe non. Cette étude souligne les interactions d’éléments subjectifs, comme l’apparence graphique d’un système, sur le niveau de confiance de l’utilisateur. Une autre phase expérimentale utilisant un protocole modifié serait nécessaire pour analyser en détail l’influence sur le niveau d’utilisation du système.
Introduction
Some recent in-car navigation systems display very detailed maps or even present a realistic complex environment or even presenting a realist 3D view of the driving environment. However it is not clear whether this graphical improvement is only an aesthetic benefit or whether it also influences the driver’s interaction with the system.
Trust is an important factor to consider when studying human-machine interactions because it mainly determines if the process will be done manually or using the system (1, 2). Trust can be considered as a feeling and is needed when there is a lack of objective clues on the system’s global performance (3). In this case, operators can pass through those unknown features by referring to their trust in the system. Trust can be described as composed of three parts: analytic, analogical and affective (4, 5). Trust can be built on objective items known about the system influencing the analytic part (its reliability), on contextual items influencing the analogical part (its data relevancy for the task, designers reputation), or on subjective items influencing the affective part (inclination towards electronic systems, system appearance, etc).
Reliability is a main factor influencing trust which has been largely studied (6, 7, 8, 9). Studies agree on the fact that a decrease of a system’s reliability decreases the trust level the operator has in this system. The amplitude of the error committed by the system also plays a role on its impact on operator’s trust (10).
Several studies have otherwise analyzed the influence of graphic’s appearance on user trust and use of systems. Yeh (11) shows in 2001 an influence of realistic interfaces on user reliance on a target cueing system. Interface aesthetics is also strongly correlated with perceived usability of the computer before and after its use (12). Van Hugt’s study (13) shows that interface “beauty” can positively influence user’s involvement in the task. We can speculate that the appearance of an in-car navigational system can influence the affect process of driver’s trust. A realistic interface could increase trust in the system even if there is no objective evidence confirming this judgment.
If trust can be influenced by the system’s appearance, we can speculate that the system reliance could also be. Reliance is the level of effective usage of the available system while accomplishing the task. Reliance must be well calibrated according to the system objective performance. Over-reliance can lead to failure in accomplishing the task or to accidents. Trust in a system and system reliance seems highly linked (1) but system reliance also depends on other factors than just trust (9, 14) such as personal preferences (15). In other words, it is possible to trust a system but not to rely on it to execute the task. In our case, the question is whether a realistic appearance increases both the trust level in the system and the system reliance comparing to a symbolic appearance system.
When a system’s realistic appearance leads to over-reliance, a complacent behavior can be expected, and can be defined as “a psychological state characterized by a low index of suspicion” (16). A simple lack of monitoring is not the origin of a complacent behavior (17). A complacent operator does see the system’s mistake but thinks that the system is correct even if clear evidences are available to demonstrate that the system is not. Being complacent can obviously lead to safety issues if the system asks the driver to act in a dangerous manner (one-way street, closed road…).
The purpose of the present study was to evaluate the influence on trust and reliance of two generic in-car navigation system interfaces using a simulated driving task.
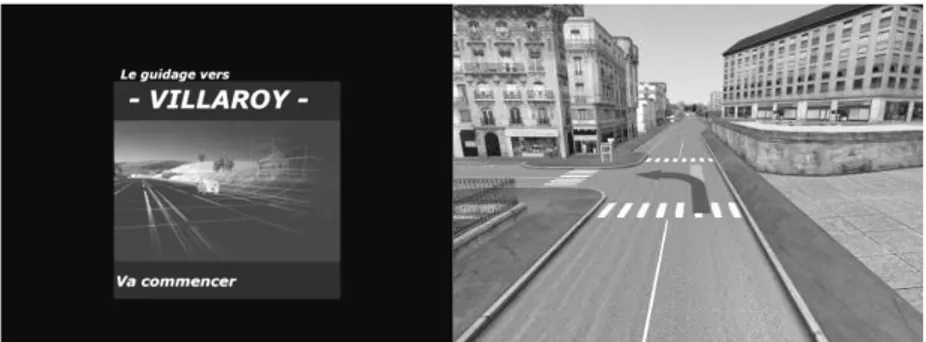
Figure 1. Realistic navigation system interface. System’s starting picture (left) and an example of guidance picture (right)
Figure 2. Symbolic navigation system interface. System’s starting picture (left) and an example of guidance picture (right), corresponding to the
Two navigation systems have been specifically designed for the study: one with a realistic interface (Fig. 1) and one with a symbolic one (Fig. 2). In order to compare the trust evolution for those two systems in the experiment, both systems have the same working and reliability rate but they will both commit 10 guidance incoherencies in relation to road signs present in the driving environ-ment. The driver’s decision to follow the navigation system’s indication and not the road sign indication shows driver reliance. A crossroads where the navigation system advises to take a one way street is present in order to reveal complacent behavior and safety issue. From the existing literature, we expect that:
− Trust in the navigation system with the realistic interface will be higher and less impacted by system incoherencies.
− Reliance in the navigation system with the realistic interface will be higher than with the other system and could even support complacent behavior.
Materials and Methods
Simulator setup
The experiment was conducted on a simulator in the LPPA (UMR7152, CNRS Collège-de-France, Paris). It was composed of a Thrustmaster “Ferrari racing wheel”, with brake and throttle pedals, placed on a table. The driving simulation software used is SCANeR©II (v 2.22) (http://www.scanersimulation.com).
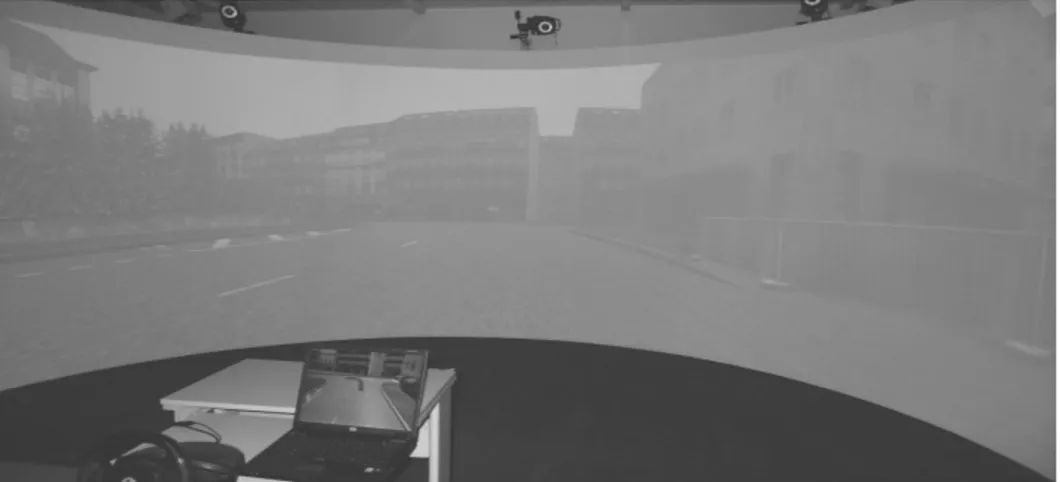
The graphic database reproduces an urban environment. The environment was displayed on a 4 m diameter curved screen with 2.5 m height. The steering wheel was placed on the centre of this screen which provided a wide vision of 180 degrees for the driver. Transmission was set to be an automatic gearbox. Indicator buttons were placed on the left and right back side of the steering wheel. Two speakers placed under the table were rendering the audio environment. The navigation systems were emulated using SCANeRII© software and theirs indications were displayed one a 15” laptop screen placed on the right side of the steering wheel (Fig. 3).
Task
The subjects’ primary task was to drive from their starting point to a spot in the virtual environment called “Villaroy”. To do so, they could either follow the road sign indications present in the virtual environment or follow the indications given by the navigation system. The second task was to put the indicators at each crossroads, but only when they had clearly decided which direction they will take at the crossroads.
During some trials, the indication proposed by the navigation system at a specific crossroads will be incoherent with road signs. The subject will thus have to decide to follow one of the two indications in order to reach their destination.
Procedure
Fourteen subjects aged 20 to 36 took part in the experiment (one woman and thirteen men). Each subject had to drive 23 different driving sessions in an unknown urban virtual environment. Their mean speed was about 40 km/h. Each driving session lasted between 3 and 4 minutes and was composed of six to nine intersections. After the training session, the first navigation system used was visually presented to the subject (Fig. 1 and 2).
Each subject then drove eleven driving sessions with each system: two sessions of driving without the navigation system, three sessions with a navigation system without incoherence, and six sessions where the system will commit incoherencies. Subjects were not aware of the possible system’s incoherencies: The system either asked to take a one way street or an impossible way due to roadwork, or just another direction than those indicated by road signs.
The order of occurrence of incoherence was the same for the two systems. The order of use of the two navigational systems was counterbalanced among subjects, as well for the eleven driving sessions performed with each system
The two navigation systems used were only different for their graphical appearance. The “realistic system” was presenting a screenshot of the incoming crossroad with a red arrow incorporated in the screenshot to show the direction (Fig. 1). The other system, the symbolic one, was presenting the same red arrows as the realistic system but on a homogeneous grey background (Fig. 2). As visible in Figure 2, pink lines showed existing roads at the incomming intersection in order to give informations on the structure of the intersection.
Measurement and questionnaires
The trust level was evaluated using Jian’s questionnaire (18). All questions were on a 7 level scale: 1 means “not at all” and 7 “absolutely”. Each subject answered to this questionnaire three times for each navigation system. After the system visual presentation (Questionnaire 1, named Q1), after the three sessions without incoherencies (Q2), and after the six sessions containing guidance incoherencies (Q3). The purpose was to assess the evolution of the level of trust through the experiment for the two systems (before and after guidance incoherencies) and compare this level of evolution and value between systems.
Subjects were asked to put their indicators when they have decided on the direction they will follow at the incoming crossroads. The time elapsed between the navigation system’s indication display and the indicator was considered as the reaction time for the subject to take their decision of their future direction.
The direction chosen by subject when incoherence occurs were recorded and was used to assess system reliance.
Scores obtained from the questionnaires were analysed with a one way repeated measure ANOVA. Indicators’ delay were analysed with a Chi² of independence.
Results
Subjective data
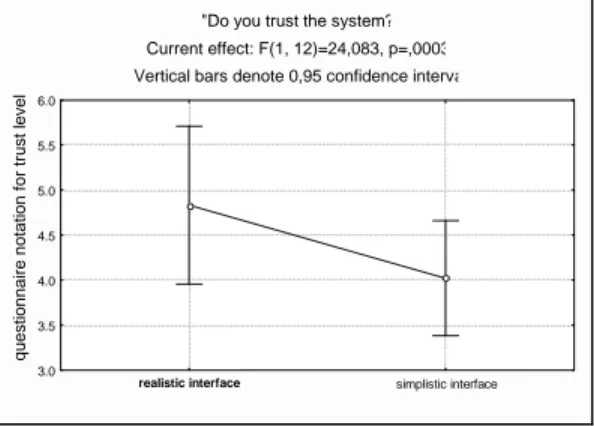
Results showed a main effect of the appearance on general user trust in the system. Subjects declared that they do trust more the realistic system than the symbolic one (ANOVA F = 24 dl = 2 p < 0.001) (Fig. 4).
"Do you trust the system?" Current effect: F(1, 12)=24,083, p=,00036 Vertical bars denote 0,95 confidence intervals
realistic interface simplistic interface 3.0 3.5 4.0 4.5 5.0 5.5 6.0 q u e s ti o n n a ir e n o ta ti o n f o r t ru s t le v e l
Figure 4. Mean score of trust level for realistic and symbolic system during the whole experiment. Questionnaire scale is from 1 to 7
This effect of the system appearance was also visible on other items of the questionnaire: “The system provides safety” (F = 7.23 dl = 2 p < 0.05) or “I can rely on the system” (F = 23.4 dl = 2 p < 0.001). These positive points associated with an interaction with an automated system obtained a higher scoring with the realistic system than with the symbolic. Data also showed that negative points concerning the interaction between human and automation obtained a lower scoring for the realistic system than for the symbolic one. This effect was significant the following items: “I am suspicious of the system’s intent, action or input” (F = 6.3 dl = 2 p < 0.05), “The system is deceptive” (F = 21.81 dl = 2 p < 0.001) or “The system behave in an underhanded manner” (F = 9.7 dl = 2 p < 0.05).
This effect was significant when considering all scoring of each system. However, no significant difference of trust level appeared between the two
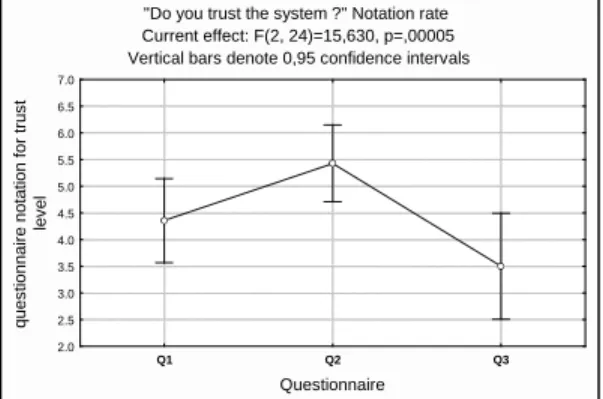
systems when comparing the first questionnaire, the second or the third questionnaire (tested with a Tukey HSD test). There was a significant decrease of the level of trust after sessions containing guidance incoherencies (between questionnaire Q2 and Q3, with HDS Tukey test p < 0.05), but this decrease was not significantly different between the realistic and symbolic system (Fig. 5).
"Do you trust the system ?" Notation rate Current effect: F(2, 24)=15,630, p=,00005 Vertical bars denote 0,95 confidence intervals
Q1 Q2 Q3 Questionnaire 2.0 2.5 3.0 3.5 4.0 4.5 5.0 5.5 6.0 6.5 7.0 q u e s ti o n n a ir e n o ta ti o n f o r tr u s t le v e l
Figure 5. Trust level evolution during the experiment, both navigation systems mixed. The score of the three questionnaire (Q1 Q2 nd Q3) are displayed. Incoherences are committed in driving sessions between Q2
and Q3
Objective data
There was no significant effect of system’s appearance on subjects’ reliance. However, two groups of subjects were easily distinguishable when incoherences occured. One group follows 70% of the time the system’s indication (high reliance group). The other group was relying less on the systems and followed their indications only 14% of the time (low reliance group). All subjects who had taken the one-way street because the system asked them to do so where in the high reliance group.
There was no significant effect of system’s appearance on the reaction time for pressing the indicator’s key, as much for crossroads with incoherences as for crossroads without incoherences.
High reliance group and Low reliance group
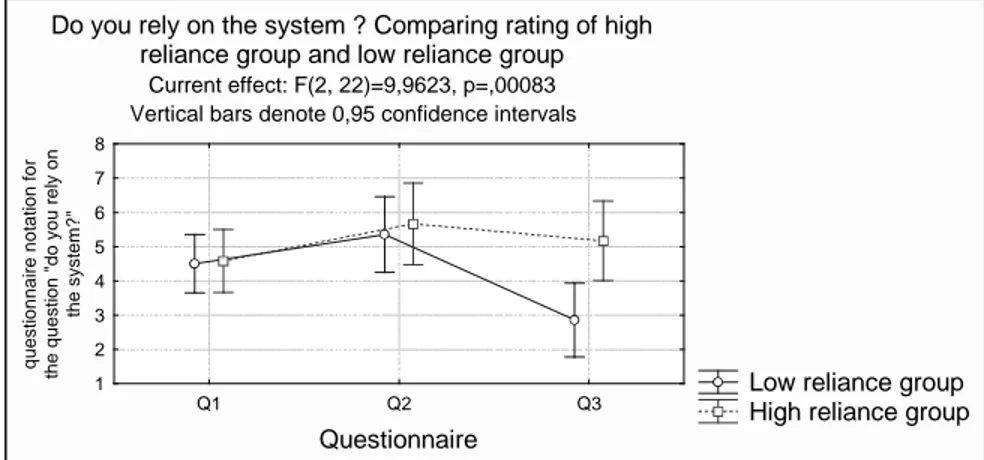
High reliance subjects declared to rely more on the system than low reliance subjects (ANOVA F = 6.2 dl = 2 p < 0.05). Particularly, we have an interaction between questionnaire scores and subjects reliance level (F = 9.9 dl = 2 p < 0.001). Post hoc test (HSD Tukey) showed a significantly lower notation for “relying on the system” after sessions with incoherencies for the low reliance group than for the high reliance group (p < 0.05) (Fig. 6). For notation before incoherencies (Q1 and Q2), no difference was found. The question “Do you trust the system?” showed a significant decrease of trust after incoherencies (Q3) only for the low reliance group (p < 0.001). System reliability was also rated higher in the high reliance group (F = 7.7 dl = 02 p < 0.05).
Do you rely on the system ? Comparing rating of high reliance group and low reliance group
Current effect: F(2, 22)=9,9623, p=,00083 Vertical bars denote 0,95 confidence intervals
Low reliance group High reliance group
Q1 Q2 Q3 Questionnaire 1 2 3 4 5 6 7 8 q u e s ti o n n a ir e n o ta ti o n f o r th e q u e s ti o n " d o y o u r e ly o n th e s y s te m ? "
Figure 6. Reliance level declared in questionnaire Q1, Q2 and Q3 by the high and low reliance group during the experiment. Incoherencies are
committed in sessions between Q2 and Q3
Discussion
The results showed an effect of system appearance on operator judgment of trust in the system. As indicated in web site studies (19), some graphical items can increase or decrease the level of trust even if they do not refer to a specific intrinsic quality. In our study, a navigation system with a realistic graphical appearance got a higher trust level. Whereas the evolution of trust level was not significantly different between the two systems before and after a decrease of their reliability (presence of incoherencies), the trust level of the realistic system always stayed higher. Other positive items of the questionnaire linked to the interaction with an automated system also had this profile. Consistently, negative items got a lower score for the realistic system than the symbolic system. Although graphic’s appearance does not give any objective information about the system quality, it can interfere with the perceived trustworthiness of this system. Indeed, trust is not fully based on objective parameters but is an emotional concept (19) thus has an affective part (4) that can let subjective items interfere with trust. The symbolic system was also provinding less visual information, as contextual information. Thus system’s appearance may also has interfered with the analogic part of trust by provinding different quality of information (4), whereas basic direction indication was present and fully understandable in both systems. The effect of the graphical appearance has thus an effect on those different parts of the judgment of operator on automated systems that are linked with trust.
Contrary to our expectation, the reliance on the system was not affected by the system appearance. This is not incompatible with the effect observed on trust (6, 9). Indeed, trust and reliance are notions that can or must be separated (8). System’s appearance may have an effect on trust, but it may be too weak to interact with system reliance during use. Furthermore, as a subjective item, system’s appearance may interact firstly with trust which is also an emotional or subjective judgment.
With both systems, some subjects clearly preferred to follow the road sign indications whereas others followed the system’s indications. Both systems were concerned. System reliance depends on subject trust of the system but also on other factors as personal preferences (15). We showed here a high difference of reliance that was not clearly based on system trust. Comparing the two groups, trust level for both systems was very close and the significant difference only appeared after navigation system’s incoherencies. Trust of subjects of the high reliance group was less impacted after navigation system’s incoherencies. Personal preferences concerning automated system could have determined the fact to rely or not on the system and may have modulated the impact of reliability on trust. Subjects of the high reliance group also seemed to be more complacent than the others as they were more likely to take the one-way street, particularly when indicated by the realistic system. They took this way five times out of six with the realistic system. On this specific point, further experiments need to be done to confirm the impact of a realistic system on complacent behavior of high reliance subjects. We may think that reliance may be impacted by the lack of perceived danger during simulated driving sessions, in particular for this one-way street case. Nevertheless, using a simulator with such a complex urban environ-ment seems well adapted for the general trust measure in the navigation system.
Conclusion
Our study reveals the influence of graphical display on the feeling of trust in a navigation system. Trust level is higher in a graphically realistic system than in a simple one whereas their functionning is identical. Unfortunately, we could not clearly distinguish if the system’s appearance has here influenced trust via the affective part du to the system’s interface presentation or via the analogical part du to the difference of visual information available betwenn both systems. This effect on trust seems also too weak to have a significant influence on the decrease of trust due to the system’s decreased reliability.
We did not notice difference in users’ reliance in the system comparing the two system appearances. Two groups of users were identified, one highly relying on system indication, and another not. Complacent behavior seems to be found in subjects from the high reliance group, particularly with the graphically realistic system. Further studies are needed to analyze trusting phenomenon in realistic versus symbolic display system while driving.
Keywords: trust, reliance, navigation system, graphical appearance.
Bibliography
1 - Muir B. (1994) « Trust in automation. Part I: Theoretical issues in the study of trust and human intervention in a process control simulation ».
Ergonomics, vol. 37 n. 11, 1905-1922.
2 - Muir M. (1996) “Trust in automation. Part II. Experimental studies of trust and human intervention in a process control simulation”. Ergonomics, vol. 39, n 3, 429-460.
3 - Rielgelsberger J. (2005) “The mechanics of trust: a frame work for research and design”. Human Computer Study, 62, 381-422.
4 - Lee, J.D. (2004). “Trust in automation: designing for appropriate reliance”.
Human Factors, Vol. 46, n. 1, 50-80.
5 – Parasuraman R. (2004) “Trust and etiquette in high-criticality automated systems”. Communication of the ACM, vol. 47 n. 4.
6 - Wiegmann A. (2001) « Automated diagnostic aids: the effect of aid reliability on users’ trust and reliance ».Theo. Issue in Ergonomics, Vol. 2, n. 4, 352-367.
7 - Dzindolet M.T. (2003) « The role of trust in automation reliance ». Int.
Journal of Human Computer Studies, 58, 697-718.
8 - Moray J. Lee, N. (1992) « Trust, control strategies and allocation of function in human-machine systems ». Ergonomics, vol. 35, n. 10, 1243-1270. 9 - Bisantz M. (2001) « Assessment of operator trust in and utilization of
automated decision-aids under different framing conditions ». Int.
Journal of Industrial Ergonomics, 28, 85-97.
10 - de Vries P. (2003) “The effects of errors on system trust, self confidence, and the allocation of control in route planning”. Int. Journal of Human
Computer Studies, 58, 719-735.
11 - Yeh M. (2001) “Display signalling in augmented reality: effects of cue reliability and image on attention allocation and trust calibration”.
Human Factors, vol. 43, n. 3, 355-365.
12 - Tractinsky N. (2000) “What is beautiful is usable”. interacting with
computer, 13, 137-145.
13 - van Vugt H.C. (2007) “Realism is not all! User engagement with task related interface characters”. Interacting with Computer, 19, 267-280. 14 - Lee J.D. (1994) “Trust, self-confidence, and operators’ adaptation to
automation”. int. journal of Human Computer Studies, 40, 153-184. 15 - Parasuramann R. (1997) “Humans and automation: use, misuse, disuse,
abuse”. Human Factors, 39(2), 230-253.
16 - Parasuramann R. (1993) “Performance consequences of automation-Induced “Complacency””. The Int. Journal of Aviation Psychology, 3(1), 1-23.
17 - Moray N. (2003) “Monitoring, complacency, skepticism and eutectic behaviour”. Int. journal of industrial ergonomics, 31, 175-178.
18 - Jian J. (2000) « Foundation of an empirically determined scale of trust in automated systems ». Int. Journal of Cognitive Ergonomics, 4(1), 53-71.
19 - Kim J. (1998) “Designing towards emotional usability in customer interfaces-trustworthiness of cyber-banking system interfaces”.