is an open access repository that collects the work of Arts et Métiers Institute of
Technology researchers and makes it freely available over the web where possible.
This is an author-deposited version published in: https://sam.ensam.eu Handle ID: .http://hdl.handle.net/10985/8693
To cite this version :
Georges FOKOUA, Céline GABILLET, Catherine COLIN - Experimental study of bubble-drag interaction in a Taylor-Couette flow - In: 8th International Conference on Multiphase Flow (ICMF 2013), Jeju, Korea, May 2631, Korea, Democratic People's Republic Of, 201305
Experimental study of bubble-drag interaction
in a Taylor-Couette flow
G. Fokoua1, C. Gabillet1, C. Colin2
1
IRENav, Research Institute of the French Naval Academy, Lanveoc Poulmic, France
2IMFT, Institute of Fluid Mechanics, Toulouse, France
Keywords: bubble dispersion, viscous torque, Taylor vortices
Abstract
This study is an experimental investigation of the interactions between the bubbles, the coherent motion
and the viscous drag in a Taylor Couette flow, for the outer cylinder at rest. The cylinder radius ratio
η
is
0.9. Bubbles are injected through a needle at the bottom of the apparatus inside the gap. Different bubble
sizes are investigated (ratio between the bubble size and the gap width 0.05 and 0.12) for very small void
fraction (
α
≤
0.012). Different flow regimes are studied corresponding to Reynolds number Re based on
the gap width and the velocity of the inner cylinder ranging from 400 to 20000. For these Re values,
Taylor vortices are persistent leading to an axial periodicity of the flow. PIV measurements of the liquid
flow features, bubble tracking in a meridian plane and viscous torque of the inner cylinder measurements
are performed. This study provides a first evidence of the link between the bubble localisation, the Taylor
vortices and viscous torque modifications. Bubbles are attracted towards the inner cylinder, due to the
rotation of the cylinder. For small buoyancy effect, bubbles are trapped and induce a decrease in the
outflow intensity, thus leading to an increase of the viscous torque. When buoyancy induced bubble
motion, by comparison to the coherent motion of the liquid is increased, a decrease in the viscous torque
is suspected.
Introduction
The Taylor Couette device can be considered as an academic one to study bubble induced modifications of the viscous drag. Indeed, it is a closed system and characterizing the viscous drag consists in characterizing the viscous torque applied on the inner cylinder. Moreover, for high Reynolds numbers, the Taylor Couette flow has many similarities with the boundary layer flow developing over a flat plate.
In the context of naval hydrodynamics, bubble injection can be intended to reduce the ship hulls’ viscous resistance. Actually, the physical mechanisms implied into the bubbly drag reduction expected for ship hulls applications are not completely understood. As a consequence, it is difficult to extrapolate results obtained for small scale models to large scale ship’s hull model and a bubble injection system that is appropriate for a typical ship hull and a specific velocity range can be no more fitted when it is carried out for a different ship hull and/or other velocity ranges.
Therefore, injecting bubbles inside a Taylor Couette flow can make it possible to study the interactions between bubbles and the wall shear stress. In a turbulent Taylor Couette flow, there are 3 main contributions: a mean azimuthal flow, large scale Taylor vortices (with associated inflow/outflow jets regions) and small scale turbulent
structures. Thus injecting bubble in this kind of flow is interesting because bubbles can interact with these different kinds of motions and can lead, for very specific conditions, to viscous torque reduction. In the literature, the bubbly drag reduction in the Taylor Couette flow was studied for the outer cylinder at rest. When it is observed, the torque reduction is likely to be associated either with a destructuration of the Taylor vortices by the bubble upward motion in the case of weak turbulent and turbulent Taylor vortex flow (Murai, 2008, Sugiyama et al., 2008) or associated with the contribution of the deformation of the bubbles in the case of the high Reynolds numbers (Re>8 105), (Van den Berg et al., 2005, 2007, Van Gils et al., 2011a, 2011b). According to Murai et al. (2008), there is a Reynolds range, for which the relative contribution of the Taylor vortices to the global flow and the bubble deformation are too small to bring about torque reduction, thus leading on the contrary to a torque augmentation. Nevertheless, a common point when viscous torque reduction is observed is the existence of a void fraction peak near the inner cylinder wall. It is then worth trying to characterize the bubble dispersion in this typical flow and trying to understand the link between the bubble dispersion and the viscous drag increase or decrease at the inner cylinder.
studied experimentally for different geometries (different radius ratios) and different Reynolds numbers range. For the weak turbulent flow and turbulent Taylor vortex flow, it is highlighted that bubbles have preferential accumulation regions, depending on the bubble size to the gap width ratio (db/d) and the Reynolds number: either in the Taylor vortices (Mehel, 2007) or in the outflow region (induced by the vortices) near the inner cylinder (Mehel, 2007, Murai, 2008). For the turbulent flow, there is a preferential accumulation near the inner cylinder with a homogeneous axial distribution (Van Gils, 2011a).
The strong accumulation of the bubbles near the wall is linked to the contribution of the added mass force induced by the mean azimuthal flow. This force plays the same role as the buoyancy force when bubbles are injected under a ships hull.
Climent et al. (2007) and Chouippe et al. (2012) have performed numerical analysis of the bubble dispersion for the first instabilities and for the turbulent Taylor vortex flow respectively. Preferential accumulation of the bubbles in the axial and radial directions is discussed as a function of respective dimensionless parameters. For very small bubbles, the size of which is of the order of the viscous length scale, it is evidenced that the small scale turbulence can play a role, by trapping bubbles inside the low shear stress streaks near the inner cylinder (Chouippe, 2012). In the case of experimental study of bubble dispersion inside Taylor Couette flow, as the void fraction was characterized by intrusive method (optical probes), very few profiles of void fraction are provided in the literature (Mehel, 2006, 2007, Murai, 2008, Van Gils, 2011a). Measurements can evidence the radial distribution of the void fraction at an axial position but they do not enable to characterize the axial distribution when it is subjected to the Taylor Vortices. In the numerical studies dedicated to bubble dispersion in Taylor Couette flow, the calculation carried out by bubble lagrangian tracking in the case of bubble passive dispersion (one way coupling, Chouippe, 2012) or bubble active dispersion (two way coupling, Sugiyama et al., 2008, Chouippe, 2012) provides the void fraction distribution. Nevertheless, the numerical models do not take into account the interactions between the bubbles and the results are very sensitive to the formulation of the lift coefficient (Sugiyama et al., 2008). Thus performing fine measurements of the void fraction axial and radial distribution, when bubbles are injected inside a Taylor Couette flow, according to the conditions of the flow (radii ratio, bubble size to gap ratio, Reynolds number) is of interest, in order to understand the bubble-induced modifications of the wall shear stress. The aim of this paper is to shed more light in the mechanisms of bubble interactions with the wall shear stress in a Taylor Couette flow by focussing on the link between the bubble dispersion and the liquid flow. Experiments are carried out in the same experimental set up as in Mehel et al. (2006, 2006b, 2007), corresponding to a radius ratio of 0.91, The Reynolds number range investigated in this study [400, 20000] is larger than in Mehel et al. Two typical sizes of bubbles (db/d=0.12 and 0.05) are tested. In order to enable the characterization of the bubble dispersion by visualisation, the global void fraction was willingly limited to a small value (α<0.012), smaller than in Mehel et al.
Section 1 is a description of the experimental set up, The viscous torque measurements are shown and discussed in section 2. Section 3 deals with the description of the bubble arrangement. Void fraction distributions and the eulerian velocity fields of the bubbles measured in a meridian plane are presented in section 4. Section 5 shows some PIV /velocity maps of the liquid flow. Section 7 is dedicated to the discussion.
Nomenclature d db g G L Lc
Gap between outer and inner cylinders (m) Bubble diameter (m) gravitational constant (ms-2) dimensional torque Cylinder length (m) Needle’s length (m) P pressure (Nm-2) Qg R
Air injection rate (m3/s) Cylinder radius (m) Re T Ta U u* Vb W Reynolds number Viscous Torque (Nm) Taylor number Radial velocity (m/s) Friction velocity (m/s)
Upward rising velocity of the bubble (m/s) Axial velocity (m/s) Greek letters α void fraction η λ ν Φc τ Ω
ratio of inner over outer cylinder radii axial wavelength (m)
kinematic viscosity of the fluid (m2.s-1) needle’s diameter (m)
wall shear stress (N/m2)
rotational angular velocity (rad/s)
Subsripts i
o g l
relative to inner cylinder relative to outer cylinder relative to gas phase relative to liquid phase
Experimental Facility
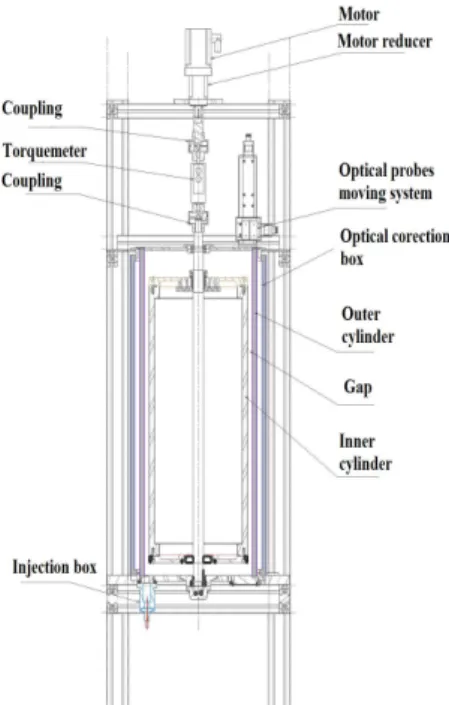
Figure 1 shows a sketch of the experimental set up. The experiments were carried out in a vertical Circular Couette-Taylor device, composed of concentric inner and outer cylinders. The outer cylinder is at rest. The radius of the inner and outer cylinders are Ri=200 mm and Ro=220 mm respectively, the height L of the inner cylinder is 886mm. The device’s geometry is characterized by a radius ratio η=
0 i R
R
equal to 0.91 and a clearance ratio Γ= d L
of 44.3. The gap, the width of which being d=20mm, was filled with a mixture of water and glycerol, with a free surface 1cm above the inner cylinder. The device is the same as used in Mehel et al. (2006), set apart that the motor has been displaced from the bottom to the top of the device, to ensure a better seal and make easier the installation of a
torquemeter and that the bubble generation system is different (bubble injection instead of ventilation by the free surface or gaseous cavitation in Mehel, 2006). A further modification with respect to Mehel et al. (2006) lies in the fact that the device can be enclosed into a plexiglass box, filled with the same mixture as in the gap, in order to limit optical distortion effect.
The Reynolds number of the flow Re is defined as: ν
Ω
= R d
Re i i . The Taylor number is a correction of the Reynolds number, taking into account curvature effect:
η η −
=Re 1
Ta . For the geometry at stake, the critical values of Re and Ta, characteristic of the 1st instability, are Rec=137, and Tac =43.3 (Mehel, 2006), respectively. The Reynolds number was varied both by changing the angular velocity of the rotating inner cylinder Ωi and by changing the viscosity ν of the mixture (mixture of 65% glycerol or 40% glycerol). Attention was paid to reproduce the same start up procedure to achieve a given Reynolds number as in Mehel et al. (2006b), leading to same state of the flow for the single-phase flow. For the two-phase flow, injection began before the start up of the motor. Same procedure of the acceleration of the inner cylinder was then applied in two-phase flow as in single-phase flow.
Bubbles were injected through a needle in a box filled with the mixture at rest localised at the bottom of the apparatus. The injection pressure was controlled by a manometer of accuracy ±0.01bar. Different needles diameters were tested (Φc=20µm and Φc=180µm), leading to different mean bubble size (db=992µm and db=2400µm) respectively. The injection was characterized by video recording for different conditions, the results (pressure, bubble size, air injection rate) are summarized in Table 1.
Vb is the bubble rising velocity, determined in infinite and still mixture, based on the bubble size and viscosity of the mixture at 20°C (linearized form of the drag force coefficient applied on the bubble from Mei et al. (1994)). As can be seen, the global air injection rate Qg was very small, in order to enable individual bubbles tracking by visualisations inside the gap.
Figure 1: Sketch of the experimental setup. Mixture % of glycerol Φc (µm) Lc (mm) P (bars) Injection pressure db(µm) Qg (mm3/s) Vb (m/s) 65% 180 50 1.18 ±0.01 2400 ±89 583 ±17 0.27 40% 20 10 6 ±0.01 992 ±47 23 ±5 0.23 Table 1: Characteristics of the bubble injection for the different air injection conditions.
(Lc and Φc are the length and inner diameter of the needle respectively. For the smallest needle, the air flow rate Qg is determined by video recording of the bubble size and frequency at detachment. For the largest needle, Qg is measured with an airflow meter (Gilmont instrument, ref. GF-4001).
Table 2 gathers the value of the parameters characterizing the two-phase flow for the different operating conditions. Mixture % of glycerol Re ν d W C H db+ <α> (%) cas e 65% 2470 300* 0.94 0.6 15.3 0.14 a 40% 3000 350* 0.26 0.55 7.5 0.011 b 6000 632** 0.46 0.45 12.4 0.024 c 10000 930** 0.68 0.35 18.2 0.035 d Table 2: Dimensionless parameters characterizing the two-phase flow for different operating conditions (* is referred to Mehel measurements (2006 b), ** is referred to Chouippe simulations (2012) for same geometry, db+ (eq. 6) is evaluated based on Wendt (1933) correlation for the dimensionless torque. C, H are dimensionless parameters (eq. 4 and eq. 5) crucial for the bubble localisation in the gap that are defined in section 6.
Torque measurements
The torquemeter (KISTLER, reference 4503A) is composed of strain gauges. It was mounted on the shaft which drives the rotation of the inner cylinder. The measurement range was chosen according to the Reynolds number value: it was set to [0-4Nm] if Re<10000, otherwise it was set to
[0-20Nm]. The torquemeter ensures the measurement of the torque with a global accuracy of ±0.1% of the measurement range, taking into account linearity and hystereris errors. The systematic error due to temperature drift in the range [15°C- 25°C] is 0.015% of the measurement range per degree. It leads to a possible systematic error less than 1% of the measured value. Data are collected by a 24 bits acquisition board, the output voltage level being in the range 0-10V.
For a measurement time of 60s, and a sampling frequency of 1kHz, the statistical convergence of the time averaged torque was ensured with a maximum relative uncertainty of ±0.17% (confidence level of 95%).
The measured torque includes both the contribution of the mechanical torque due to connection between the shaft and the inner cylinder and the contribution of the viscous torque exerted by the flow on the inner cylinder. The mechanical torque was characterized as a function of the rotational velocity for the gap filled with air and subtracted to the global measured torque.
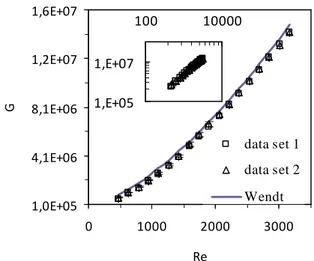
The normalized viscous torque G (eq. 1) obtained in single-phase flow is plotted with respect to the Reynolds number in Figures 2 and 3 for the mixtures containing 65% and 40% of glycerol respectively. Error bars take into account hysteresis error, linearity error, drift error due to temperature drift relative to 20°C and statistical convergence uncertainty. Two sets of data made at several days interval allow to quantify the reproducibility. The reproducibility error is less than 6% of the value, except for the largest values of the Reynolds numbers (30% for Re=1900 and Re=20000 in the mixture of 40% glycerol, 18% for Re=470 in the mixture of 65% glycerol).
In figure 2, and 3, good agreement is found between the measured viscous torque in single phase flow and the correlations of Wendt (1933) applied for a value of η=0.91 (eq. 2 and eq. 3). The relative difference is less than 5% for 3500<Re<12000. The viscous torque is underestimated (-20%) for Re<3500 and overestimated (+15%) for Re>12000. Curves plotted as a function of logarithmic coordinates evidence that the torque expands as a power of the Reynolds number, as expected by Wendt. For 2000<Re<10000, the power is 1.5, in agreement with Wendt’s correlation. For Re>10000, the power of the law is 1.78, a little larger than 1.7 given by Wendt.
L T G 2 ν ρ = (eq.1)
( )
1- Re for 400 Re 10000 * 1,45 G 1.5 4 7 1.5 ≤ ≤ η η =(eq.2)
( )
1- Re for 10000 Re 100000 * 23 . 0 G 1.7 4 7 1.5 ≤ ≤ η η = (eq.3) 1,0E+05 4,1E+06 8,1E+06 1,2E+07 1,6E+07 0 1000 2000 3000 Re G data set 1 data set 2 WendtFigure 2: Viscous torque of the inner cylinder in single-phase flow measured as a function of the Reynolds number for a mixture of 65% glycerol. Comparison with Wendt’s correlation (1933). 0,0E+00 1,0E+08 2,0E+08 3,0E+08 4,0E+08 0 5000 10000 15000 20000 25000 Re G dataset 1 dataset 2 dataset 3 Wendt
Figure 3: Viscous torque of the inner cylinder in single-phase flow measured as a function of the Reynolds number for a mixture of 40% glycerol. Comparison with Wendt’s correlation (1933).
Figure 4 and 5 display the viscous torque measured in two-phase flow for the largest and smallest bubbles respectively. To test reproducibility of injection effect on the viscous drag, different dataset were obtained for the same time after the inner cylinder velocity had reached its steady state, at several days interval. For the largest bubbles, the viscous torque increases with the Reynolds number (up to 10% of relative increase for Re=3000). For the smallest bubbles, the relative modifications of the torque are less important. Nevertheless, even if the trends are not very obvious, they are reproducible. It can be observed an increase (+5%) in the torque for Re≥14000 (ie: Ta≥4400) and a weak decrease (-2%) for Re≤6000 (ie: Ta≤1900), out of the range of systematic errors.
For same bubble size to gap width ratio (db/d≈0.05), Murai et al. (2008) attested that there is a drag decrease for Re≤4000 (ie : Ta≤1810, taking into account η=0.83 of their
1,E+06 1,E+08 1000 100000 1,E+05 1,E+07 100 10000
experimental set up) and a drag increase for larger Reynolds numbers. Note that in our experiment, the range of Taylor numbers for which drag reduction is suspected, is in agreement with the critical value of Murai.
1,E+05 4,E+06 8,E+06 1,E+07 2,E+07 0 1000 2000 3000 Re G single phase two phase dataset 1 two-phase dataset 2
Figure 4: Viscous torque of the inner cylinder measured as a function of the Reynolds number. for a mixture of 65% glycerol, Φc=180µm, P=1.08b. 50 mn after stabilizing the rotational velocity. Comparison with single-phase flow.
0,E+00 1,E+08 2,E+08 3,E+08 4,E+08 0 10000 20000 Re G single phase two phase dataset1 two phase dataset 2
Figure 5: Viscous torque of the inner cylinder measured as a function of the Reynolds number for a mixture of 40% glycerol, Φc=20µm, P=6b, 1h30 after stabilizing the rotational velocity. Comparison with single phase-flow. Bubble arrangement
Bubbles are periodically arranged in the axial direction as bubble strings (Figure 6). The string spacing is identified as the axial wave length. By counting the number of strings distributed over the height of the device, it was possible to determine the axial wave length, assuming that the flow is not axially stratified (this was not the case when waiting for at least 15 mn after the rotational velocity was stabilized). Figure 7 exhibits the axial wave length in single and two-phase flows, as a function of the Reynolds number, obtained for the different bubble sizes.
a) b)
c) d)
Figure 6: Visualisations of the two-phase flow arrangement for the different cases a to d. Traces of the bubbles are visible for several wavelengths over the height of the device by integrating with an exposure time of 20ms.
2 3 4 5 6 7 0 10000 20000 Re λ/ d single phase (Mehel, 2006) two phase, db=2,4 mm two phase, db=0,99 mm
Figure 7: Axial wave length measured as a function of the Reynolds number for the different mixtures and bubble sizes. Comparison with single- phase flow is also added based on Mehel’s measurements (2006) (Note that for Re=10000, Mehel didn’t evidence very clear Taylor vortices in single phase flow).
For the small bubbles, different trends are observed: a decrease in the axial wavelength for Re<=6000, an increase in the axial wavelength for Re>=14000. Interesting enough is the fact that these opposite trends observed on the wavelength can be associated with the opposite trends observed on the viscous torque. Note that for Re<=3000, small bubbles were not obviously organised as rings periodically arranged in the axial direction (Figure 6a). .
0,E+00 5,E+07 0 10000 0,E+00 3,E+06 0 1000
One reason is that there are too few bubbles to evidence a clear arrangement and the other reason is that it seems that during a period of rotation, bubbles are shifted from a string to the upper string, leading to a spiral arrangement.
Large bubbles bring about a decrease in the axial wavelength for Re<3500, as it was observed in Mehel et al. (2006b) for bubbles of size db/d=0.16 (db=3.2mm).
Mehel (2006) evidenced that the increase or decrease in the axial wavelength is closely linked to the localisation of the bubbles in the gap. More precisely, a preferential location in the Taylor vortices would entail a squeezing of the vortices, whereas a preferential location in the outflow region near the inner cylinder would lead to a stretching of the vortices. Thus, it is worth characterizing the bubble distribution inside the gap. For this purpose, high frequency visualisations of bubbles trajectories were carried out in a meridian plane.
Bubbles tracking
Ombroscopic lightning, associated with a Photron Fastcam SA3 caméra (8 bits, 12024*1024 pix2) and a Sigma 105mm macro lens (f2.8) were used to visualise the bubbles in a focusing plane, aligned with a radius (plane r-z). The sampling frequency was adjusted to
π Ω
2
1000 i . A sketch of the set up is shown in Figure 8.
Figure 8: Top view of the set up for bubbles tracking.
For this configuration, the device was enclosed into the plexiglass box, the size of the viewing window was reduced to 1024*512 pix2 (ie: 3.77d*1.88d), the size of the pixel being 74µm. As the axial length of the field of view can be less than one axial wave length, the camera can be displaced axially and the images can be recomposed.
The spatial resolution was quantified, based on the line spread function, defined as the derivative of the intensity in the direction normal a sharp edge. For this purpose, a reference pattern made of alternative black and white lines (25lines per inch) was used. The effective spatial resolution was deduced from the width at half the maximum value of the line spread function, ie: 294µm, making possible to detect with a good contrast bubbles larger than 588µm. The depth of field was characterized using a reference pattern inside the gap, it was 20 mm, leading to a possible contribution of the azimuthal velocity less than 10% of the
measured radial velocity in the outflow/inflow regions for bubbles at the edge of the depth of field.
Bubbles contours were detected on the images, by applying both a threshold on the grey levels and a threshold on the gradient of the grey levels. Contours were then filled. The double threshold method enables to get rid of bubbles localized out of the depth of field. The area, the equivalent radius and the coordinates of the gravity centre of each individual bubble were determined. Two bubbles at consecutive time step were assumed to be the same bubble, if the displacement of the gravity centre was less than half the equivalent radius, thus making possible to determine the instantaneous velocity of the bubble.
The distribution of the instantaneous gas volumetric characteristic function was calculated in an eulerian grid of 20*20pix2 (ie : 0.074d*0.074d). Same eulerian grid was used for the determination of eulerian phase averaging velocities of the bubbles. Statistical informations, such as the mean void fraction and the eulerian mean gas velocity were deduced from several thousand images, corresponding to 2 time period of the cylinder’s rotation. For this number of images, the statistical convergence of the time and space average void fraction is ensured.
Due to optical distortion, there was a shadow region near the inner cylinder, the size of which was 148 µm (0.007d) and 255 µm (0.013d) for the mixtures made of 65% and 40% glycerol respectively.
A six degrees polynomial function was used to correct both the radial position and the radial measured velocity (correction factor being 1.1 and 1.7 near the inner and outer cylinders respectively). The correction laws were validated on the pattern made of 25 pairs of lines per inch. The fit introduces an inaccuracy in the radial position determination that is maximum near the outer cylinder, approximately ±0.13mm (±0.0065d). Thus the global uncertainty on the radial positioning, taking into account the uncertainty in the shadow’s edge positioning, is expected to be ±424 µm (ie: ±0.02d).
The radial and axial positions are normalized by d and the velocity components are normalized by
d
ν . The
dimensionless radial position x is defined as:
(
)
5 . 0 d R rx= − i − , the zero position being the middle of the gap, x=-0.5 being the position of the inner cylinder.
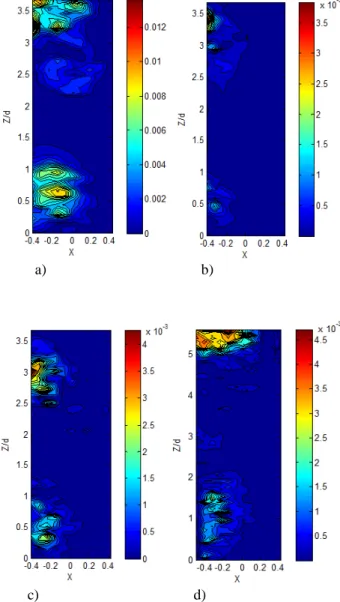
Figure 9 shows the void fraction distribution for the different cases referenced in Table 2.
Focusing plane= meridian plane
a) b)
c) d)
Figure 9: Void fraction distribution measured in a meridian plane by bubbles tracking for the different cases a, b, c and d.
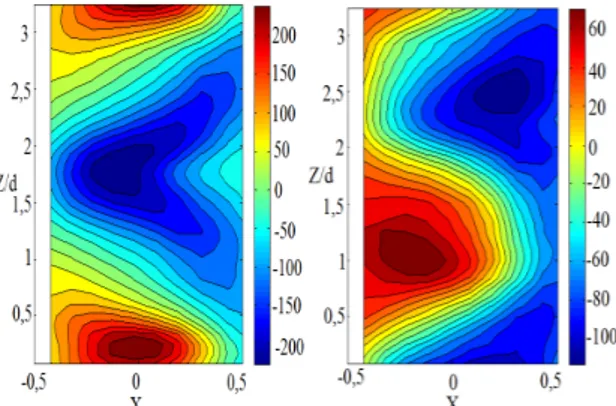
Figure 10 shows the distribution of the mean eulerian gas axial velocity for the different cases referenced in Table 2.
a) b)
c) d)
Figure 10: Axial component of the mean gas velocity measured in a meridian plane by bubbles tracking for the different cases a, b, c and d.
Alternative positive and negative gas axial velocity evidences the counter rotating Taylor vortices. Thus comparison between maps of axial velocity and maps of void fraction enable to understand how bubbles are preferentially arranged into the gap. Figure 11 depicts a schematic view of the bubble localization obtained for the different cases.
As expected, for cases a and c, bubbles are rather trapped in a vortex on two, in the region of downward velocity near the inner cylinder. This is in agreement with the observed decrease in the axial wave length. For case d, bubbles can still be trapped into a vortex on two but they are preferentially localized in the outflow region near the inner cylinder (maximum value of the void fraction). Preferential accumulation in the outflow region is in agreement with the observed increase in the axial wave length. The void fraction obviously increases with the augmentation of the Reynolds number, leading to more and more bubbles trapped. For case b, however, Figure10b doesn’t exhibit a clear alternance in the sign of the axial velocity, letting suppose that bubbles have rather an upward motion than being really trapped.
It should be noticed that the increase in the viscous torque of the inner cylinder is rather observed when bubbles are localized closer to the outflow than from the inflow (cases a and d). Small decrease in the torque is suspected when bubbles have an upward sliding motion near the inner cylinder (case b).
Figure 11: Schematic view of the bubble localisation in the meridian plane from a to d (left to right) (interpretation
based on gas axial velocity and void fraction maps) PIV
The velocity field of the liquid was investigated in a meridian plane by PIV. The system was composed of a double cavity pulsed laser (Newwave Gemini Solo 2) aligned with a radius, and a camera (Highsense PIV/LIF 1280*1024pix2) shifted by a 90° angle. The flow was seeded with fluorescent particles of size 20-50 µm. Pairs of images were acquired at a sampling rate of 4Hz and processed with Flowmanager 3.1.
The field of view was chosen in order to cover in the axial direction 3.3d. For the configuration at stake, the size of a pixel was 52µm.
The depth of field was limited by the width of the laser plane, which was 2mm, leading to a possible contribution of the azimuthal particle velocity less than 1% of the measured radial velocity in the outflow/inflow regions.
The spatial cross-correlation was calculated on a grid made of 64*64 pix2, with a 50%. recovering. Thus, the spatial resolution of the velocity measurement is 0.17d, and the velocity is displayed every 0.08d. With a time between two consecutive laser pulses set to 1ms, the subpixel resolution enabled a measurement of the velocity with an accuracy of ±5mm/s.
Here are just presented first measurements for one case (case a), for which millimetric bubbles are trapped by the vortices and induce viscous torque increase. These measurements are rather qualitative than quantitative, they just aim at comparing the maxima of axial and radial velocities in the vortices for the single phase and two-phase flows.
Thus, as a first approximation, the set up was not enclosed into the optical correction box for this application. Optical distortion in the radial direction was more important than for bubble tracking and leads to a shadow region near the inner cylinder of 988 µm for the mixture made of 65% glycerol. Optical correction was applied both on the radial position and radial velocity measured, by using a polynomial law, taking into account the absence of the box.
625 pairs of images were used to determine the mean velocity with a relative uncertainty of ±1% and ±4% for axial and radial components respectively and the rms velocities with a relative uncertainty of ±0.05%; These uncertainties are based on a confidence level of 95%. Velocity maps are compared between the single phase and case a, corresponding to bubble trapping by the Taylor vortices. Figure 12 shows the distribution of the mean liquid axial velocity.
Figure 12: Axial component of the mean liquid velocity measured in a meridian plane by PIV (left : single phase, right : two-phase case a)
Evidence of the bubble induced axial wavelength reduction can be observed for this case. Figure 12 depicts a decrease in the downward axial velocity of the liquid due to bubble capture, the upward velocity being of the same order as in single phase flow.
Figure 13 shows the distribution of the mean liquid radial velocity for same case.
Figure 13: Radial component of the mean eulerian liquid velocity measured in a meridional plane by PIV (left : single phase, right : two-phase case a)
The mean radial velocity of the liquid appears to be reduced by bubbles trapping. Interesting enough is the fact that the reduction of jets intensity is more important in the outflow. Figure 14 shows the distribution of the rms eulerian liquid velocity for same case. Taking into account the fact that the rms velocity was obtained by subtracting the local time averaged velocity of the liquid, this rms value is representative of the small scale turbulence (the large scale coherent motion contribution due to the Taylor vortices being included into the mean value).
Figure 14: Axial component of the rms liquid velocity measured in a meridian plane by PIV (left : single phase, right : two-phase case a)
As the Taylor vortices velocities are reduced by the bubbles, the small scale turbulence is obviously more homogeneous in the axial direction. What is interesting is the increase in the value of the rms velocity particularly near the wall, in agreement with the increase in the viscous torque observed for this case. Note that only the axial component of rms velocity is displayed but same result is encountered for the radial rms velocity.
Discussion
Climent et al. (2007) introduced dimensionless parameters to characterize the bubble accumulation into a Taylor Couette flow for the first instabilities.
The comparison between the centripetal force of the Taylor vortices and the centripetal force due to the inner cylinder rotational velocity makes it possible to characterise the radial accumulation of the bubbles. Indeed, an important value of parameter H (eq. 5) leads a bubble trapping inside the Taylor vortices, whereas a small value is in agreement with accumulation of the bubbles near the inner cylinder. The ratio of the axial velocity in the Taylor vortices to the bubble rising velocity, defined as parameter C (eq. 4) is expected to characterize the axial localisation of the bubbles. Indeed, a small value of C is representative of important buoyancy effects. If C is very small by comparison to 1, it can lead to bubbles rising regardless of the coherent motion, if C is the order of 1, it can bring about a bubble accumulation either in the Taylor vortices or in the outflow region near the inner cylinder, according to the value of H. With an important value of C, one can expect an axially uniform accumulation of the bubbles near the inner cylinder. Parameters C and H only characterizes interactions between the bubbles and the Taylor vortices. In the case of turbulent flow, another parameter db+, which compares the size of the bubbles to the size of the small scale turbulent structures must be introduced. As a first approximation, db+ can be based on the viscous length scale, deduced from the friction velocity (eq. 6 and 7). A small value of db+ will entail a bubble capture by the small scale turbulent structures, rather in the streaks of minimum wall shear stress, as observed by the numerical calculations of Chouippe (2012) and by Nino and Garcia (1996) for particles. For the turbulent Taylor vortex flow, the streaks of minimum wall shear stress are rather localised in the outflow region, with a periodical axial arrangement of 100 viscous length (Dong, 2008).
Values of these non dimensional parameters have been estimated and reported in Table 2 for the different cases studied. b V W C= (eq. 4) d R R W 4 H i 2 i i Ω = (eq. 5) ν = + b * b u d d (eq. 6)
with u*, the friction velocity taking into account curvature effects. u* is defined as ρ Ω µ − τ = i i * u (eq. 7).
τi is the wall shear stress at the inner cylinder, deduced from the dimensionless torque G:
2 i 2 i R 2 G π ν ρ = τ .
Values of these dimensionless parameters have been estimated and reported in Table 2 for the different cases studied. As expected, case b is in agreement with the smallest value of C<1 and thus bubbles are less sensitive to
the coherent motion, they are less trapped, the void fraction is smaller and their upward velocity tends to induce a spiral arrangement (Figure 6 a). As shown by Figure 11, when C increases, with the same magnitude as 1, bubbles are more and more trapped by the vortices, their equilibrium position shifting from a position near the inflow to a position near the outflow inside the vortices (comparison between cases b, c and a). For a value of C, same magnitude as 1, when H is too small to enable bubbles trapping by the vortices, bubbles are then trapped in the outflow region, in agreement with case d.
The bubbles accumulation in the flow has a direct influence on the liquid flow structures. As was shown from PIV measurements, bubbles trapping inside the Taylor vortices can lead to a decrease of the velocities of the Taylor vortices, leading to a contribution of the coherent motion that is reduced in favour of an enhancement of the small scale turbulence of the liquid. Generally speaking, in a Taylor Couette flow, the outflow is the region of minimum wall shear stress, and the inflow corresponds to the region of maximum wall shear stress applied on the inner cylinder. Thus the observed preferential decrease in velocity of the outflow can be responsible for the increase in the viscous torque. This situation is observed when bubbles are trapped by the vortices near the outflow (case a) and expected to occur also for bubbles accumulated in the outflow (case d). Thus one could expect the opposite trend (ie bubbles localized near the inflow close to the inner cylinder) for a bubble induced reduction in the viscous torque, but this trend needs to be confirmed by experimental investigation of the liquid flow.
Conclusions
This study provides experimental evidence of the interactions between the dispersion of the bubbles, the coherent motion and the viscous drag in a Taylor Couette flow. Two sizes of bubbles were tested in different mixture of water-glycerine, covering a wide range of Reynolds numbers. Bubbles accumulated near the inner cylinder. Different configurations were observed: bubbles can slide along the inner cylinder, they can be trapped by the vortices a vortex on two or they can accumulate in the outflow region. The trapping of the bubbles by the Taylor vortices induces a decrease in the axial wave length of the flow whereas a preferential accumulation of the bubbles in the outflow leads to an increase in the Taylor vortices.
For Re≥1000 and bubbles of size 0.12d or for Re≥10000 and bubbles of size 0.05d, the viscous torque applied on the inner cylinder is increased. This torque augmentation seems to be associated to bubbles trapping in the Taylor vortices near the outflow region or to bubbles accumulation in the outflow region near the inner cylinder, leading to a global attenuation of the liquid coherent motion, particularly the outflow motion.
For Re≤6000 and bubbles of size 0.05d, a small decrease in the viscous torque applied on the inner cylinder is suspected. It is associated to a bubble capture in the Taylor vortices near the inflow or to bubble sliding in a spiral arrangement. Thus, the dimensionless parameter characteristic of drag increase or decrease is likely to be parameter C, which compares the axial velocity of the Taylor vortices and the
bubble upward velocity. An important value of C, representative of weak buoyancy effects, is expected to augment the viscous torque of the inner cylinder. In the present study a value of C≥0.6 induces an increase in the viscous torque, regardless the Reynolds number and the bubble size to gap width ratio.
These results must be considered as early indication of bubble interactions with the coherent motion and the viscous drag.
More measurements are required to characterize the liquid flow and a systematic characterization of the bubble dispersion, as a function of C, H and db+ should be carried out. Further investigations are still to be performed to compare 2D distribution of the void fraction with local void fraction measurements by optical probe.
In order to have a better insight into the mechanisms of interactions, it would be worth characterizing the intermediate regime where drag reduction is suspected to changes into drag increase (6000≤Re≤10000).
The observed decrease in the viscous torque was very small. Indeed, the void fraction was limited a lot to enable bubble tracking but it would be interesting to increase the number of needles in order to enhance observed modifications and support the conclusions.
Acknowledgements
We express our gratitude for the scientific support service of IRENav (SEFER) and also to S. Cazin of IMFT for experimental assistance and advice.
References
Chouippe A. Numerical study of drag reduction by bubble injection in a Taylor Couette flow. PHD, Polytechnic national Institute from Toulouse (2012)
Climent E., Simonnet M., Magnaudet J. Preferential accumulation of bubbles in Couette Taylor flow patterns. Physics of Fluids, Vol. 19, n° 083301 (2007)
Dong, S. Herringbone streaks in Taylor Couette turbulence. Phys. Rev. E., Vol. 77, n° 035301(R ) (2008)
Mehel A. Experimental study of a two-phase Taylor Couette flow. PHD, Ecole centrale of Nantes and University of Nantes (2006b)
Mehel A., Gabillet C., Djeridi H. Bubble Effect on the structures of Weakly Turbulent Couette Taylor Flow. J. Fluid Eng., Vol. 128 Issue 4, 819-831 (2006)
Mehel, A., Gabillet, C. & Djeridi, H. Analysis of the flow pattern modifications in a bubbly Couette-Taylor flow. Physics of Fluids, Vol. 19, n° 118101 (2007)
Mei R., Klausner J & C. J. A note on the history force on a spherical bubble at finite Reynolds number. Physics of Fluids A, Vol. 6, issue 1, 418-420 (1994)
Murai, Y., Oiwa, H. & Takeda, Y. Frictional drag reduction in bubbly Couette-Taylor flow. Physics of Fluids, Vol. 20, n° 034101 (2008)
Nino Y., Garcia M.H. Experiments on particle-turbulence interactions in the near wall region of an open channel flow. J. Fluid Mech, Vol. 326, 285-319 (1996)
Sugiyama, K., Calzavarini, E. & Lohse, D. Microbubbly drag reduction in Taylor-Couette flow in the wavy vortex regime. J. Fluid Mech, Vol. 608, 21-41 (2008)
Van den Berg, T., Luther, S., Lathrop, D. & Lohse, D. Drag reduction in Bubbly Taylor-Couette Turbulence. Phys. Rev. Lett., Vol. 94, n° 044501 (2005)
Van den Berg, T., Van Gils, S., D.P.M., Lathrop, D. & Lohse, D. Bubbly turbulent drag reduction is a boundary layer effect. Phys. Rev. Lett., vol. 98, n° 084501 (2007)
Van Gils, D., Bruggert, G., Lathrop, D., Sun, C. & Lohse, D. The Twente Turbulent Taylor-Couette (T3C) facility: Strongly turbulent (multiphase) flow between two independently rotating cylinders. Review of scientific instruments, vol. 82 (2011b)
Van Gils, D. Highly Turbulent Taylor-Couette flow. PHD, University of Twente (2011a)
Wendt, F. Turbulente Stromungen zwischen zwei rotierenden konaxialen Zylindern. Ingenieur Archiv. 31 (1933)