Quantitative analysis of left-censored concentration data in
environmental site characterization
By
Niloofar SHOARI
MANUSCRIPT-BASED THESIS PRESENTED TO ÉCOLE DE
TECHNOLOGIE SUPÉRIEURE IN PARTIAL FULFILLMENT FOR THE
DEGREE OF DOCTOR OF PHILOSOPHY
Ph.D.
MONTRÉAL, NOVEMBRE 22, 2016
ÉCOLE DE TECHNOLOGIE SUPÉRIEURE
UNIVERSITÉ DU QUÉBEC
This Creative Commons licence allows readers to download this work and share it with others as long as the author is credited. The content of this work can’t be modified in any way or used commercially.
BOARD OF EXAMINERS
THIS THESIS HAS BEEN EVALUATED BY THE FOLLOWING BOARD OF EXAMINERS
Jean-Sébastien Dubé, Thesis Supervisor
Department of Construction Engineering, École de technologie supérieure
Michel Rioux, President of the Board of Examiners
Department of Automated Manufacturing Engineering, École de technologie supérieure
François Brissette, Member of the jury
Department of Construction Engineering, École de technologie supérieure
Yannic A. Éthier, Member of the jury
Department of Construction Engineering, École de technologie supérieure
Nildari Basu, External Evaluator
Department of Natural Resource Sciences, McGill University
THIS THESIS WAS PRESENTED AND DEFENDED
IN THE PRESENCE OF A BOARD OF EXAMINERS AND PUBLIC ON NOVEMBRE 2, 2016
ACKNOWLEDGMENT
This dissertation would not have been possible were it not for the continuous encouragement, support of many individuals. First, I would specially like to thank my advisor, Prof. Jean-Sébestien Dubé, for his guidance, encouragement, and flexibility that allowed me to pursue my own ideas throughout this research. I am so grateful to be accepted in his group. I would also like to acknowledge my PhD Committee members: Prof. Yannic Ethier, Prof. Francois Brissette, Prof. Michel Rioux, and Prof. Nildari Basu for their valuable time in reviewing my thesis. I must thank Prof. Gabriel Lefebvre, Director of the Department of Construction Engineering, and Me Louis Marquis, the Secretary General, for their invaluable support and great understanding.
I owe an enormous debt of gratitude to Prof. Shoja’eddin Chenouri who hosted me at the University of Waterloo and gave me guidance and expert advice on statistical aspects of this dissertation. Many thanks go to Prof. Mohsen Pourahmadi who provided great support and advice during my visit at Texas A&M University. Thanks are also due to my dear friend, Mirela, for her positive attitude, wise words, and encouragements. She brought fun into the lab.
My heartfelt thanks are extended to my mother and brother and in particular my late father for their inestimable support and love. Finally, I would like to thank my husband, Shahram, for his endless love and support, and for giving me the confidence in my abilities to do anything that I set my mind to. No words can express how lucky I am to have you in my life.
L’ANALYSE QUANTITATIVE DES DONNÉES DE CONCENTRATIONS CENSURÉES EN CARACTÉRISATION ENVIRONNEMENTALE
DES SITES CONTAMINÉS Niloofar SHOARI
RÉSUMÉ
L’analyse statistique de concentrations des contaminants dans les sols, l’eau et l’air constitue une composante essentielle de la caractérisation des sites contaminés. Ce type d’analyse présente des défis attribuables à la présence d'observations non détectées ou censurées à gauche relatives à des mesures inférieures à une limite de détection. Il est nécessaire de prendre en compte les valeurs censurées dans un ensemble de mesures de concentrations parce qu'elles n'impliquent pas l'absence de contamination, mais le manque de précision des instruments de mesure. En effet, des traces de polluants dangereux peuvent constituer des risques pour la santé humaine et l'environnement. Même si une étude environnementale permet de fournir un échantillon représentatif de données de concentration conformément à des protocoles analytiques bien conçus et à des procédures de validation des données, des analyses statistiques inadéquates ne prenant pas en compte correctement les observations censurées peuvent ne pas refléter l'état réel du site. Manifestement, des mesures de réhabilitation basées sur une image faussée des conditions de contamination pourraient être inefficaces et non durable écologiquement et économiquement.
L'objectif principal de cette recherche vise à examiner en détail l’influence des concentrations non détectées sur les décisions découlant des études de caractérisation des sols contaminés. À cette fin, nous explorons différentes méthodes statistiques (i) pour estimer les statistiques descriptives (ii), pour quantifier l'incertitude sur les estimés, et (iii) pour analyser les éventuelles dépendances liées aux observations groupées, lesquelles peuvent être inhérentes aux techniques d'échantillonnage. Le remplacement de valeurs censurées par une constante choisie de façon arbitraire est une pratique courante tant chez les spécialistes que chez les chercheurs. En revanche, il existe un certain nombre de méthodes paramétriques et non paramétriques permettant de tirer des déductions à partir des données censurées et, par conséquent, offrir un aperçu plus exact du problème. Les méthodes paramétriques, comprenant les procédures basées sur le maximum de vraisemblance et la régression, évaluent les statistiques descriptives grâce à l'ajustement d'une distribution paramétrique aux données. Étant donnée l’asymétrie à droite des données de concentration, les distributions gamma, Weibull et log-normale constituent les modèles paramétriques les plus plausibles, ce dernier type étant le plus souvent utilisé dans les études environnementales. Les procédures non paramétriques telles que la méthode Kaplan-Meier, cependant, ne nécessitent aucune hypothèse de distribution.
La présente étude utilise un exercice exhaustif de simulations des données, où le type de distribution sous-jacent est connu, afin d’évaluer la performance des estimateurs paramétriques et non paramétriques. Les simulations comprennent un grand nombre de scénarios avec différents pourcentages de censure, tailles d’échantillons de données et degrés
VIII
d’asymétrie des données. Cette recherche met également en évidence l'importance d'examiner la robustesse des méthodes paramétriques contre une mauvaise spécification du modèle de distribution. En utilisant les données simulées, nous élucidons comment la substitution des valeurs censurées fausse les estimations et pourquoi cette approche devrait être écartée, même quand il s'agit de données où le pourcentage de censure est limité. Nous avons découvert que la méthode du maximum de vraisemblance reposant sur l'hypothèse de la loi log-normale est hautement sensible à l'asymétrie des données, à la taille de l'échantillonnage et au pourcentage des valeurs censurées. Alors que la méthode de maximum vraisemblance basée sur la distribution log-normale est principalement utilisée dans les études environnementales, notre avons constaté qu'il faut faire preuve de prudence en supposant une distribution log-normale. Nous recommandons plutôt l'estimateur du maximum de vraisemblance reposant sur une distribution gamma, ainsi que des méthodes fondées sur la régression (utilisant un modèle log-normal ou gamma) et la technique Kaplan-Meier. En ce qui concerne les incertitudes sur les estimations relatives aux données réelles de concentration, pour lesquelles la vraie structure des données est inconnue, nous évaluons la performance des estimateurs paramétriques et non paramétriques en employant une technique de «bootstrapping». Les conclusions tirées du bootstrapping de données réelles sont conformes avec celles déduites à partir des données simulées.
Une partie importante de cette recherche porte sur la présence d'une corrélation entre les concentrations, en lien avec des techniques d'échantillonnage. Nous fournissons un fondement statistique et conceptuel ainsi que les raisons d'appliquer des modèles à effets mixtes capables d'accommoder la dépendance entre les données tout en tenant compte des observations censurées. Les méthodes statistiques habituelles tiennent pour acquis que les échantillonnages de données de concentration sont indépendants. Cependant, dans les études de la caractérisation environnementale de sites, cette supposition sera probablement contredite parce que les observations de concentration obtenues, par exemple, du même trou de forage pourraient être corrélées. Cela peut ensuite affecter les procédures de détermination de nombre d’échantillons de sol. Ainsi, nous avons eu recours à des modèles à effets mixtes pour capturer d'éventuelles dépendances dans les données ainsi que la variabilité entre groupes. La pertinence de l'estimé de la variabilité inter-forage est attestée par la détermination du nombre optimal de trous de forage de même que d'échantillons devant être prélevées à chaque trou de forage. Le modèle à effets mixtes que nous proposons fournit un aperçu de l'étendue verticale de la contamination, ce qui peut être utile pour concevoir des stratégies d'assainissement.
Les conclusions de cette recherche doctorale aident à accroître la sensibilisation à l'importance des observations censurées auprès de la communauté scientifique, des professionnels de l’environnement, ainsi que des décideurs politiques. Cette thèse constitue une contribution à la littérature en améliorant notre compréhension des aspects comparatifs des diverses méthodes statistiques dans le contexte des études de caractérisation de sites ainsi qu’en proposant une uniformisation des recommandations concernant l’utilisation de ces méthodes. Elle s'annonce, par conséquent, très prometteuse en tant que ligne directrices à suivre pour les chercheurs, les spécialistes et les décideurs.
IX
Mots-clés: observations censurées à gauche, caractérisation de sites, estimation du maximum de vraisemblance, régression sur les statistiques d’ordre, Kaplan-Meier, modèles à effets mixtes
QUANTITATIVE ANALYSIS OF LEFT-CENSORED CONCENTRATION DATA IN ENVIRONMENTAL SITE CHARACTERIZATION
Niloofar SHOARI ABSTRACT
A key component of site characterization is the statistical analysis of contaminant concentrations in soil, water and air samples. Such analysis can pose challenges due to the presence of nondetects or left-censored observations, which are measurements smaller than a detection limit. Censored values should be accounted for because they do not imply the absence of contamination, but the insufficient accuracy of the measuring instruments. Indeed, trace levels of hazardous pollutants can pose risks to the human health and the environment. Even if an environmental investigation achieves a representative sample of concentration data according to sound analytical protocols and data validation procedures, improper statistical analyses that do not properly accommodate censored observations may not represent actual site conditions. Obviously, remedial designs based on a distorted view of the contamination condition could be ineffective and not sustainable environmentally and economically.
The main goal of this research is to scrutinize the impact of left-censored values on site characterization outcomes. To this end, we explore different statistical methods (i) to estimate descriptive statistics, (ii) to quantify uncertainty around estimates, and (iii) to examine potential dependencies across observations due to clustering as an inherent part of sampling techniques. Substituting censored values with an arbitrarily selected constant is commonly practiced by both practitioners and researchers. In contrast, there are a number of parametric and non-parametric methods that can be used to draw inferences from censored data, and therefore, provide a more realistic insight into a contamination problem. Parametric methods, such as maximum likelihood and regression-based procedures, estimate descriptive statistics through fitting a parametric distribution to data. Due to the right-skewed shape of concentration data, gamma, Weibull, and lognormal distributions are the most plausible parametric models, with the latter being the most commonly used in environmental studies. Non-parametric procedures such as the Kaplan-Meier method, however, do not require any distributional assumption.
This study employs a comprehensive data simulation exercise, in which the true underlying distribution is known, to evaluate the performance of parametric and non-parametric estimators based on a large number of scenarios differing in censoring percent, sample size, and data skewness. This research also highlights the importance of investigating the robustness of parametric methods against model misspecifications. Using simulated data, we elucidate how substituting censored observations provides biased estimates and why it should be avoided even for data with a small percentage of censoring. We found that the maximum likelihood method based on the lognormality assumption is highly sensitive to data skewness, sample size, and censoring percentage. While the lognormal maximum likelihood method is mainly used in environmental studies, our findings point out that caution should be exercised
XII
in assuming a lognormal density distribution of data. Instead, we recommend the maximum likelihood estimator based on a gamma distribution, regression-based methods (using either a lognormal or gamma distribution), and the Kaplan-Meier technique. With respect to quantifying the uncertainty around estimates for real concentration data, in which the true structure of data is unknown, we evaluate the performance of parametric and non-parametric estimators employing a bootstrapping technique. The conclusions drawn from bootstrapping of real data are in accordance with those inferred from the simulated data.
An important part of this research investigates the presence of correlation, associated with sampling techniques, among concentration observations. We provide statistical and conceptual backgrounds as well as motivations for mixed effects models that are able to accommodate dependence across data points while accounting for censored observations. Standard statistical methods assume that samples of concentration data are independent. However, in environmental site characterization studies, this assumption is likely to be violated because concentration observations collected, for example, from the same borehole are presumably correlated. This can in turn affect sample size determination procedures. We therefore employ a mixed effects model to capture potential dependencies and between group variability in data. The relevance of the estimated between-borehole variability is explained in terms of determining the optimal number of boreholes as well as samples to be collected from each borehole. Our proposed mixed effects model also provides insights into the vertical extent of contamination that can be useful in designing remediation strategies.
The findings of this doctoral research help increase the awareness of the scientific community as well as practitioners, exposure assessors, and policy-makers about the importance of censored observations. Aiming at unification of the field, this thesis contributes to literature by improving our understanding of the comparative aspects of different statistical methods in the context of site characterization studies. It thus offers considerable promise as a guideline to researchers, practitioners, and decision-makers.
Keywords: left-censored observations, site characterization, maximum likelihood estimation, regression on order statistics, Kaplan-Meier, mixed effects model
TABLE OF CONTENTS
Page
INTRODUCTION ...1
CHAPTER 1 RESEARCH FOCUS AND OBJECTIVES...7
1.1 Objectives ...7
1.2 Synopsis ...7
1.2.1 Evaluating the performance of different estimators based on simulated censored data (Chapters 3&4) ... 7
1.2.2 Quantifying uncertainty of different estimators through bootstrapping (Chapter 5) ... 10
1.2.3 Accounting for dependence in data in presence of left-censored concentrations (Chapter 6) ... 11
1.2.4 List of manuscripts ... 12
CHAPTER 2 LITERATURE REVIEW ...15
2.1 Parameter estimation of left-censored data ...15
2.1.1 Current norms of environmental agencies on censored data ... 24
2.2 Modeling of concentration data containing left-censored observations ...29
CHAPTER 3 ESTIMATING THE MEAN AND STANDARD DEVIATION OF ENVIRONMENTAL DATA WITH BELOW DETECTION LIMIT OBSERVATIONS: CONSIDERING HIGHLY SKEWED DATA AND MODEL MISSPECIFICATION ...33
3.1 Abstract ...33
3.2 Introduction ...34
3.3 Estimation techniques ...37
3.4 Demonstration of the problem ...39
3.5 Methodology ...42
3.6 Results ...44
3.6.1 The impact of skewness ... 46
3.6.2 The impact of the percentage of censoring and sample size ... 47
3.6.3 The impact of distributional misspecification ... 51
3.7 Summary and conclusions ...55
CHAPTER 4 ON THE USE OF THE SUBSTITUTION METHOD IN LEFT-CENSORED ENVIRONMENTAL DATA ...57
4.1 Abstract ...57
4.2 Introduction ...58
4.3 Alternative methods for handling left-censored data ...59
4.4 Methodology ...61
4.5 Results and discussions ...63
XIV
4.5.2 Data from Weibull and gamma distribution ... 68
4.6 Why not substituted even for small censoring percent? ...69
4.7 Summary and conclusions ...70
CHAPTER 5 AN INVESTIGATION OF THE IMPACT OF LEFT-CENSORED SOIL CONTAMINATION DATA ON THE UNCERTAINTY OF DESCRIPTIVE STATISTICAL PARAMETERS ...73
5.1 Abstract ...73
5.2 Introduction ...74
5.3 Case study ...76
5.4 Methodology ...78
5.4.1 Bootstrap approximated bias and confidence interval ... 79
5.5 Results ...81
5.5.1 Uncertainty and approximated bias of the estimates ... 81
5.5.2 Impact of sample size on the uncertainty and approximated bias of the estimates ... 84
5.6 Uncertainty estimation of the mean of concentration data ...89
5.7 Conclusions ...92
CHAPTER 6 APPLICATION OF MIXED EFFECTS MODELS FOR CHARACTERIZING CONTAMINATED SITES ...93
6.1 Abstract ...93
6.2 Introduction ...94
6.3 Site and data description ...96
6.4 Methodology ...96
6.5 Results ...99
6.6 Implications for site characterization ...105
6.6.1 Compliance with a soil regulatory standard ... 105
6.6.2 Sample size determination ... 110
6.7 Conclusions ...112
CHAPTER 7 CONCLUSIONS AND RECOMMENDATIONS ...113
ORIGINALITY OF WORK ...119
APPENDIX I AN OVERVIEW OF STATISTICAL METHODS FOR LEFT-CENSORED DATA ...121
APPENDIX II ANDERSON-DARLING GOODNESS OF FIT TEST FOR LEFT-CENSORED ENVIRONMENTAL DATA ...135
APPENDIX III SUPPLEMENTARY MATERIAL OF ARTICLE 1 ...141
APPENDIX IV SUPPLEMENTARY MATERIAL OF ARTICLE 2 ...147
XV
APPENDIX VI SUPPLEMENTARY MATERIAL OF ARTICLE 4 ...173 LIST OF BIBLIOGRAPHICAL REFERENCES ...175
LIST OF TABLES
Page Table 1.1 An overview of the different parameters used in the simulation study ...9 Table 2.1 Summary of recommended methods for estimating the
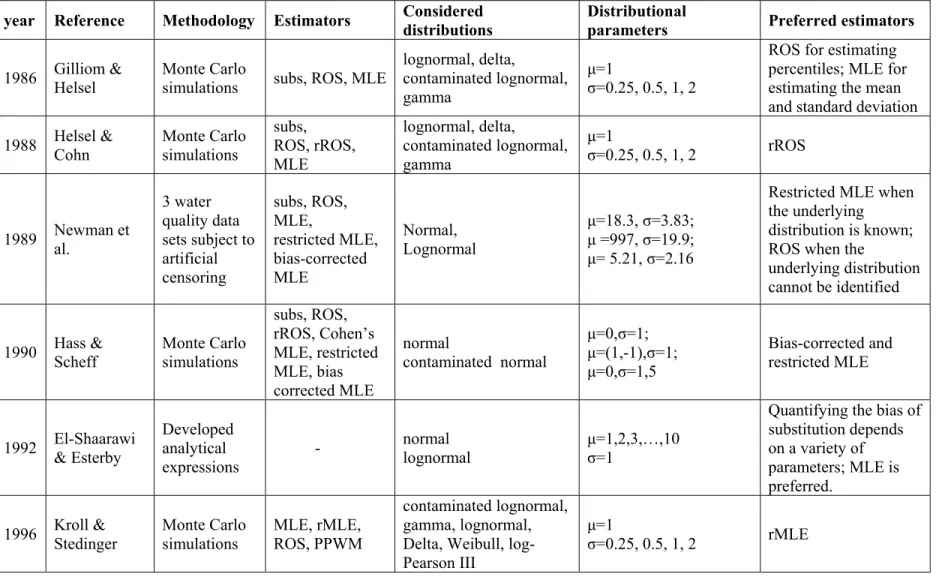
statistical parameters ...23 Table 2.2 Review of prior publications (in chronological order) on the
performance of estimators for left-censored data ...26 Table 3.1 The estimates of the mean and standard deviation of some
concentration data from a characterization study ...41 Table 3.2 Mean square error (MSE) in estimating the standard deviation for
lognormal data with 50% censoring ...49 Table 3.3 The MSE of the mean and standard deviation produced by rROS,
GROS and MLE under different distributional assumptions and model misspecification in scenarios with 50% censoring ...53 Table 4.1 Averaged percent reduction in the MSE of the substitution-based
method when the censoring percentage is reduced to 10% ...70 Table 5.1 The sample size and censoring percentage for each contaminant ...77 Table 5.2 The length of bootstrap confidence intervals for the mean and
standard deviation estimates obtained by different methods ...82 Table 5.3 Bias of the mean and standard deviation estimates obtained by
different methods ...83 Table 5.4 The estimate of the mean and its associated uncertainty (%) for
contaminant data when different estimators are useda ...91 Table 6.1 Linear regression versus mixed effects models when the material type
is considered as fixed effects ...100 Table 6.2 Linear versus mixed effects models when the depth category is
considered as fixed effects ...102 Table 6.3 Comparison of the 95UCL of the mean concentration (mg/kg) at
each depth category using conventional, simple linear and mixed effects models ...109
LIST OF FIGURES
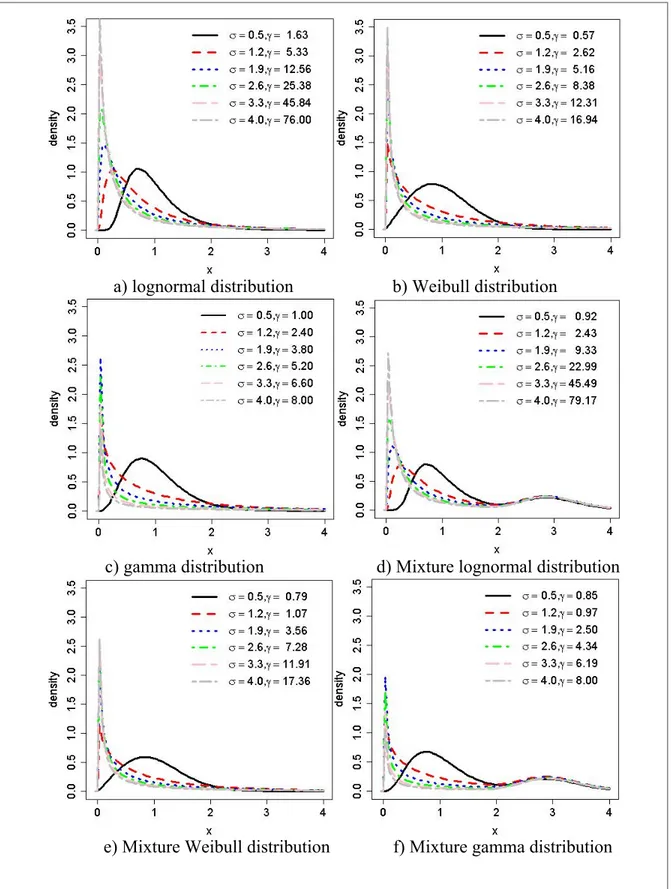
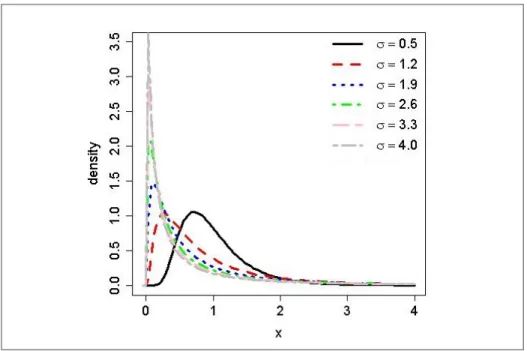
Page Figure 1.1 Manuscripts and their main findings...13 Figure 3.1 Density plots for different distributions with different degrees of
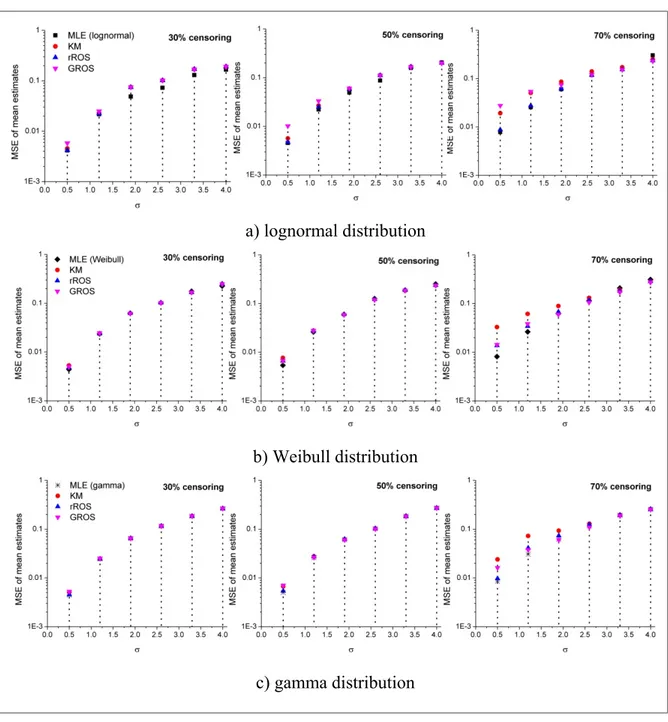
skewness reported in Table 3.1 ...43 Figure 3.2 The MSE of mean estimates obtained by several methods for = 1,
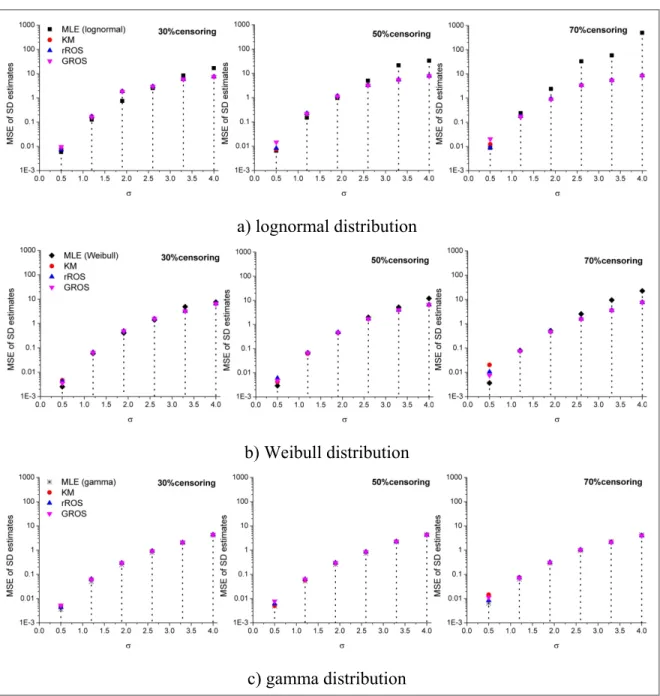
=0.5,1.2,1.9,2.6,3.3,4 ...45 Figure 3.3 The MSE of standard deviation estimates obtained by several methods
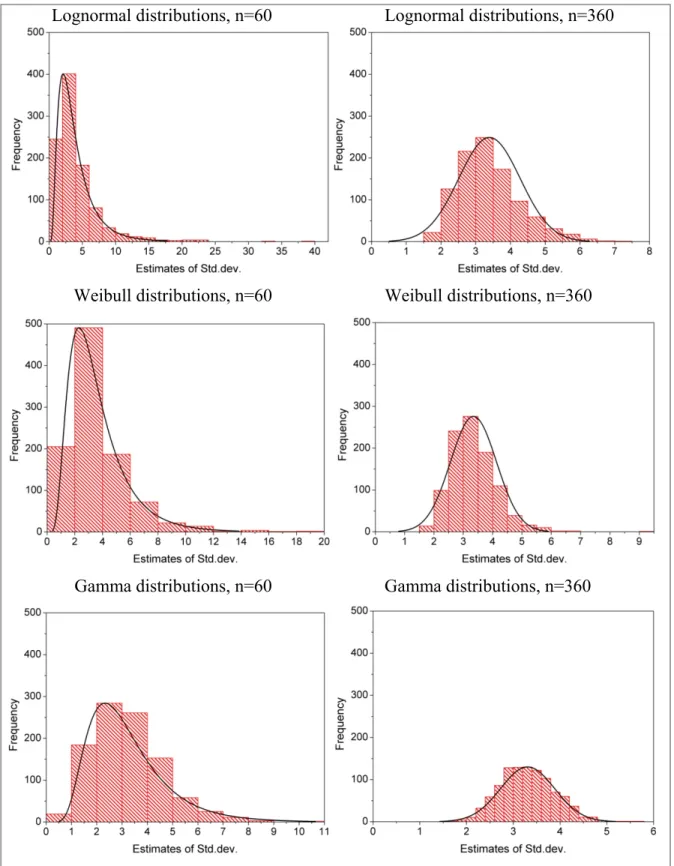
for = 1, =0.5,1.2,1.9,2.6,3.3,4 ...46 Figure 3.4 Histogram of the standard deviation of lognormal, Weibull, and
gamma distributions with =3.3 ...50 Figure 4.1 The shape of lognormal distribution for µ=1 and different σ values
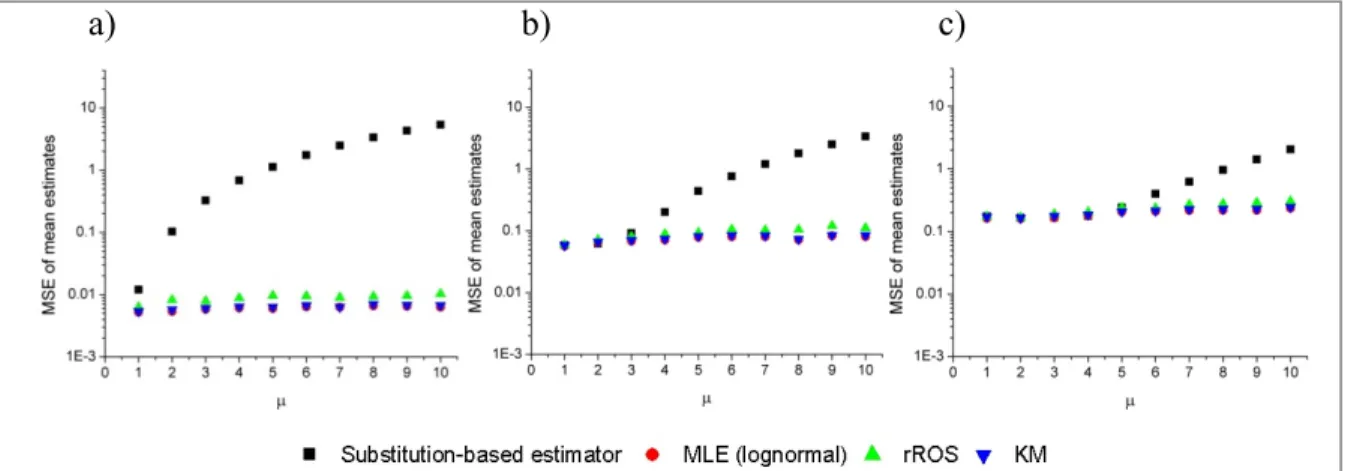
corresponding to CV=0.5, 1.2, 1.9, 2.6, 3.3, 4 ...62 Figure 4.2 The MSEs of different methods in estimating the mean of lognormal
distribution with μ=1,2,…,10 and a) σ=0.5, b) σ =1.9, c) σ=3.3 ...64 Figure 4.3 The MSEs of different methods in estimating the standard deviation
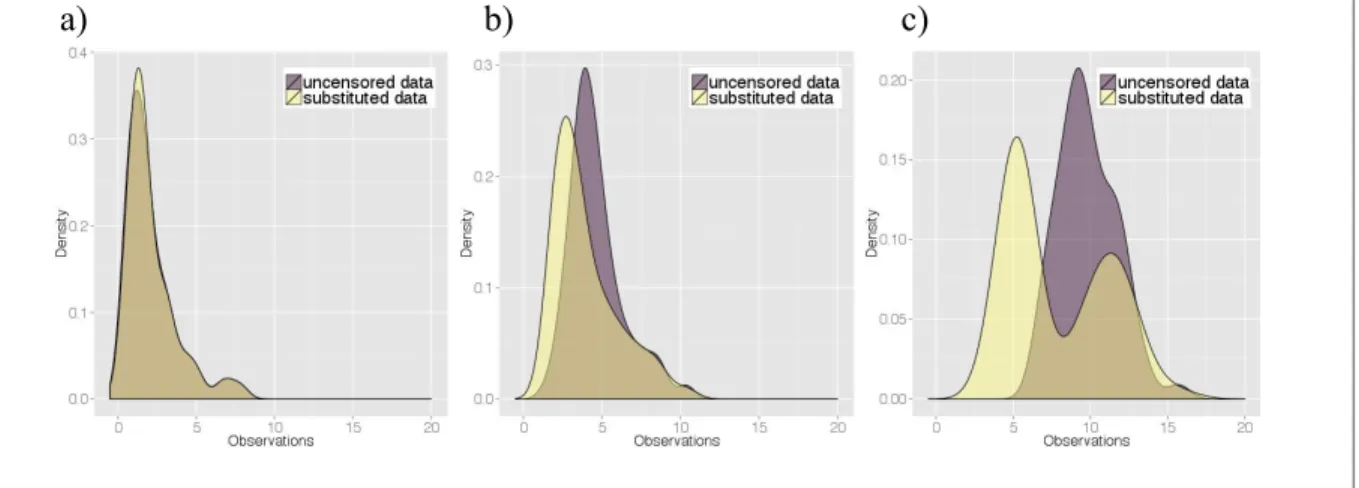
of lognormal distribution with μ=1,2,…,10 and a) σ=0.5, b) σ =1.9, c) σ=3.3 ...64 Figure 4.4 The distributions of original and substituted data generated from
lognormal distributions with σ=1.9 and different values a) = 2, b) = 5, and c) = 10 ...65 Figure 4.5 The Q-Q plots of substituted data generated from lognormal
distribution with σ=1.9 and different μ values a) = 2, b) = 5, and c) = 10 ...66 Figure 4.6 The MSEs of the substitution method in estimating a) the mean and
b) standard deviation for different combinations of μ and σ of
lognormal distribution ...67 Figure 4.7 The MSEs of the MLE method in estimating a) the mean and
b) standard deviation for different combinations of μ and σ of
XX
Figure 4.8 The MSEs of the substitution method in estimating a) the mean and b) standard deviation for different combinations of μ and σ of Weibull distribution ...69 Figure 4.9 The MSEs of the substitution method in estimating a) the mean and
b) standard deviation for different combinations of μ and σ of gamma distribution ...69 Figure 5.1 Bootstrap confidence interval lengths around the mean estimate of
a) chrysene, b) naphthalene, c) benzo(a)anthracene, and d) acenaphtene concentration data ...86 Figure 5.2 Bootstrap confidence interval lengths around the standard deviation
estimate of a) chrysene, b) naphthalene, c) benzo(a)anthracene, and d) acenaphtene concentration data ...87 Figure 5.3 Approximated bias of the mean estimate of a) chrysene, b) naphthalene,
c) benzo(a)anthracene, and d) acenaphtene concentration data ...88 Figure 5.4 Approximated bias of the standard deviation estimate of a) chrysene,
b) naphthalene, c) benzo(a)anthracene, and d) acenaphtene
concentration data ...89 Figure 6.1 Intra-borehole correlation for a) inorganic compounds and b) PAH
contaminants ...104 Figure 6.2 a) Boxplots of Pb concentrations for different materials and b) depth
categories; c) boxplots of Pb concentrations for different boreholes ...108 Figure 6.3 Standard error of IBC versus number of observations per borehole (N)
for IBC=0.39 and different number of boreholes (M) ...111 Figure 6.4 Standard error of IBC versus number of observations per borehole (N)
for M=150 boreholes and different IBC ...111 Figure 7.1 Recommended methods for estimating descriptive statistics of
LIST OF ABREVIATIONS 95UCL 95% Upper Confidence Level
AD Anderson-Darling
AIC Akaike Information Criterion BIC Bayesian Iinformation Criterion cdf Cumulative Distribution Function CvM Cramer-von Mises
DL Detection Limit
ECDF Empirical Cumulative Distribution Function-based EM Expectation Maximization
GM Geometric Mean
GROS Gamma Regression on Order Statistics GSD Geometric Standard Deviation
GTC Gestion des Terrains Contaminés HP Hollander and Proschan
IBC Intra-Borehole Correlation KM Kaplan-Meier
KS Kolmogorov-Smirnov LOB Limit Of Blank LOD Limit Of Detection LOQ Limit Of Quantification MGF Moment Generating Function
XXII
MLE Maximum Likelihood Estimation MLEs Maximum Likelihood Estimates MSE Mean Square Error
pdf Probability Density Function
PPWM Partial Probability Weighted Moments Q-Q Quantile-Quantile plot
RPRT Règlement sur la Protection et la Rehabilitation des Terrains rMLE robust Maximum Likelihood Estimation
ROS Regression on Order Statistics rROS robust Regression on Order Statistics Subs Substitution
INTRODUCTION
To date, the Federal Contaminated Sites Inventory has listed over 22,000 contaminated or suspected contaminated sites from which 2,393 are located in Quebec. According to Quebec contaminated sites inventory, Système de gestion des terrains contaminés (GTC), 8,334 sites had been registered in the system in 2010. These sites are not just in remote areas. In Montreal, for example, 1,617 sites have been identified (Hébert & Bernard, 2013). A sustainable revitalization of contaminated sites requires a comprehensive characterization followed by the adoption of appropriate remediation technologies. Within this context, the main goal of a site characterization study is to determine the type, concentration, location and extent of contamination. To this end, Quebec guidance on site characterization (Ministère du Développement durable, de l’Environnement, de la Faune et des Parcs du Québec, 2003a) recommends following the three steps below.
Phase I preliminary site characterization includes review of present and historical records, site visits, interviews, and identifying potential areas of contamination. If information obtained indicate any contamination evidence, phase II should be performed.
Phase II preliminary site characterization includes collection of field samples and analyzing them to confirm the nature as well as the horizontal and vertical extent of contamination.
Phase III exhaustive site characterization incorporates a series of actions for a more detailed characterization of a contaminated site if the result of phase II confirm the presence of pollution. These actions include further delineation of the impacted area, determining the volumes of contaminated material, and evaluating potential risks for human health and the environment.
Phase II and III always involve collection and chemical analysis of samples for contaminants concentrations. Given that the resultant concentration data sets are representative of site conditions, statistical analysis is used to decide whether or not the site is polluted and should undergo some remediation actions. Estimating descriptive statistics is the most important application of statistical analysis since they are employed in other statistical procedures;
2
some applications include quantifying the potential impact on human health and the environment, monitoring compliance with environmental standards, and devising/refining sampling strategy. Another important statistical analysis in site characterization can be the study of the association between contaminants and selected soil properties. Or, in the case that a human health risk assessment process is incorporated into the site characterization study, the relationship between the pollution and their adverse effects on health is of interest. Other more sophisticated applications of statistics include principal component analysis and identifying spatial and temporal patterns of contamination.
Even with technical advances in chemical analysis protocols and laboratory instrumentations, there remains a threshold below which contaminants concentrations are not precisely quantifiable. These concentrations are called left-censored (equivalently nondetects) and present a serious challenge in data analysis. The problem exacerbates when environmental scientists substitute censored observations with arbitrary constants before carrying out any statistical analysis. Helsel (2006) refers to substitution of nondetects as a “data fabrication” method because those measurements that are considered as highly unreliable are then treated as actually observed values. This approach diminishes data representativeness and provides biased results, potentially compromising human health and the environment and causing financial losses. However, substitution of censored values is commonly practiced because, as said by Helsel (2010a), “there is an incredibly strong pull for doing something simple and cheap.”
Alternatively, researchers have exploited methodologies from survival analysis, which were originally developed for right-censored medical data. From the estimation point of view, the alternative methods to deal with left-censored data fall into two categories:
a) Parametric methods that fit a distribution to data through maximum likelihood or probability plotting. The estimates obtained from the maximum likelihood method (MLE) are those that maximize a likelihood function, which is a product of the probability density function (pdf) when an observation is detected and the cumulative distribution function (cdf) when an observation is censored. On the other hand, the
3
most popular probability plotting-based method is the regression on order statistics (ROS) which involves fitting a regression line to data on a probability plot. A novel extension of the ROS technique is based on a gamma assumption and is called gamma regression on order statistics (GROS). In the case that one of the above parametric methods is used to impute values for censored observations, the robust versions of MLE and ROS (rMLE and rROS, respectively) are obtained. Since the statistical distribution of concentration data is typically right-skewed, a lognormal distribution is often fitted to data. However, other similar distributions (such as Weibull and gamma) are occasionally encountered;
b) Non-parametric methods such as Kaplan-Meier (KM), which does not require any distributional assumption and uses only data ranks.
A number of simulation studies have been devised to assess the merits of these alternatives to substitution, but their sometimes contradictory conclusions still rule out recommending a single method as the preferred approach. This is the main reason for which nondetects are still substituted with arbitrary constants despite the fact that numerous publications provide recommendations against it. The findings of this doctoral research help increase the awareness of the scientific community as well as practitioners, exposure assessors, and policy-makers about the importance and benefits of considering censored data as such in quantitative analysis. Using data simulations and real data analysis, this thesis investigates the impact of left-censored values on different aspects of contaminated sites characterization. In particular, the focus has been on appropriate strategies to (i) estimate descriptive statistics and associated uncertainty, and (ii) to model dependency in concentration observations coming from the same borehole. Overall, this thesis illustrates best practices to handle left-censored concentration data that should be incorporated in the environmental policies and procedures toward a sustainable characterization of contaminated sites.
4
Characterization data with left-censored observations
Before proceeding with a detailed discussion on the impact of left-censored data, we define three key relevant terms: limit of blank (LOB), limit of detection (LOD), and limit of quantification (LOQ). This terminology is adopted from the Clinical and Laboratory Standard Institute (2004). The LOB is the highest expected concentration of a chemical when replicates of a blank sample are measured. The LOD is the minimum concentration of a chemical that can be distinguished from the absence of the chemical with a stated confidence limit. The LOD is estimated by preparing and analyzing a series of blank samples and using the mean and standard deviation of the replicates with some confidence factor. Instead of the LOD, some laboratories use the LOQ to report their analysis results. The LOQ is the lowest concentration at which the chemical can be reliably quantified. Throughout this thesis, we use the general term detection limit (DL) to refer to LOD or LOQ. Those concentration measurements below the DL are called left-censored or nondetects.
Two types of censoring are encountered: in type I censoring, which is the typical situation of environmental data, the censoring point is known (this is the DL in chemical analytical practice) and the number of censored data is random. In type II censoring, on the other hand, the number of censored observations is fixed in advance and the censoring point is a random variable. Type II censoring typically occurs in life-testing and reliability investigations.
Significance of left-censored data
Although a left-censored observation does not report an exact value of a chemical concentration, it still contains the information that the measurement falls somewhere between zero and DL. Considering the efforts and expenses dedicated to environmental data collection and analysis, it seems worthwhile to investigate more sophisticated statistical methods in order to extract the maximum amount of reliable information from left-censored data. It is crucial to acknowledge that left-censored concentrations do not necessarily insinuate the absence of contamination; rather they indicate that the precision of the
5
analytical instrument was too low to reliably quantify a concentration value. The importance of accounting for left-censored concentrations is highlighted when dealing with historical concentration data, where analytical instruments were still less powerful and DLs were higher. In addition, in the case of highly toxic contaminants such as dioxins and arsenic, even trace levels may pose risks to human health and the environment.
A wide range of management decisions can also be affected by left-censored data. In environmental studies, left-censored data impact not only the estimation of statistical parameters, but also the characterization of data distributions, inferential statistics (e.g., comparing the mean of two or more populations) (Finkelstein, 2008; Antweiler, 2015), the determination of correlation coefficients, the construction of regression models (Lynn, 2001; Schisterman, Vexler, Whitcomb & Liu, 2006). In addition to the environmental sciences, handling left-censored data has been a challenge in astronomy (Feigelson & Babu, 2012), occupational health (Succop, Clark, Chen & Galke, 2004; Hewett & Ganser, 2007), and food health (European Food Safety Authority, 2010).
CHAPTER 1
RESEARCH FOCUS AND OBJECTIVES 1.1 Objectives
The main objective of this PhD thesis is to address the issues associated with the presence of left-censored concentrations, which is a pervasive problem in environmental research. Within the context of characterization of contaminated soils, the specific objectives focus on two important aspects of statistical inferences. The first aspect is to identify appropriate strategies for estimating descriptive statistics of a soil population; these estimates are employed in decision-making process (e.g., compliance with a regulatory standard) or in improving the precision of a characterization study (e.g., determining the sample size). The second aspect highlights the importance of accounting for dependency among concentration observations while left-censored values are accommodated. Statistical analyses throughout this dissertation focus on quantifying the bias resulting from the substitution of left-censored observations with arbitrary constants. As substituting is a common approach to deal with left-censored concentration data among practitioners and researchers, we are interested in understanding and comparing the consequences of a characterization study when the substitution or alternative techniques are employed.
1.2 Synopsis
1.2.1 Evaluating the performance of different estimators based on simulated censored data (Chapters 3&4)
Despite proliferation of simulation studies that compare different statistical methods for analyzing censored data, yet there is a need for further investigations because of the following concerns:
8
a) Most previous simulation studies overlooked exploring the impact of data distribution skewness on the performance of the estimators under study. Indeed, failing to accounting for a wide range of data skewness might have led to the lack of general agreement between different studies. In fact, as mentioned by Singh, Maichle & Lee (2006), simulation results derived for low skewed data cannot be generalized for highly skewed data;
b) In previous simulations, artificial data were mainly generated from normal and lognormal distributions; and consequently, the parametric estimation methods (e.g., MLE) relied on these distributions. Given that no theoretical study supports the assumption that environmental concentration data are normally or lognormally distributed, there is a need for a comprehensive simulation framework that encompasses other distributions and explores the robustness of estimators against distribution misspecifications;
c) Previous simulation studies discouraged the substitution of censored values due to the lack of a theoretical basis. However, some of these studies report simulation scenarios where the performance of the substitution approach equals that of other alternative methods. Therefore, it is useful to understand reasons for which substitution may or may not result in biased estimates.
Given the above aspects, the main objective of chapter 3 is to investigate the properties of alternative statistical methods that can handle left-censored data. To this end, we design a comprehensive simulation study that compares the performance of the MLE, rROS, GROS, and KM estimators under different scenarios of percentage of censoring, sample size, and data skewness. In addition, this simulation study evaluates the robustness of the parametric methods (i.e., MLE, rROS, and GROS) to distributional misspecification. According to our simulations, the MLE method based on lognormal and Weibull distributions provides inflated estimates of the mean and standard deviation when data distribution is highly skewed and censoring percent is large. Relating to sample size, although current literature indicates that 50 observations are sufficient to guarantee reliable MLEs, our simulations show that more than 50 observations might be required in the case that the distribution is highly skewed.
Among other finding, this chapter demonstrates that the methods of MLE (using gamma assumption), rROS, GROS, and KM should be considered for estimating descriptive statistics
9
of censored environmental data sets because of their robustness against distributional assumptions, censoring percent, and skewness.
The simulation study reported in chapter 4 of this thesis discusses inherent problems associated with the substitution of censored observations, the most commonly practiced approach. We illustrate that the performance of the substitution approach varies according to the population’s distributional characteristics (such as coefficient of variation and skewness) that are unknown a priori. For the same reason, substitution of censored observations should be avoided even when the censoring percent is as low as 10%. For a general overview of the simulation framework used in chapters 3 and 4, Table 1.1 reports a summary of different parameters of the simulation study.
Table 1.1 An overview of the different parameters used in the simulation study
Data generating distributions
Lognormal Weibull Gamma Mixture lognormal Mixture Weibull Mixture gamma True values of the mean and standard
deviation = 1,2,3, … ,10 = 0.5, 1.2,1.9,2.6,3.3,4 Sample size 60, 120, 180, 240, 300, 360 Censoring percent 10%, 30%, 50%, 70% Statistical methods Substitution with DL/2
Maximum likelihood estimation (MLE) • Lognormal
• Gamma • Weibull
Robust regression on order statistics (rROS) Gamma regression on order statistics (GROS) Kaplan-Meier (KM)
10
1.2.2 Quantifying uncertainty of different estimators through bootstrapping (Chapter 5)
The results reported in chapter 4 showed that the substitution approach is not reliable for computing the mean and standard deviation of data when left-censored observations are encountered. With respect to alternative estimation techniques (i.e., MLE, rROS, GROS, and KM), some amount of uncertainty is always associated with the estimates. This uncertainty arises from the presence of left-censored concentrations as we do not have any knowledge regarding the true value of left-censored measurements.
We use a bootstrapping technique to provide uncertainty information along with the estimates of the mean and standard deviation obtained from the aforementioned alternative estimators. Unlike the analyses discussed in chapter 3 and 4 that were based on computer-generated data, the adopted methodology in chapter 5 allows making inferences based on real concentration data. Concentration data sets used in this research are from chemical analysis of soil samples collected for characterizing a brownfield site in Montreal, Canada.
We assume, as other bootstrapping applications, that the concentration data at hand is a representative sample of a soil population. The idea behind the bootstrapping is to take repeated draws with replacement from the actual concentration data and treat these draws (bootstrap samples) as possible random samples that could have been taken in the real world. Using the MLE, rROS, GROS, and KM estimators, we compute the statistics of interest (the mean and standard deviation in this thesis) for each bootstrap replicate. This yields an approximation to the distribution of the statistics provided by a given estimator that is used to calculate the uncertainty of that estimator in terms of confidence intervals. The abovementioned procedure is a non-parametric bootstrapping technique, which avoids making unnecessary assumptions about the distribution of concentration data.
The conclusions drawn from bootstrapping of real data are in accordance with those inferred from the simulated data. In general, the MLE method using the lognormal and Weibull distributional assumptions leads to the highest levels of uncertainty whereas the MLE under
11
gamma assumption, rROS, GROS, and KM produce less uncertainty. Moreover, the rROS, GROS, and KM estimators have small approximate biases. Calculating the mean and its 95% upper confidence level of real contaminant concentration data, we demonstrate that adopting an inappropriate statistical method results in imprecise estimates, which contribute to the global uncertainty in the outcomes.
1.2.3 Accounting for dependence in data in presence of left-censored concentrations (Chapter 6)
In this chapter we discuss that sampling strategies in environmental site characterizations result in concentration data with a nested structure. Under this aspect, observations are generated from different groupings in data, so that those nested in the same borehole may share similar traits. In fact, it is quite plausible to postulate that concentration measurements obtained from the same borehole are likely to be correlated due to some unmeasured known or unknown factors. Employing standard approaches, for which independence assumption is crucial, to analyze such data leads to unfounded conclusions. To tackle this issue, while accommodating left-censored observations, we propose a mixed effects model that accounts for data dependencies. It is thus possible to estimate between-borehole variability. In addition, we set the proposed model in a way that allows us to estimate the mean value of concentration of a given contaminant at different depths or type of material constituting the brownfield site.
A major implication of the adopted approach in the context of site characterization studies relates to determination of optimal sample size in terms of the number of required boreholes as well as the number of required samples per borehole. It should be highlighted that the current practice does not follow statistical approaches. Moreover, this chapter examines the vertical extent of contamination that can be useful in defining the remediation depth.
12
1.2.4 List of manuscripts
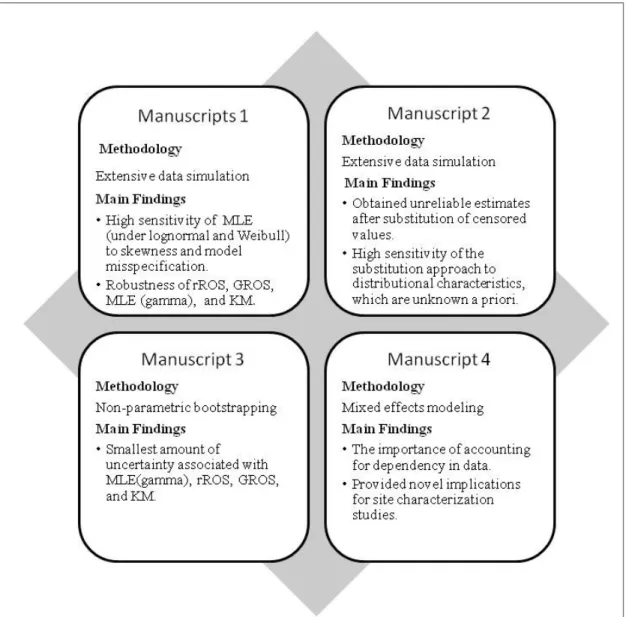
This dissertation includes 4 published manuscripts. Figure 1.1 presents the manuscripts and also their main findings. The manuscripts are listed as follows.
Manuscript (1): Shoari, Niloofar, Jean-Sebastien Dubé and Shoja'eddin Chenouri. (2015). Estimating the mean and standard deviation of environmental data with below detection limit observations: Considering highly skewed data and model misspecification. Chemosphere,
138, 599-608.
Manuscript (2): Shoari, Niloofar, Jean-Sébastien Dubé and Shoja'eddin Chenouri. (2016). On the use of the substitution method in left-censored environmental data. Human &
ecological risk assessment, 22 (2), 435-446.
Manuscript (3): Shoari, Niloofar and Jean-Sébastien Dubé, (2016). An investigation of the impact of left‐censored soil contamination data on the uncertainty of descriptive statistical parameters». Environmental Toxicology and Chemistry. 35 (10), 2623-2631.
Manuscript (4): Shoari, Niloofar and Jean-Sébastien Dubé, (2017). Application of mixed effects models for characterizing contaminated sites. Chemosphere. 166, 380-388.
13
CHAPTER 2 LITERATURE REVIEW
The literature review of this thesis provides an overview of statistical methods that can be used for interpreting data containing left-censored observations. This chapter consists of two parts. The first part reviews publications that have focused on identifying appropriate strategies to accurately estimate the statistical parameters of left-censored data. The related concepts and mathematical formulations for different statistical methods are explained in Appendix I of the thesis. Moreover, major articles are organized in chronological order (Table 2.2) to provide a perspective on the developments over the past 30 years. In addition to parameter estimation, environmental studies may require performing regression analyses on censored data in order to investigate the relationship between a response variable (e.g., arsenic concentration in soil) and one or more explanatory variables (e.g., soil type). In this regard, the second part of the literature review gathers all studies that developed regression models while accounting for left-censored data.
2.1 Parameter estimation of left-censored data
Many publications use Monte Carlo experiments to explore and compare the performance of substitution with alternative estimators. Some relevant studies include Gilliom & Helsel (1986); Helsel & Cohn (1988); Newman, Dixon, Looney & Pinder (1989); She (1997); Singh & Nocerino (2002); Lubin et al. (2004), Hewett & Ganser (2007). All of the above studies share the same research design: Let θ be the true distributional parameter (e.g., mean or standard deviation) of the reference population, from which artificial data of size n were generated. Note that normal and lognormal distributions were typical in simulation studies. For a given censoring percentage, say c%, a censoring point was imposed at the cth percentile of the reference population. To be precise, for data sets generated from distribution ( , ), the censoring point was calculated as ( ; , ), where (. ) is the inverse cumulative distribution function. Within a set of simulations, substitution and alternative methods were
16
used to estimate , where was the estimated statistical parameter of the simulated data. To investigate and compare the ability of different estimators in reproducing the correct values for θ, bias and/or mean square error (MSE) were utilized as the comparison criteria. The common conclusion of the published literature was that substituting censored data introduced an estimation bias and it should be avoided.
El-Shaarawi & Esterby (1992) provided analytical expressions for quantifying the bias due to substitution of censored values. However, the application of these expressions is limited because (i) they are valid only for normally and lognormally distributed data; and (ii) they require knowledge about the proportion of censoring, mean, and variance, which are usually unknown. Helsel (2005, 2006, and 2010b) consistently emphasized the unreliability of substitution and discussed how it would provide poor estimates for different statistical analyses (i.e., the mean, standard deviation, t-value, correlation coefficient, regression slope, p-value, etc.). Nevertheless, substitution remains a common practice in environmental studies (e.g., Farnham, Singh, Stetzenbach & Johannesson, 2002; Krapac et al., 2002; Sapkota, Heidler & Halden, 2007; Schäfer, Paschke, Vrana, Mueller & Liess, 2008; Higley, 2010; Hsu, Guo, Wang, Liaoand & Liao, 2011; Jones, 2011; Vassura, Passarini, Ferroni, Bernardi & Morselli, 2011; Watkins et al., 2016).
A few studies suggested the use of substitution of censored observations. Hornung & Reed (1990) suggested the substitution method whenever less than 50% of data were nondetects. Clarke (1998) advocated substitution of a constant rather than the MLE and ROS methods when data sets were small (with less than 10 observations). The failure of the parametric methods might have been due to small sample size because distributional properties could not be accurately established with only a few observations. In a comparative Monte Carlo simulation study, She (1997) reported that the estimates obtained after substituting censored data with DL/2 were sometimes as good as those provided by the KM estimator. Also, Hewett & Ganser (2007) reported simulation scenarios where substitution was recognized as the estimation method of choice. Although some studies reported good agreement between
17
the substitution and alternative methods, Leith et al. (2010) cautioned that this behavior should not be interpreted as evidence of equivalency between these methods.
Rather than using the simplistic substitution technique, researchers developed parametric procedures that use the observed values in combination with the information contained in the censored part. The two main categories of parametric procedures are based on maximum likelihood and probability plotting. The maximum likelihood methods can be traced back to the work of Cohen (1959; 1961) who developed a version of MLE that relied on look-up tables to estimate statistical parameters of censored data. The Cohen’s MLE method has a drawback of being restricted to normally distributed data that contain a single DL, whereas concentration data are typically skewed and contain multiple DLs. Gilliom & Helsel (1986) considered estimating statistical parameters of singly censored (with only one DL) water quality data and conducted a comparative simulation study to compare the performance of substitution, MLE, and probability plotting procedures. Assuming that environmental data are lognormally distributed, their simulations suggested the MLE as the best estimator of different percentiles. However, the performance of the MLE method was not satisfactory for estimating the mean and standard deviation. Later, in a related study, Helsel & Cohn (1988) extended the work of Gilliom & Helsel (1986) and investigated the effect of the presence of multiple DLs on the performance of different estimators.
The MLE method for multiply censored and normally distributed data (or approximately normally distributed after log-transformation) was discussed by El-Shaarawi & Naderi (1991). Instead of using Cohen’s look-up tables, they developed likelihood functions needed to estimate the mean and standard deviation of data. To employ the MLE method under the normality assumption, Shumway, Azari & Kayhanian (2002) suggested using a Box-Cox transformation to generate approximately normal data. The first problem with transformation is the transformation bias, which occurs when the estimates are back-transformed to the original scale (Helsel, 1990). To resolve this issue, Shumway et al. (2002) employed the Quenouille-Tukey Jackknife to improve the quality of estimates and to compensate for the transformation bias. The second problem is the ambiguity as to which transformation (e.g.,
18
logarithmic, square root, inverse, and arcsine) should be used. While most previous simulation studies used the MLE with lognormal assumption for lognormal or contaminated lognormal data generating distributions, European Food Safety Authority (2010) demonstrated the adequacy of the MLE method under Weibull and gamma assumption when applied to lognormal data and vice versa.
Hewett & Ganser (2007) considered a comprehensive simulation study that aimed at identifying an “omnibus” method for estimating the mean and 95th percentile of exposure data sets containing nondetects. Their study incorporated several simulation scenarios using computer-generated data from lognormal and contaminated1 lognormal distributions with different censoring percentages. The estimation methods examined were substitution, several variations on the MLE and ROS, non-parametric quantile and KM. No single method showed superiority across all simulation scenarios although the MLE-based techniques generally performed well. However, their study did not address confidence intervals.
Despite numerous researchers tended to favor the MLE method, the results of some investigations (for instance, Lee & Helsel, 2007 and Jain & Wang, 2008) indicated the limited ability of this method when dealing with small data sets and large censoring percent. These investigations agreed that the MLE method may not show some of its desirable properties (consistency, efficiency, and asymptotic normality) for small data sets (with <50 uncensored values as reported in Helsel, 2005) with large amount of censoring (Helsel, 2012).
A parametric method based on probability plotting was discussed in Travis & Land (1990). This method assumes that observations (or log-transformed observations) below and above the DL are normally distributed. It fits a regression line on probability plot of data and the intercept and slope of this line provide the estimates of the mean and standard deviation,
19
respectively. Although censored observations are treated as unknown, their percentile values are accounted for. This method is commonly known as regression on order statistics (ROS).
An extension of the above mentioned fully parametric methods (i.e., MLE and ROS) are referred to as “imputation” or “robust” procedures, in the hope to have estimators that are both reliable and easier to implement. In these methods the observation above the DL are combined with imputed values for observation below the DL and thus standard statistical methods can be applied. The censored observations are imputed using some initial estimates obtained from MLE or ROS. Two popular examples include robust MLE (rMLE) proposed by Kroll & Stedinger (1996) and robust ROS (rROS) developed by Helsel & Cohn (1988). Hewett & Ganser (2007) discussed that the rMLE and rROS slightly outperform their fully parametric counterparts. For example, when dealing with small data sets or when data distribution does not exactly match the assumed distribution, the rROS approach outperforms the MLE. Specific applications of the rROS was reported by Baccarelli et al. (2005) to estimate mean levels of dioxin in marine water samples and by Röösli et al. (2008) to estimate the mean and different quantiles of radiofrequency measurements subject to censoring.
The advantages of robust procedures were reported in Huybrechts, Thas, Dewulfand & Van Langenhove (2002) where they identified two problems associated with fully parametric methods: First, the presence of outliers may falsify the lognormality assumption and may results in highly biased estimates. Secondly, even if data happens to be lognormally distributed, the estimates of the mean and standard deviation suffer from the back-transformation bias. They pointed out that robust parametric methods are not very sensitive to departures from the assumed distribution. Moreover, the censored observations are predicted and can be directly back-transformed to original scale avoiding the transformation bias.
In addition to the rROS and rMLE, the environmental literature reports other ad-hoc imputation techniques that are less frequently used. For data censored at DL, the imputed
20
values are generally conditional expected values of , given nondetects are smaller than DL, that is [ | < ]. Some relevant papers in this regard are listed below:
• Lynn (2001) developed an imputation technique based on maximum likelihood. The imputed values were random draws from a normal distribution whose parameters were maximum likelihood estimates (MLEs);
• Succop et al. (2004) employed the MLE method to derive initial estimates of the sample mean and standard deviation. These estimates were used to impute censored observations, which they called “the most provable value”;
• Lubin et al. (2004) carried out a multiple imputation procedure where Tobit regression followed by a non-parametric bootstrapping was used to estimate the mean and standard deviation of lognormally distributed data. These estimates were used to construct a lognormal distribution and the imputed values were random draws from that distribution. Comparing the performance of Lubin’s against Lynn’s imputation method, Jain et al. (2008) showed the superiority of the Lubin’s method for censoring percent larger than 20%;
• Aboueissa & Stoline (2004) proposed a new imputation technique that performed as well as the MLE method. Their method employed information regarding the number of observations below and above DL as well as the estimates of the mean and standard deviation of the uncensored part of the data. However, the application of their methodology is limited to low skewed normal and lognormal data subjected to a single DL with a censoring percent of less than 50%;
• Krishnamoorthy, Mallick and Mathew (2009) proposed a methodology valid for data that can be represented by a normal distribution. An appropriate transformation such as lognormal or cube root transformation may be necessary to be able to employ their technique. This imputation method uses initial estimates of the mean and standard deviation based on the uncensored data, with some adjustments to compensate for parameter overestimation since only above-DL values are considered. Through simulation studies and real data examples, the authors demonstrated that their imputation technique worked well for small to moderately large sample sizes;
21
• Ganser & Hewett (2010) proposed the β-substitution method which consists of substituting censored observations with a data-dependent β factor multiplied by the DL. They demonstrated that their proposed substitution technique performed equally well when compared to the MLE method, particularly in simulation scenarios with small sample sizes. They did not include KM when comparing the performance of their new method. To complement this study, Huynh et al. (2014) devised a simulation framework to evaluate the performance of β-substitution against its competitors, MLE and KM. They concluded that the β-substitution method performed as well as or better than MLE and KM methods for data from lognormal and contaminated lognormal distributions. When data contain multiple DLs, this methodology suffers from a drawback in that the average of DLs is considered in the algorithm as if the data had a single DL.
Another promising estimation method falls under the category of non-parametric techniques that do not require any parametric assumption about the data; all that matters is the relative rank of observations. As the distribution of left-censored concentration data is complex and often unknown, She (1997) favored the non-parametric KM estimator. For estimating the 95% upper confidence level (95UCL) of censored concentration data sets, the simulation study by Singh et al. (2006) considered the impact of censoring percent as well as the degree of skewness on the performance of different statistical methods. Overall, they advocated the KM estimator on the basis that parametric methods relying on lognormal distribution assumption resulted in unrealistically inflated estimates. Importantly, they noted that an estimation method may perform differently depending on whether data are low or highly skewed. Antweiler & Taylor (2008) questioned the reliability of research studies based on data generated from known distributions as it might have been caused the preference of parametric estimators. They used a more precise laboratory instrument and re-measured the contaminants concentrations of the samples that had previously provided censored data, making it possible to attribute a concentration value to censored measurements. This resulted in having two concentration data sets for each contaminant, one with censored observation and the other one without them. They applied the substitution (with zero, DL, and DL/2, a random number between zero and the DL), rROS, MLE (under normal and lognormal
22
assumption), and KM methods to estimate statistical parameters of data and compared these to the true values. They concluded that generally the KM method estimated the mean, standard deviation, 25th, 50th, and 75th percentiles with less error. The simulation results of European Food Safety Authority (2010) also suggested the KM method when the underlying distribution of data was not easily identified and particularly, the censoring percentage was lower than 50%. Some sample applications of KM can be found in Pajek, Kubala-Kukuś, Banaś, Braziewicz & Majewska (2004); Helsel (2010b); and Barghi, Choi, Kwon, Lee & Chang (2016). However, the KM method is not recommended for data sets with only one DL and whenever the smallest observation is a nondetect (Hewett & Ganser, 2007).
Despite attempts of researchers to encourage the use of alternative estimators, we still encounter studies that avoid using them. The computational complexity of implementing alternative estimators is often one of the hurdles. However, increasing availability of standard software programs has resolved this problem. For example, the computation of the MLE method through Microsoft Excel Solver Tool was made available by Finkelstein & Verma (2001). Flynn (2010) presented an estimation technique that was also simply implemented in an Excel worksheet and claimed that the mean and standard deviation estimates provided by their methodology were comparable to those obtained from the restricted MLE method. This methodology imputes censored values by maximizing the Shapiro-Wilk statistic such that a normal distribution is produced. The rough assumption of this estimation technique is that data or transformed data follow a normal distribution. In two companion papers by Lee & Helsel (2005; 2007), S-language software implementations for the rROS and KM methods are explained.
The second reason that prevents using the alternative estimators is the lack of clarity as to what is the best course of action to take in the presence of left-censored data. In an attempt to unify the opinions, Helsel (2012) reviewed several papers on the performance of various methods for estimating statistical parameters of data and gave a concise summary of the results as reported in Table 2.1.
23
Table 2.1 Summary of recommended methods for estimating the statistical parameters 2
Sample size
Censoring percent <50 observations >50 observations <50% Imputation or KM/Turnbull Imputation or KM/Turnbull 50%-80% rMLE, rROS, multiple imputation MLE, multiple imputation
>80% Report only % above a meaningful threshold May report high sample percentiles (90th, 95th)
In addition to employing appropriate estimation technique(s), it is crucial to identify adequate methods for constructing confidence intervals as these indicate the uncertainty in the estimates. However, the majority of the above-mentioned investigators did not address this issue. Assuming that data (or transformed data) follows a normal distribution, confidence intervals around the mean based on the Student’s t-statistic are computed as ( ̂ −
⁄ ,( ) ⁄ , ̂ + ( ⁄ ,() ) ⁄ ), where ̂ and may be computed using any of
the parametric estimators such as MLE or an extension of it. Singh et al. (2006) and Helsel (2012) discussed that these parametric intervals are highly sensitive to the normality assumption and if applied for skewed data sets, the estimated confidence intervals may be biased (and sometimes unrealistic, for example, in the case that negative lower confidence levels are estimated). Another shortcoming with this confidence interval is the lack of clarity about whether represents the total number of observations, or only the number of uncensored observations. Bootstrapping (Efron, 1981) is a compelling method for computing confidence limits around the statistic of interest (mean, median, percentile, etc.). This method consists of sampling with replacement from the original data for B times and calculating the statistic of interest for each draw. Doing so, one obtains B estimates of the statistic (for example, mean), which are used to describe the probability distribution of that statistic. This
24
probability distribution serves as a basis for calculating the confidence interval. Being a non-parametric technique, bootstrapping has the advantage of not relying on the normality assumption of data. Frey & Zhao (2004) fit lognormal, Weibull, and gamma distributions using MLE to estimate the mean concentration of censored urban air toxics data. They also employed the bootstrap method to calculate the uncertainty around the estimated mean. Their paper showed that the range of uncertainty increased with increasing censoring percent and coefficient of variation (coefficient of variation was used as an indicator of data variability), and on the other hand, decreased when sample size got larger. Singh et al. (2006) considered several estimation methods including Tiku’s method, Scheneider’s approximate UCL method, Student t-statistic, Land’s H-statistic, Chebyshev inequality, and different versions of bootstrapping to calculate the 95UCL of the mean. They concluded that the KM estimator followed by Chebyshev, student’s t-statistic, or bootstrap provided good estimates of 95UCL. A review of prior publications that evaluated the performance of different estimators is reported in chronological order, as illustrated in Table 2.2.
2.1.1 Current norms of environmental agencies on censored data
The guidelines issued by USEPA (2000) advocate substitution of censored data by half of the DL when less than 15% of data is censored. However, Helsel (2006) states that the 15% cut-off value is simply based on judgment rather than any peer-reviewed publication. If 15%-50% of data are censored, USEPA (2000) recommends using the MLE, trimmed, or winsorized mean and standard deviation. For data sets with more than 50% censoring, a percentile larger than the censoring percent can be used, instead of the mean value, to represent contamination level. This guideline cautions practitioners when using the MLE method for small data sets (n<20), as it may produce biased results. Although not discussed in details, this document gives some recommendations on which statistical parameter to use for different censoring percent and coefficient of variation. Noticeable is that after 6 years, another document issued by USEPA (2006) incorporates the same elements of the prior guidance on how to handle censored data. The Appendix of the Local Limits Development Guidance (USEPA, 2004) recognizes that substitution of censored data results in biased
25
estimates and encourages the use of rROS and MLE techniques. In a report published by Oak Ridge National Laboratory, Frome & Wambach (2005) recommends MLE as the first method of choice and KM when the data distribution is hard to identify.
Canadian Federal and provincial government documents related to site characterization are strongly based on the above-mentioned USEPA guidelines for handling left-censored data. Within the context of risk-based site characterization, the guidance document “human health detailed quantitative risk assessment” provided by Health Canada (2010) accepts substitution for low censoring amounts; however, no threshold for censoring percent is reported. In addition, this document recommends the rROS method for modest to large data sets and the MLE method only for large data sets without giving any indicative value about the sample size. Similarly, Canadian Council of Ministers of the Environment (2016) suggests the use of substitution as long as censoring percent is less than 10%. For higher censoring percent, this guidance recommends one of the MLE, rROS, or KM estimation techniques. Surprisingly, the problem of left-censoring has not been mentioned in “Guide de caractérisation des terrains” (Ministère du Développement durable, de l’Environnement, de la Faune et des Parcs du Québec, 2003a).