Science Arts & Métiers (SAM)
is an open access repository that collects the work of Arts et Métiers Institute of
Technology researchers and makes it freely available over the web where possible.
This is an author-deposited version published in:
https://sam.ensam.eu
Handle ID: .
http://hdl.handle.net/10985/8320
To cite this version :
Adeline MANUEL, Livio DE LUCA, Philippe VERON - A Hybrid Approach for the Semantic
Annotation of Spatially Oriented Images - International Journal of Heritage in the Digital Era - Vol.
3, n°2, p.305-320 - 2014
A Hybrid Approach for the
Semantic Annotation of
Spatially Oriented Images
Adeline Manuel
a,b, Livio De Luca
aand
Philippe Véron
baUMR CNRS/MCC 3495 MAP, Campus Joseph Aiguier Bât Z’,
31 chemin Joseph Aiguier, 13402, Marseille, France, (adeline.manuel; livio.deluca)@map.archi.fr
bUMR CNRS 7296 LSIS, Ecole Nationale Supérieure d’Arts et Métiers,
2 cours des Arts et Métiers, 13617, Aix-en-Provence, France, (adeline.manuel; philippe.veron)@ensam.eu
A Hybrid Approach for the Semantic
Annotation of Spatially Oriented
Images
Adeline Manuel, Livio De Luca and Philippe Véron
Abstract:
Thanks to recent developments, actual information technologies offer
tools for the access to information about cultural heritage buildings.
These tools are aimed to help experts to enrich and share information
about historic monuments. This article describes a hybrid process for
the semantic annotation of a set of spatially-oriented images (whose
positions and orientations in space are automatically estimated). First
of all, a large set of images is processed with an automated image
based reconstruction method so as to generate 3D information
(specifically 3D coordinates). This 3D information is then used in an
automated transfer process of annotations through the set of images.
At last, new images can be oriented within the set of already-oriented
and already-annotated images. Then, annotations can be precisely
projected on newly-oriented images. As a consequence, this process
provides a simple way to establish a continuity of information inside a
set of images.
1. Introduction
Nowadays in the field of conservation and documentation of cultural heritage, the actual development of information technologies offers new tools for managing large amount of data. These tools are aimed to provide a way to enrich and share information on historical buildings.
The digitization and 3D reconstruction methods have known significant progress in recent years and allow the production of a quite precise representation of a building starting from a laser scanner acquisition, images or videos [1]. Consequently, they have become a
privileged support for buildings’ documentation. However, mainly because of ergonomic limitations, these representations do not satisfy at all experts’ needs.
Among the various iconographic sources, photographs constitute an important value for architectural studies. These sources are very numerous and testify to the state of preservation of a building at a specific time. In particular thanks to the recent improvements in the digital imaging technologies, the production of huge amount of photographs is today easy and content-based methods have been developed for the clustering of images [2]. Furthermore, photographs contain a high level of information about shapes and colors
(geometry, dimensions, visual appearance, etc.). In this sense, photographs represent a very promising support for digital documentation.
As a support for documentation, photographs can be, partially or entirely, semantically described with keywords or ontologies. Analyzes on architectural shapes (measuring, outline extraction, etc) and on surfaces’ characterization (for example, observing the state of preservation) can be directly perform on them. Besides, with the development of image-based-modeling techniques, large set of images are used to generate 3D representations as precise as laser-acquisition-based techniques.
Thus, photographs appear as an essential way for the
documentation of buildings. However, an exhaustive documentation of a building needs the collect of hundred or thousand images. In view of the large number of manipulated photographs and as annotations can concern different relevant photographs in the set, the problem of the continuity of information between images come up.
For these reasons, this research focuses on a hybrid approach for the semantic annotation of spatially-oriented images (which positions and orientation in space are automatically estimated).
This article has been divided into seven parts; Section 2 presents some methods for the annotations of images and of 3D
representations; Section 3 presents the main approach; Section 4, 5 and 6 describe the different steps of the process’ implementation. Finally, section 7 evaluates the system and fixes some research perspectives for further development.
2. Related Work
In cultural heritage documentation, informing semantic information helps the comprehension of a building. Annotations on iconographic sources and more specifically on photographs (2D annotations) or on 3D representations (3D annotations) give a way to increase
information on the represented object.
2D sources can be annotated currently by means of three main methods: manual annotations, automatic annotations and semi-automatic annotations. Manual methods consist in annotating, entirely
or partially, images one by one using either keywords [3] or ontologies [4]. Automatic methods follow a process allowing the automatic assignment of a description to an image. They are based on an analysis of the image content by means of segmentation and shape
recognition [5-6]. At last, semi-automatic methods combine manual methods and automatic one. This combination can be implemented in two different ways: using the automatic method at first and asking the user for a validation of results [7] or using the manual method at first and using these manual annotations as a base for an automatic transfer on others images [8]. All of these methods only use 2D information.
Regarding 3D representations’ annotations, information is attached to parts of the 3D representation i.e. points [9], segments, surfaces [10] or objects [11]. Different standards can be used in order to support the annotation ([12–13]).
Researchers have got recently an important interest in using 3D information in the process of image annotations. Phototourism [14] uses SIFT points within a set of images in order to transfer annotations between all images. However, as the point cloud obtained with only SIFT points is not a dense point cloud, only rectangles can be transferred. Another approach [15] consists in using a segmented digital mock-up where images are oriented all around it. Annotations on the digital mock-up can be so projected on images. But this process requests an entirely annotated digital mock-up and annotations can only be defined on it and not directly on images.
All these works show that annotation process could be clearly improved by connecting images with a 3D representation of the building.
3. Main Approach
The aim of this research is to develop a hybrid approach for the semantic annotation of a set of spatially-oriented images. This approach takes into account the problem of the automatic transfer of annotations between images. The main idea is that 3D information can be used as a support for propagating an annotation defined on one image on the other relevant images of the set. In this way, a relation between images can be
obtained by using 3D information as an intermediary. Thus, the adopted approach permits to:
• generate 3D point cloud by processing images with an automated image-based 3D reconstruction method. This method creates 3D point cloud inherent to images.
• semantically annotate images by means of an automated propagation of annotations
• add new images in the set of processed and already-annotated images.
4. 3D Points Generation
The approach is based on a set of tools developed by the MAP laboratory in collaboration with IGN and FBK. The process, detailed in [16], consists in calibration and orientation of images, dense multi-view stereo correlation and point cloud generation.
This process needs a specific protocol for images acquisition [17]. Thus, a very large set of images is beforehand acquired with this protocol in order to cover the most points of view as possible for a correct multi-view stereo correlation.
4.1. Calibration and orientation of images
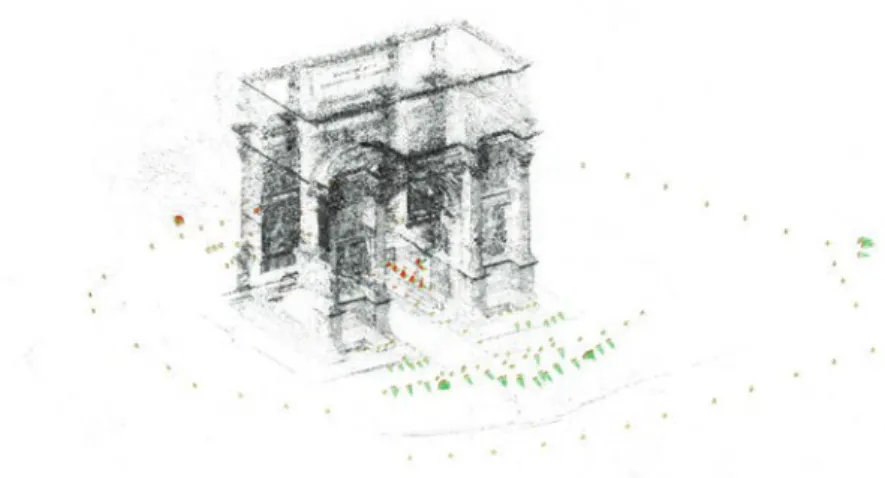
This method is based on the open source APERO [18]. It is constituted with module for tie points extraction (SIFT algorithm [19] adapted by A. Vedaldi [20]), estimation of internal and external parameters of the camera’s geometric model, initial solution computation and bundle adjustment for relative and absolute orientation. In this way, this method calculates the position and the orientation in space of images of the set (Figure 1).
4.2. Dense multi-view stereo correlation
As images’ positions are known, a dense matching-based
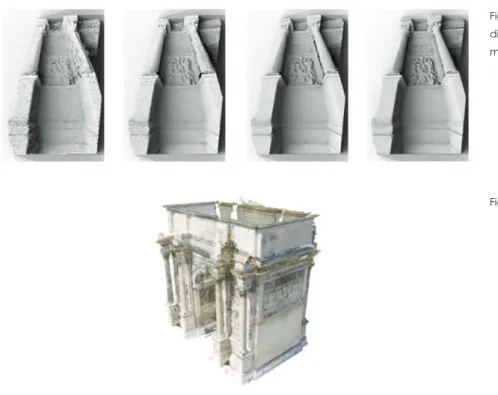
reconstruction method (included in the open source MicMac [21]) generates depth maps on most relevant images. The matching has a pyramidal approach (Figure 2). In this step, pixels depth can be computed for groups of pixels by using a scale. For example, if the scale is 2, a computed depth is corresponding to 4 pixels in the image. The interest of using a scale in the dense image matching is the decrease of time computing but the bigger the scale is, the less dense the point cloud will be.
Figure 1. Images orientation around SIFT points.
4.3. Point cloud generation
Starting from the results obtained in 4.1 and in 4.2, depth maps are converted into 3D metric points. This conversion is based on the projection in space of each pixel of the computed image taking into account orientation and position in space of the image. Thus, a dense point cloud (up to one 3D point for one pixel, depending on the scale) is generated for each computed images. As positions of images relative to each other are considered during each image’s point cloud generation, all point clouds are oriented relative to each other. In this way the superposition of all point clouds allows the creation of the complete point cloud of the building (Figure 3).
4.4. XYZ files
With the generated point cloud of master images, pixel coordinates are known. These coordinates are then stored in specific TIFF files: XYZ files.
TIFF files are image files storing color information on three layers associated with primary colors (Red, Green and Blue). An image’s pixel color is a combination of three values, each associated with one of the three layers. Each of these values is an integer between 0 and 255. To extract one of the three values composing the color of a pixel positioned at the row i and the column j in the image, the TIFF file of
Figure 2. Pyramidal approach: different results during the multi-scale matching.
the image is read at the row i and the column j in the corresponding layer (Figure 4).
Instead of storing color information, XYZ files use the TIFF file structure to store coordinates (X, Y and Z) of pixels. Thus, X coordinates are stored in the red layer, Y in the green layer and Z in the blue layer. If each pixel of an image has a 3D point, the associated XYZ file is same-sized as the image. Then, to read 3D coordinates of a pixel at the row i and the column j in the image, the XYZ file is read on each layer at the row i and the column j (Figure 5).
If a scale has been used in the dense image matching, a
generated 3D point can be associated to several pixels in the image. Thus, the XYZ file associated to the image is smaller than the image but proportionally to the image size according to the chosen scale. In this case, before reading positions (row and column) in the image, it is first scaled to the same size as the XYZ file.
Thus, a XYZ file is associated to each master image. This file allow to link pixels of the image and their associated 3D point.
5. Automatic Transfer of Annotations
With the XYZ files containing pixels coordinates of images, the methodology for the transfer of annotations can be set up.
Figure 4. TIFF file structure.
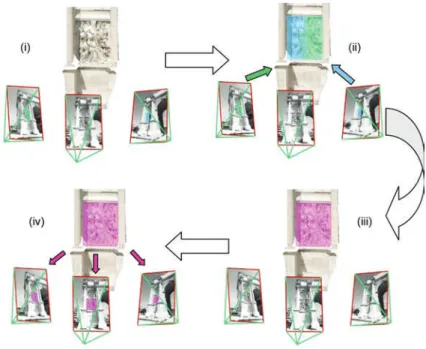
This methodology is based on the link between 2D (pixels) and 3D (XYZ files) and consists in three mains steps (Figure 6):
• Definition of the annotation
• Search for 3D information of the annotation with the help of XYZ files
• Transfer on the other also with the help of XYZ files Thus, the propagation of annotations between images is
implemented with a 2D/3D relative projection that can be exploited in both directions: 2D to 3D and 3D to 2D. Moreover, annotations are defined simultaneously as 2D regions on images and as 3D point clouds.
5.1. Definition of annotation
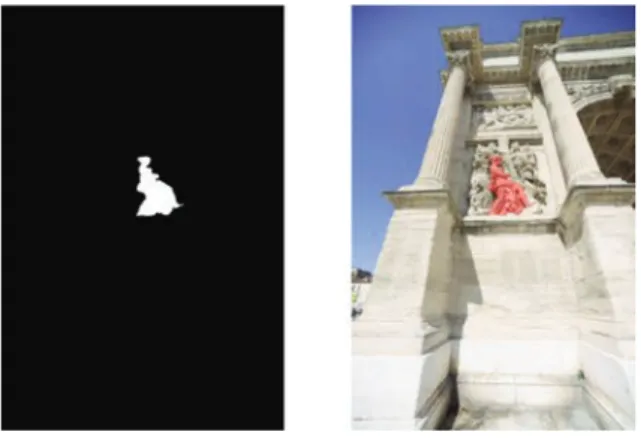
The first step consists in defining manually the area of the annotation on one image of the set. This area is used to create a black and white mask same-sized as the image (Figure 7). The white area corresponds to the drawn area.
Figure 6. Transfer’s steps: (i) definition of the annotation, (ii) search for 3D information and (iii) transfer on other images.
Figure 7. Definition of the annotation and extracted mask.
5.2. 3D information of the annotation
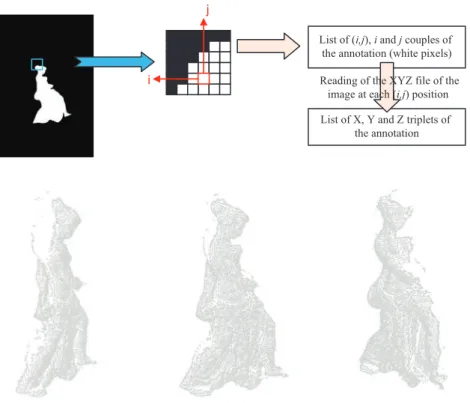
In the mask, the annotation is represented by white pixels and the objec-tive of this step consists in extracting 3D coordinates of these pixels.
Thus the position (couples of row i and column j) of all white pixels in the image are needed in order to read 3D coordinates in the associated XYZ file. If a scale has been used during the dense image matching, the mask must be first resized to the size of the XYZ file before extracting positions of white pixels.
As all positions of white pixels are extracted, the XYZ file is read at these detected positions. A list of 3D coordinates is therefore
constructed (Figure 8).
The annotated area is so defined in space by this list of X, Y and Z triplets of coordinates (Figure 9).
In this step, the extraction of pixels positions can be simplified by using a sampling of white pixels. Instead of searching all white pixels positions, only positions of pixels in the white areas’ contour and in a grid pattern inside the white area are extracted (Figure 10).
5.3. Transfer on the others images
As the 3D coordinates of the annotation are known, the next step is to retrieve these triplets of coordinates in the other XYZ files. Thus all triplets are searched in an XYZ file and positions in the XYZ file
Figure 8. Extraction of 3D coordinates of the annotation.
i
j
List of (i,j), i and j couples of the annotation (white pixels)
List of X, Y and Z triplets of the annotation Reading of the XYZ file of the
image at each (i,j) position
Figure 9. 3D representation of the annotation obtained with XYZ file.
(row and column), where at least one of the triplets is corresponding, are defined as true. All other positions in the XYZ file are considered as false (Figure 11). If an X, Y and Z triplets is not found in the XYZ file that means the associated point does not appear in the image.
With this comparison, provided by a binary search, a mask same-sized as the XYZ file is constructed where true positions are represented by white pixels and false positions are represented with black pixels. A dilation and followed by an erosion of the mask allow to fill holes that can appear, especially if a sampling has been used (Figure 12). As,
Figure 10. Pixels sampling in the mask.
Figure 11. Research of true and false positions in the XYZ file.
List of X, Y and Z triplets of the annotation
(i,j) positions in XYZ file
One of the annotation’s triplets corresponds None of the annotation’s triplets corresponds True position False position COMPARISON
Figure 12. Results with sampling or without sampling and before or after dilation and erosion.
W
ITHS
AM PLINGW
ITHO U TS
AM PLINGR
AWR
ESULTSC
ORRECTEDR
ESULTSFigure 13. Final mask (left) and visualization on the image (right).
with sampling, less point have been search, the detected area is less precise as without sampling.
If the drawn area does not appear in the image, the created mask will be only composed of black pixels given that all positions in the XYZ file will be defined as false.
The detected area can be displayed on the image by a half-transparent colored layer (Figure 13). Evidently, if a scale has been used during the dense image matching and so the XYZ is smaller than the image, the mask must be firstly resized so as to fit with the image.
5.4. Multi-view definition of annotations
The process for the transfer of annotations only allows the search of existing points in images. However, in most cases, an object needs multiple views to be wholly defined.
For this reason, the process of annotation should furthermore take into account this aspect. The three steps of the propagation,
described in section 5.1, 5.2 and 5.3, can be used in a multi-view annotation system.
First of all, different views are selected and annotated as in the section 5.1. Thus, different masks are created. Each mask is
implemented with the process described in section 5.2 with the corresponding XYZ file. At the end of this step, several lists of 3D coordinates of the annotation are created. Each list represents a part of the annotation. All points of the annotation are grouped together before implementing the last step described in section 5.3 with each image. As a consequence, masks are created by taking into account the different part of the annotation defined on different images (Figure 14). In this way, an annotation can be defined from different points of view and propagated to all images in the set.
6. New Image Annotation
The process, presented in section 5, supposes that the set of images has been acquired with a specific protocol [15] and that all images have been processed with the automated 3D reconstruction method described in section 4. All these steps needs time especially the 3D reconstruction method.
However an annotation can need a very specific view of the considered building that has not been taken during the acquisition of images. In this way, the adding of new images should be envisaged but without having to processed again all the set of images with the new image.
Two main aspects are considered in this part:
• the visualization of already-defined annotations on the new image
• the definition of new annotations from the new image also considering transfer between images
6.1. Visualization of annotations on new image
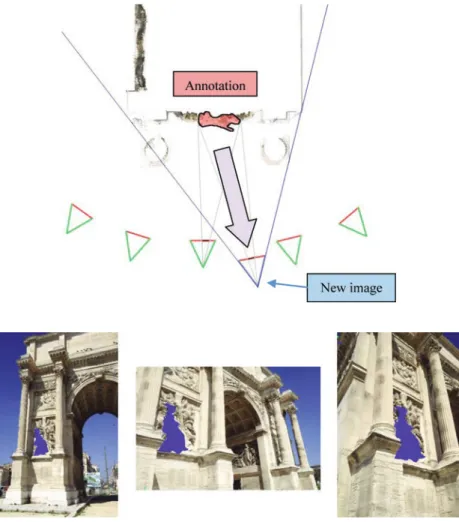
As all images are oriented relative to others, the new image should be also oriented towards the set of images. The new image is compared with all of the already-oriented photographs (as described in section 4.1). As the new image is then oriented relative to all others images, it is also oriented around point clouds.
Given that annotations can be represented by a point cloud, the new image is also oriented relative to annotations. Thus, the
Figure 14. Multi-view annotations system: (i) definition of the annotation from different points of view (5.1), (ii) search 3D coordinates of each part of the annotation (5.2), (iii) merging of all points of the annotation, (iv) propagation of annotations on all images (5.3).
annotations can be displayed on the new image towards the new image’s point of view with the help of the annotations’ 3D
representation (Figure 15).
Annotations are then precisely projected on the new image (Figure 16). However, this system does not manage occlusions issues because the entire annotation’s point cloud is projected.
Thus, this technique only allows the visualization of annotations on new-added images without managing occlusions.
6.2. New annotations from the new image
The new-added image could be also reserved to annotate the set of images. Even so the process of annotations transfer needs XYZ files. If the new image as only been oriented relative to others images, it has not an associated XYZ file and the transfer cannot be implemented with this image.
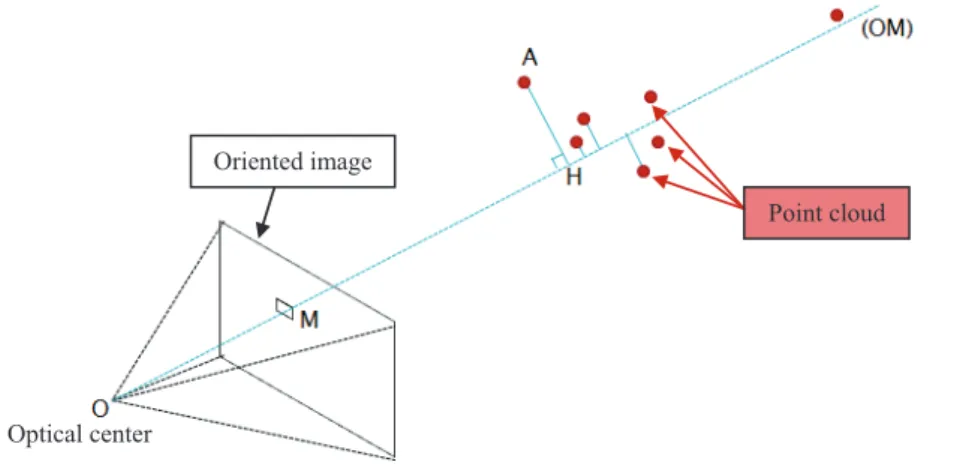
Given that the complete generated point cloud is very dense, it could be used to generate a “virtual” XYZ file for the new image. With
Figure 15. Projection of annotations on an only-oriented image.
Figure 16. Results of annotations projection on only-oriented images.
the orientation of the new image relative to the point cloud, pixels of the image could be associated to 3D points by using geometric relation.
For a pixel in the new image, the ray between the optical center and the center of the pixel (oriented in space) is considered. Then two criterions are explored: firstly distances between 3D points and the ray (AH)(Figure 17) and secondly distances between the optical center and the orthogonal projection of 3D points on the ray (OH)(Figure 17).
These two distances have to be as short as possible. Thus a
minimization score is calculated between the two distances to find the best-fitting 3D point.
A “virtual” XYZ file could be then constructed for the new image. The generation of this “virtual” XYZ file is actually in implementation. Having this XYZ file, the transfer of annotations could be launched.
7. Conclusions and Perspectives
This paper has described a hybrid process of semantically annotate a set of oriented photographs by using an automated transfer of annotations. Results shows encouraging perspectives and some applications can be already considered, for example, monitoring state of conservation of building. If a new photograph could be added to the set of already oriented images and annotations could be defined or visualized on them, mobile applications, like described in [22], could be envisaged. However some issues still needs to be resolved.
First of all, the definition and the transfer of annotations could be improved by an automated segmentation. A segmentation permits to defined areas that could be detected during the process. Instead of searching all pixels corresponding to the annotation, only areas could be detected. Thus the definition of annotations can be come down to
Figure 17. “Virtual” XYZ file generation: considered distances.
Optical center
Oriented image
simply select parts of the segmentation and the transfer can be come down to detect parts of the segmentation.
Besides, different levels of semantic description are generally considered. Thus the overlapping of annotations should be managed.
Then a set of 2D or 3D analyzes tools (color, shape, etc) could be developed by using images or point clouds.
At last, as the state of a building evolves in time, images from different time should be managed especially in the case of the adding of a new image.
8. References
[1] Q.-Y.i Zhou, S. Miller, Stanford University; Vladlen Koltun, Stanford University in Elastic Fragments for Dense Scene Reconstruction, ICCV, 2013.
[2] K. Makantasis, A. Doulamis and N. Doulamis, A Non-parametric Unsupervised Approach for Content Based Image Retrieval and Clustering, 4thWorkshop on Analysis and Retrieval of Tracked Event and Motion in Imagery Streams, ARTEMIS 2013, ACM Multimedia workshops, 2013.
[3] C. Halaschek-Wiener, G. Jennifer, S. Andrew, G. Michael, P. Bijan, and H. Jim, PhotoStuff—An Image Annotation Tool for the Semantic Web, 2005. [4] K. Petridis, D. Anastasopoulos, C. Saathoff, N. Timmermann, I.
Kompatsiaris, and S. Staab, M-OntoMat-Annotizer: Image annotation linking ontologies and multimedia low-level features, KES 2006 10th Intnl. conf. on knowledge based, intelligent information and engineering systems, 2006.
[5] J. Shotton., J. Winn, C. Rother, and A. Criminisi, TextonBoost for Image Understanding: Multi-Class Object Recognition and Segmentation by Jointly Modeling Texture, Layout, and Context, IJCV(81), No. 1, 2009. [6] H.G. Akcay and S. Aksoy, Automatic Detection of Geospatial Objects
Using Multiple Hierarchical Segmentations, IEEE Transactions on
Geoscience and Remote Sensing, 46(7), pp. 2097–2111, 2008
[7] J. Li and J.Z. Wang, Real-Time Computerized Annotation of Pictures, Proc. ACM Multimedia. pp. 911–920, 2006.
[8] S. Barrat and S. Tabbone, Classification et extension automatique d’annotations d’images en utilisant un réseau Bayesien, 2009.
[9] J. Hunter and C.H. Yu, Assessing the Value of Semantic Annotation for 3D Museum Artifacts, 2011
[10] M. Attene, F. Robbiano, M. Spagnuolo and B. Falcidieno, Part-based Annotation of Virtual 3D Shapes, 2009
[11] S. Havemann, V. Settgast, R. Berndt, O. Eide and D.W. Fellner, The Arrigo Showcase Reloaded – Towards a sustainable link between 3D and semantics, 2008
[12] I.M. Bilasco, J. Gensel, M. Villanova-Oliver and H. Martin, 3DSEAM: a model for annotating 3D scenes using MPEG-7, 2005
[13] F. Pittarello and A. De Faveri, Semantic Description of 3D Environments: a Proposal Based on Web Standards, 2006
[14] N. Snavely, S. Seitz, and R. Szeliski, Photo Tourism: Exploring Photo Collections in 3D, 2006.
[15] C. Stefani, C. Busayarat, J. Lombardo and L. De Luca, A database of spatialized and semantically-enriched iconographic sources for the documentation of cultural heritage buildings. Proceedings of IEEE VSMM 2012 - 18th International Conference on Virtual Systems and Multimedia. Milan, Italy, 2–5 September 2012.
[16] M. Pierrot-Deseilligny, L. De Luca, F. Remondino, Automated image-based procedures for accurate artifacts 3D modeling and orthopicture
generation, Geoinformatics FCE CTU Journal, vol. 6, pp. 291–299, Prague, Czech Republic., 2011
[17] N. Martin-Beaumont, N. Nony, B. Deshayes, M. Pierrot-Deseilligny, and L. De Luca, Photographer-friendly Workflows for Image-Based Modeling of Heritage Artifacts, XXIV International CIPA Symposium
2–6 September 2013, Strasbourg, France, ISPRS Archives – Volume XL-5/W2 p.421–424, 2013
[18] M. Pierrot-Deseilligny and I. Clery, APERO, an open source bundle adjustment software for automatic calibration and orientation of set of images, Int. Archives of Photogrammetry, Remote Sensing and Spatial
Information Sciences, 38(5/W16), on CD-ROM. ISPRS Int. Workshop 3D-ARCH 2011, Trento, Italy, 2011
[19] D.G. Lowe, Object recognition from local scale-invariant features. Proceedings of the International Conference on Computer Vision, 1999 [20] A. Vedaldi, An open implementation of the SIFT detector and descriptor,
UCLA CSD Tech. Report 070012, 2006
[21] M. Pierrot-Deseilligny and N. Paparoditis, A multiresolution and optimization-based image matching approach: An application to surface reconstruction from SPOT5-HRS stereo imagery, In: IAPRS, Vol. XXXVI-1/W41 in ISPRS Workshop On Topographic Mapping From Space (With Special Emphasis on Small Satellites), Ankara, Turkey, 2006 [22] A. Manuel, E. Gattet, L. De Luca and P. Véron, An approach for precise
2D/3D semantic annotation of spatially-oriented images for in situ visualization applications, 2013 Digital Heritage International Congress (DigitalHeritage), Vol. 1, pp. 289–296, IEEE, 2013.