Design and fabrication of a miniaturized wireless pH sensor
by
Houssem Eddine AMOR
THESIS
PRESENTED TO ÉCOLE DE TECHNOLOGIE SUPÉRIEURE IN PARTIAL
FULFILLMENT OF THE REQUIREMENTS FOR THE DEGREE OF
M.A.Sc
MONTREAL, 3 JANUARY 2017
ECOLE DE TECHNOLOGIE SUPÉRIEURE UNIVERSITÉ DU QUÉBEC
This Creative Commons licence allows readers to download this work and share it with others as long as the author is credited. The content of this work can’t be modified in any way or used commercially.
BOARD OF EXAMINERS THESIS M.SC.A.
THIS THESIS HAS BEEN EVALUATED BY THE FOLLOWING BOARD OF EXAMINERS
Mr. Ammar Kouki, Thesis Supervisor
Electrical Engineering at École de technologie supérieure
Mr. Hung Cao, Thesis Co-supervisor
Electrical Engineering at University of Washington Bothell
Mr. Vahé Nerguizian, President of the Board of Examiners Electrical Engineering at École de technologie supérieure
Mr. Frédéric Nabki, Member of the jury
Electrical Engineering at École de technologie supérieure
THIS THESIS WAS PRESENTED AND DEFENDED
IN THE PRESENCE OF A BOARD OF EXAMINERS AND PUBLIC 7 DECEMBER 2016
ACKNOWLEDGMENT
I would like to express my gratitude and appreciation to my two supervising professors: Dr. Ammar Kouki who gave me opportunities to work on interdisciplinary research projects, and Dr. Hung Cao who always encourages me to improve my capabilities in the research and surpass myself, without their guidance and enthusiasm, I could not have a chance to get into this research fields. They offered me a unique opportunity to be part of a collaboration between Ecole de Technologie Superieure in Canada and the University of Washington Bothell in the USA.
I would like to thank the technician, Mr. Normand Gravel for his technical support and advice.
I would like to thank all of my friends at LACIME, especially Achraf Ben Amar and Dorra Bahloul. Also, at the University of Washington, especially Victor Ho, Colton Wallin, Paul G. Marsh and Manuja Sharma.
Finally, I would like to express my gratitude and appreciation to my family for their sacrifice, their support and encouragement.
DESIGN ET FABRICATION D’UN CAPTEUR pH MINIATURE SANS FIL ET SANS BATTERIE
Houssem Eddine AMOR
RÉSUMÉ
La mesure du niveau de pH est une action essentielle dans plusieurs domaines, notamment pour les applications environnementales. médicales, contrôle de qualité, etc. Les appareils de mesure du pH qui existent actuellement sur le marché, ont des électrodes fragiles et volumineuses, sont coûteux, ont une très haute impédance d’entrée, présentent une réponse lente, ce qui empêche leur utilisation dans des applications spécifiques. Les récentes avancées en microfabrication et l’apparition de nouveaux matériaux ont permis la miniaturisation des capteurs pH. L’intégration et la miniaturisation du capteur et de l’électronique embarquée constituent un défi.
Dans ce travail de recherche on a développé et fabriqué un capteur pH miniature en utilisant différents procédés de fabrication. Ce capteur est potentiellement applicable dans la supervision environnementale, collecte de données médicales, contrôle alimentaire, etc.
Il y a un besoin de développer une interface sans fil, surtout dans les applications médicales. Aussi, par souci de miniaturisation, de biocompatibilité, et divers risques d’infections le développement de solutions sans batterie est évident. Pour ces raisons on a développé une interface sans fil et aussi, on a conçu et optimisé un dispositif de transmission de puissance sans fil (antenne de transmission et de réception).
DESIGN AND FABRICATION OF A MINIATURIZED WIRELESS AND BATTERYLESS pH SENSOR
Houssem Eddine AMOR
ABSTRACT
pH sensors have been used in numerous applications, such as environmental monitoring, food quality control, and clinical testing. The conventional sensors, based on glass electrodes, provide high precision and reliability over an extended period. However, the bulkiness and the lack of integration have limited their use. The recent advances in microfabrication and materials have enabled miniaturized pH sensing systems based on various substrates; however, the reliability and integration with electronics remained a challenge.
In this work, we designed and developed a miniaturized pH sensor using different fabrications process, aiming for potential applications in clinical monitoring, environmental and food-safety monitoring. Due to biocompatibility, infections and size concerns, the need for a wireless and battery-less system is evident, especially for medical devices. For that reason, we also designed a wireless user interface and an optimized inductive link (transmitter antenna, receiver antenna) to transmit power wirelessly.
TABLE OF CONTENTS
Page
INTRODUCTION ...2
CHAPTER 1 FUNDAMENTALS OF pH MEASUREMENT ...3
1.1 pH Definition ...3
1.2 Importance of pH measurement ...3
1.2.1 Importance of pH in environmental monitoring ... 3
1.2.2 Importance of pH in food processing ... 5
1.2.3 Importance of pH in medical diagnostic and prognostic ... 5
1.3 Existing commercial solution for pH measurement ...6
1.3.1 pH Paper strips ... 6
1.3.2 Glass electrode ... 7
1.3.3 pH Electrodes based on Ion Sensitive Field Effect Transistor ... 8
1.4 Conclusion ...9
CHAPTER 2 IRIDIUM OXIDE ...11
2.1 Introduction ...11
2.2 pH Sensing Mechanism of Iridium Oxide ...11
2.3 Different deposition techniques of Iridium oxide ...13
2.3.1 Sol-gel Deposition of Iridium oxide ... 13
2.3.2 Electrodeposition of Iridium oxide ... 20
2.4 Conclusion ...24
CHAPTER 3 pH SENSOR FABRICATION TECHNIQUES ...25
3.1 Introduction ...25 3.2 MEMS pH sensor ...25 3.2.1 Photolithography ... 26 3.2.2 Sputtering ... 27 3.2.3 Liftoff ... 28 3.2.4 IrOx deposition ... 28
3.3 Laser micromachined pH sensor ...32
3.4 LTCC based pH sensor ...34
3.5 Conclusions ...39
CHAPTER 4 NOVEL MINIATURIZED WIRELESS pH SENSING SYSTEMS...41
4.1 Introduction ...41
4.2 Miniaturized wireless LTCC based pH sensing device ...41
4.2.1 Circuit and layout design ... 41
4.2.2 Integration ... 43
4.2.3 Wireless user interface ... 46
4.3 Other prototypes...48
4.3.1 Flexible pH sensing device ... 48
4.4 Conclusion ...53
CHAPTER 5 WIRELESS POWER TRANSFER FOR BATTERY-LESS APPLICATIONS ...55
5.1 Introduction ...55
5.2 The concept of wireless power transfer ...56
5.3 Transmitter antenna design ...59
5.3.1 Antenna parameters ... 60
5.3.2 Transmitter tuning and performances ... 63
5.4 Receiver antenna design ...67
5.4.1 Air core antenna ... 68
5.4.2 Flexible spiral antenna ... 73
5.4.3 LTCC antenna ... 75
5.5 Results and conclusion ...80
CONCLUSION ...83
LIST OF TABLES
Page
...
Table 1.1 Comparison of different commercial pH sensing devices ...10
Table 2.1 Sensitivity vs size...19
Table 2.2 Comparisons between sol-gel and electrodeposition of IrOx ...24
Table 3.1 Comparison of different fabrication techniques ...39
Table 5.1 Common unlicensed ISM frequency ...59
LISTE DES FIGURES
Page
Figure 1.1 pH paper strip ...7
Figure 1.2 Glass electrode ...8
Figure 1.3 pH Electrode based on Ion Sensitive Field Effect Transistor ...9
Figure 2.1 Rutile structure ...12
Figure 2.2 Sol-gel process...14
Figure 2.3 SEM and EDS after sol-gel deposition of Iridium oxide ...15
Figure 2.4 Different sized working electrodes ...16
Figure 2.5 Energy dispersive spectroscopy of different sized electrodes (Iridium vs ...Oxygenin mass percent) ...17
Figure 2.6 Nernst response of different sized working electrode vs. a commercial ...Ag/Ag-Cl electrode at 19°C ...18
Figure 2.7 Sensitivity of a WE based on sol-gel vs temperature ...20
Figure 2.8 Electrodeposition of Iridium oxide ...21
Figure 2.9 pH sensor calibration at room temperature ...22
Figure 2.10 a) SEM image, b) EDS analyses, c) Map distribution ...23
Figure 3.1 Photolithography ...26
Figure 3.2 Sputtering ...27
Figure 3.3 Liftoff ...28
Figure 3.4 Electrode thickness measurement ...29
Figure 3.5 Electrodeposition result with sputtered thin conductor ...29
Figure 3.6 Cracks formation due to thermal stress ...30
Figure 3.7 Microfabrication steps ...31
Figure 3.9 Laser etching fabrication chain ...33
Figure 3.10 Laser micro-machined pH sensor response at 19°C ...34
Figure 3.11 LTCC pH sensor fabrication chain ...35
Figure 3.12 Silver thickness measured before electrodeposition of IrOx ...36
Figure 3.13 a) SEM image, b) EDS analyses, c) Map distribution ...37
Figure 3.14 LTCC pH sensor calibration at room temperature ...38
Figure 4.1 a) Sensing device schematic; b) Sensing device layout ...42
Figure 4.2 LTCC fabrication chain ...44
Figure 4.3 Validation of the integrated design ...45
Figure 4.4 Block diagram ...46
Figure 4.5 Graphical user interface ...46
Figure 4.6 Real-time pH testing of our system ...47
Figure 4.7 Flexible pH sensing device fabrication chain ...49
Figure 4.8 Microfluidic glass based miniaturized pH sensing device ...51
Figure 4.9 System block diagram of blood pH monitoring system ...52
Figure 5.1 Different zones of an EM field generated by an antenna ...56
Figure 5.2 WPT system block diagram ...58
Figure 5.3 Examples of different antennas orientation ...58
Figure 5.4 Equivalent antenna circuit ...61
Figure 5.5 Extraction of antenna equivalent electric circuit from Smith’s chart ...62
Figure 5.6 Transmitter antenna performances before matching ...63
Figure 5.7 Transmitter antenna impedance matching ...65
Figure 5.8 Transmitter antenna performances after matching ...66
XVII
Figure 5.10 Air core antenna performances before tuning ...69
Figure 5.11 Air core antenna performances after tuning ...71
Figure 5.12 Bandwidth tuning ...72
Figure 5.13 Flexible spiral antenna equivalent circuit ...73
Figure 5.14 Flexible spiral antenna performances before tuning ...73
Figure 5.15 Flexible spiral antenna performances after tuning ...74
Figure 5.16 One layer LTCC spiral antenna equivalent circuit ...75
Figure 5.17 One layer LTCC spiral antenna performances before tuning ...76
Figure 5.18 One layer LTCC spiral antenna performances after tuning ...77
Figure 5.19 Four layers LTCC spiral antenna equivalent circuit ...78
Figure 5.20 Four layers LTCC spiral antenna performances ...79
Figure 5.21 Wireless power transfer efficiency ...80
LIST OF ABBREVIATIONS
IrOx Iridium oxide
FDA Food and Drug Administration CFR Code of Federal Regulations
ISFET Ion Sensitive Field Effect Transistor SEM Scanning Electron Microscopy EDS Energy Dispersive Spectroscopy WE Working Electrode
RE Reference Electrode CV Cyclic Voltammetry
MEMS Micro-Electro-Mechanical System LTCC Low-Temperature Co-fired Ceramic PCB Printed Circuit Boards
RF Radio-Frequency
ADC Analog-Digital Converters BLE Bluetooth Low Energy SMD Surface-Mount Device LOD Limit Of Detection
IMDs Implantable Medical Devices WPT Wireless Power Transfer RL Return losses
EMF Electro Magnetic Field WPE wireless power efficiency
ISM Industrial, Scientific, and Medical FCC Federal Communications Commission
LF Low Frequency
HF High Frequency
UHF Ultra-High Frequency AWG American Wire Gauge VSWR Voltage Standing Wave Ratio
LIST OF SYMBOLS
[H+] hydrogen ion concentration
Ag silver
Au gold
S sensitivity expressed in mV/pH CO2 carbon dioxide
HCO3- bicarbonate
C2H6O6 oxalic acid dehydrates K2CO3 potassium carbonate
E0 standard potential produced by the reference electrode (expressed in mV) R gas constant (with a value of 8.314, expressed in J/mol·K)
T temperature
F Faraday’s constant with a value of 96,485 expressed in C/mol.
E electric field
H magnetic field
λ wavelength
Γ reflection coefficient
dB decibel
S12 transmitted power from port 2 to port 1 S11 reflected power in port 1
INTRODUCTION
pH sensors are useful in numerous applications, such as environmental monitoring, food quality control, clinical testing, etc. Nowadays there is a multitude of available commercial solutions to perform the pH measurement. Those devices have some advantages making them useful for general applications. But they also have some disadvantages limiting their use in some specific applications such as medical diagnostic and prognostic. The objective of the research work is to design pH sensing systems targeting some specific applications which require: better integration, low power, short response time, high precision, etc. Chapter 1 will cover that aspect.
In chapter 2, we will use IrOx as a pH sensing material and we will compare two different deposition techniques (Sol-gel and electro-deposition). In chapter 3, we will compare various fabrication techniques (MEMS, laser etching, LTCC. Selection criteria (feasibility, sensitivity, cost, complexity, etc.) may change according to the application.
Chapter 4 will present our prototype of a wireless pH monitoring system; we used a modular approach to prove the concept. Due to biocompatibility, infections, and size concerns, the need for a wireless and battery-less system is evident, especially for medical devices. For those reasons, we will design an optimized inductive link (transmitter antenna, receiver antenna) to transmit power wirelessly. This last part is covered in chapter 5.
To give credibility to our research, we published a paper in IEEE Sensors using some of our results illustrated in this thesis.
CHAPTER 1
FUNDAMENTALS OF pH MEASUREMENT
1.1 pH Definition
The pH scale was introduced in 1909 by the biochemist, Soren Peter Lauritz Sorensen as the negative common base 10 logarithmic measurement of the hydrogen ion concentration, [H+] (number of moles of hydrogen ions H+ per liter). The “p” prefix in pH stands for potential, while the upper-case letter “H” stands for the element hydrogen and it is expressed mathematically as (Jensen, 2004):
pH = - log([H+]) (1.1)
Every aqueous solution contains a certain amount of hydrogen ions; then it is possible to measure its pH value. This chemical quantity range from 0 to 14 pH, pH of 7 is the center of the scale. A pH of 7 reveals neutral property; the solution is neither acidic nor basic. Values below pH of 7 indicate acidic properties. Values above pH of 7 show alkaline properties.
1.2 Importance of pH measurement
The measure and the control of the pH are fundamental in numerous applications, such as food processing, chemicals, petrochemicals, pharmaceutical manufacturing, industrial processing, environmental and clinical monitoring. There is a tremendous number of potential applications. We will just introduce some of them.
1.2.1 Importance of pH in environmental monitoring
Water is the most common and vital substance on Earth. Pure water is a clear, colorless, and odorless liquid made up of one oxygen and two hydrogen atoms. At 25⁰ C in pure water, the amount of hydrogen and hydroxide ions is equal. That is why pure water is described as a
neutral solution. The pH of the water has been identified as one of the most important parameters affecting the quality of the water. In fact, chemical, biological, and physical factors can affect the pH of water (Maciel et al., 2013).
Rainwater is naturally acidic, around pH of 5.6. But nowadays, due to the excessive release of CO2 and some pollutants, the rain is becoming excessively acidic (Sumari et al., 2010). CO2 dissolves in water to form carbonic acid as follows:
CO2 + H2O H2CO3 (1.2)
In some places, the acidity increases to harmful levels between 4.0 and 5.0 pH. Plants will grow better if the soil is maintained at an optimal pH (Warudkar et Dorle, 2016). This variation of the pH of the rainwater is destroying many plantations. For this reason, various environmental agencies are trying to minimize the pollutants that cause acid rain, and pH measurement is a good indicator for environmental monitoring.
Ocean acidification is another alarming environmental issue, essentially caused by the atmospheric carbon dioxide. In fact, like water and air mix at the surface CO2 dissolves in water to form carbonic acid (Irish et al., 2010). Oceans, lakes, and rivers absorb roughly one third of carbon dioxide emissions which represent 22 million tons each day and this gas will increase the acidity of the water. Before the industrialization, the usual pH of the ocean was about 8.2. Current ocean pH is roughly 8.09. This change of 0.11 pH in logarithmic scale may be seen to be harmless but it is equivalent to a 30% increase in acidity, and it is already affecting and stressing the marine life which leads to dying and severely disturbing ecosystems. According to the Australian government, if the emission of CO2 keeps the same tendency, by 2100 it could make the oceans up to 320%more acidic. Then the marine life may not survive in that extreme environment((ASOC), 2010). Many governments are extremely concerned by this problem, Australia is the first concerned because it does not only have an impact on ecology, it also has an economic impact (fisheries, aquaculture, tourism). They are massively investing in remote data monitoring and try to reduce the effect of this phenomenon ((AIMS),
5
2016). There is a lack of data, which result in a bad model prediction especially data collected in depth water and open ocean ((IMOS), 2016).
1.2.2 Importance of pH in food processing
In food production, pH levels control is an essential step in the manufacture of a multitude of high-quality products. For instance, during food processing, managing and maintaining an optimal pH range is critical in many chemical and physical reactions (Huang et al., 2012). For example, controlled pH during the production of Yogurt will lead to undesired taste, discoloration and so forth. The Proper pH level is not only necessary to get the desired taste, look, and quality; but also maintaining a healthy pH is a food safety requirement. In the USA, Food and Drug Administration (FDA) regulates acidified food processing, Title 21 Section 114.90 of the Code of Federal Regulations (CFR).
Monitoring pH level can also help to check the freshness and detect deadly bacteria such as Botulism in preserved foods. In fact, there is a correlation between food freshness and pH level (Shah et Chauhan, 2015).
1.2.3 Importance of pH in medical diagnostic and prognostic
All living things (human beings, animals, vegetables, and so forth)depend on a balanced pH level to sustain life. They rely on internal mechanisms to maintain an appropriate pH level of their organism: For us human beings, the blood circulating through our body should have a pH balanced between 7.35 and 7.45 (Fu, Lin et Xu, 2011). Exceeding this interval by as little as 0.1 of a pH could be deadly (Mand et al., 2015). The kidneys and lungs are the primary organs involved in blood pH balance. For instance, raising and lowering the respiratory rate affects the concentration of CO2, and this influence blood pH. The kidneys regulate the concentration of bicarbonate (HCO3-) in blood. Blood pH changes due to increases or decreases in HCO3- concentration. The effect is slower compared to the carbon dioxide concentration in blood, in fact, it may take hours or days. Many diseases (especially diseases affecting lungs and kidneys)
can interfere with pH balance in the body and cause blood pH to fall outside of healthy limits, monitoring the blood pH balance allows a better diagnostic and prognostic (Chemistry, 2014) and (Mand et al., 2015).
According to literature, pH is also an important factor in tissue regeneration, a typical range of the pH during healing can be between 5.7 and 7.8, many studies reported a correlation of healing process with pH values (Puchberger-Enengl, Krutzler et Vellekoop, 2011). It is possible to monitor a burn and detect the presence of bacteria by incorporating pH sensor into bandages; known as smart bandages (Shorrock et al., 2000) (Farooqui et Shamim, 2016). There is a correlation between the value of pH and many other medical conditions and diseases; we will not talk about all of them because there is a tremendous number of medical applications. It is evident that pH is an important parameter for medical monitoring, very useful for a correct diagnostic and appropriate prognostic.
1.3 Existing commercial solution for pH measurement
Nowadays, there is a multitude of available commercial solutions to perform the pH measurement. For instance, in the market, we can find pH paper strips, glass electrodes, and Ion Sensitive Field Effect Transistor (ISFET). Each device has some advantages and disadvantages; we will briefly present each solution.
1.3.1 pH Paper strips
pH papers (Figure 1.1) contain reactive compounds which will change to a specific color at a particular pH value. The pH paper can be used to obtain quick pH measurements. The paper strip is dipped in the sample to measure the pH (Ke Dehong, 2014). The obtained color is compared to the given reference chart. This method is very cheap and does not require any calibration. However, the comparison of the color to the reference chart is based on visual inspection and is subjective; then this method is not very accurate. A maximum accuracy which could be obtained is between 0.3 and 1 pH units.
7
Figure 1.1 pH paper strip
1.3.2 Glass electrode
German chemist Fritz Haber and his student Zygmunt Klemensiewicz developed the glass electrode idea in 1909. Thanks to their invention they won a Nobel-Prize. Today the most widely used pH sensing device is the sensitive glass electrode. This kind of electrode which is illustrated in figure 1.2, uses a thin glass membrane that is responsive to changes in H+ activity and it is manufactured primarily from SiO2. Also, varying amounts of other metal oxides, like Na2O and CaO are incorporated inside the sensitive glass. When this membrane is placed in an aqueous solution containing H+, the external surface is hydrated as water enters a short distance into the crystal, and the interior part remains dry. Ions (such as Na+) can diffuse slowly from one site to another. The response time is long because the membrane resistance is very high (approximately 45 MΩ), and some H+ ions can charge pair with oxygen near the glass surface. A difference in the H+ activities on each side of the membrane leads to an imbalance in the surface charge between the internal and the external layer (A, 1948). This results in a membrane potential that is pH dependent described according to the Nernst equation:
Figure 1.2 Glass electrode
A second Ag/AgCl electrode is used as a reference to measure that potential correctly. Usually, glass pH sensors are a combined design, in which the sensitive electrode and needed reference electrodes are mounted on the same body. The modern, pH sensors are still using the conventional glass electrodes (invented more than a century ago), which provide high precision and reliability over an extended period. However, they are relatively expensive, the bulkiness, the lack of integration, long response time, and their high impedance have limited their use in many applications especially in medical monitoring.
1.3.3 pH Electrodes based on Ion Sensitive Field Effect Transistor
Piet Bergveld invented Ion Sensitive Field Effect Transistor (ISFET) in 1970. This new generation of sensors (Figure 1.3) was developed by the combination of semiconductor technology and pH sensitive materials. For instance, source and drain are constructed as for a MOSFET; the difference resides on the metal gate of a transistor which is normally used as input. In ISFET the metal gate is modified and replaced by an ion-sensitive membrane. The current through the transistor will change proportionally to the amount of H+ proton (which means therefore to pH level) (Jimenez-Jorquera, Orozco et Baldi, 2010). This new generation of sensors could be miniaturized, have a rapid response time, and they are robust. For those reasons, it is a good alternative to conventional glass-based sensing electrode.
9
Figure 1.3 pH sensor based on Ion Sensitive Field Effect Transistor
However, ISFET is more expensive than glass sensing electrode and still requires a standard reference electrode to perform measurements. A classical type reference electrode used in contact with the solution can also be bulky and fragile. Then, ISFET sensor will suffer the same limitations as conventional glass-based pH sensing electrodes (Jimenez-Jorquera, Orozco et Baldi, 2010).
1.4 Conclusion
An accurate pH value detection in real time is of keen interest in a significant number of applications (such as environmental monitoring, food quality control, and medical diagnostics). Some devices or methods are available to perform the pH measurement; they have many advantages. However, they also have some disadvantages (the bulkiness the lack of integration, excessive prices, etc.) limiting their use (Table 1.1).
A small change of the pH has a tremendous impact on ecosystems. Then the pH measurement is crucial for environmental monitoring. Existing pH sensors are bulky, fragile and especially very expensive. Not only but pH is a critical factor in the production of many food products and accuracy is the most important criteria for measuring pH level in the food industry. pH is also paramount for clinical monitoring. Due to biocompatibility, infections and size concerns, the need for wireless and battery-less is evident. Also, the large size of these pH-measuring devices makes them unsuitable for invasive diagnostics and use in medicine, for example:
more specific applications where existing commercial pH sensors are not well adapted and have some disadvantages, limiting their use.
Table 1.1 Comparison of different commercial pH sensing devices
pH sensing
technology Advantages Disadvantages
Paper strips
• disposable, • very cheap,
• no need for calibration, • no need for a reference
electrode.
• very low precision, • subjective visual reading, • non-connectable with electronic
devices.
Glass pH electrodes
• high precision, • high reliability.
• fragile (risk of broken glass), • bulky,
• expensive,
• need to be correctly stored, • long response time,
• needs calibration before each measure,
• need a reference electrode.
ISFET pH Electrodes
• resistant (no risk of broken glass), • can be stored dry, • short response time.
• more expensive than glass pH electrodes,
• hasn’t the same stability and
accuracy offered by glass electrodes, • known drifting problem,
• need calibration before each measure,
CHAPTER 2 IRIDIUM OXIDE
2.1 Introduction
As mentioned in the previous chapter, to perform the pH measurement, it is important to have two electrodes: a working electrode (sometimes called sensing electrode) and a reference electrode. In this section, we will try to make materials investigation to find the best material for pH sensing and the best deposition technique.
Various metal oxides have been proposed for pH sensing including Iridium oxide, RuO2, TiO2, PtO2, OsO2, Ta2O5, SnO2 and RhO2 (Muaz et al., 2015). As literature suggests (Huang, 2010), IrOx is the best-adapted material for pH sensing. In fact, PtO2 and Ta2O5 can only be used for pH range from 5 to 10; redox cation interference is reported on OsO2, TiO2, RhO2, PtO2 and RuO2; SnO2 presented calibration issues due to drift problems and unstable responses. However, IrOx offered high thermal and chemical stability over wide pH ranges, rapid responses, and high durability. For those reasons, Iridium oxide has been proposed to be one of the best pH sensing materials (Huang, 2010). Concerning the reference electrode, we will use the well-known Ag/AgCl, it produces a standard electrical potential that remains the same in different pH range. In this section, we will briefly introduce the mechanism involved in pH sensing, and make a preliminary material investigation.
2.2 pH Sensing Mechanism of Iridium Oxide
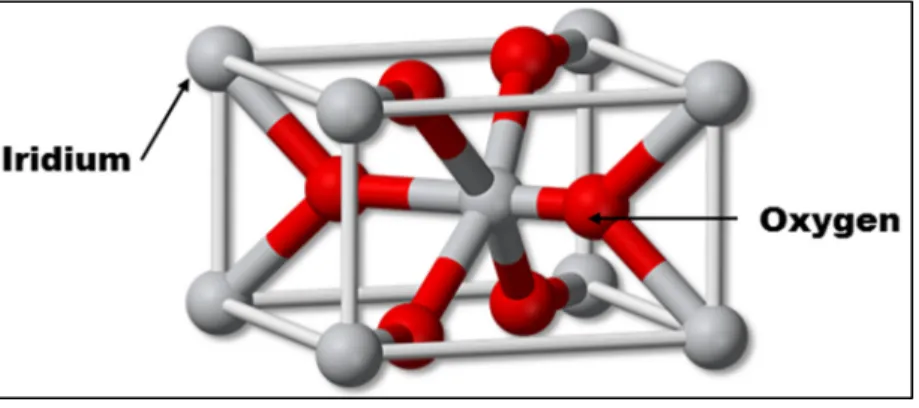
Since the 1970s, iridium oxide became a topic of interest in material science for its remarkable chemical, electrochemical and physical properties. In fact, the iridium (Ir) is a noble metal; iridium oxide has a rutile structure shown in figure 2.1; for this reason, it has shown very high resistance to aggressive chemical reagents such as strong acids; it is stable at all pH levels, etc. IrOx has become the best material for pH measurements in different fields such as biomedical, food industry, environmental and so forth (Huang, 2010).
Figure 2.1 Rutile structure
According to literature, at atmospheric pressure and 25ºC, iridium can absorb over 800 times its own volume of hydrogen. IrOx has a low-temperature coefficient and is one of the few naturally highly conductive oxides; for those reasons it provides a stable and rapid response. The pH response of the iridium oxide electrode is attributed to Ir(IV)/Ir(III) redox transitions which can be illustrated as follows (Huang, 2010):
Ir(IV) oxide + n + q ↔ Ir(III) oxide + p O (2.1)
2 + 3 O ↔ + 6 + 6 (2.2)
+ 2 O ↔ Ir + 4 + 4 (2.3)
2 Ir + 2 + 2 ↔ + O (2.4)
The transition effect between two oxidation states Ir2O3 and IrO2 leads to a pH dependent potentiometric response (Huang, 2010):
V (Sensing electrode) = 2,303 × × × (2.5)
To be able to measure the sensing electrode response, we need a reference electrode which has a potential independent of pH or temperature; it is called standard potential. In this case, the
13
pH sensor response is the differential potential between the reference electrode and the working electrode; this response is called Nernst equation (Huang, 2010):
= ( ) − ( ) (2.6)
= − 2,303 × × ×
Where:
• E is the differential potential measured between the working electrode and the reference electrode (expressed in mV);
• E0 is the standard potential of the reference electrode (expressed in mV); • 2.303 is a constant obtained from Ln-to-Log conversion;
• R is the gas constant (with a value of 8.314, expressed in J/mol·K); • T is the temperature expressed in K;
• F is the Faraday’s constant with a value of 96,485 expressed in C/mol.
2.3 Different deposition techniques of Iridium oxide
According to literature, there are three known deposition techniques for Iridium oxide: Sol-gel (Huang et al., 2011), electrodeposition (Hu et al., 2009), and sputtering (Franklin et al., 2009). In this part, we will briefly describe and consider only the first two deposition techniques (Sol-gel and electrodeposition), because sputtering requires pure Iridium target (very rare material) which is expensive and we do not have it.
2.3.1 Sol-gel Deposition of Iridium oxide
Sol-gel deposition is a technique developed in the 1960s; the aim is to dissolve the desired compound in a solution to bring it back to a solid, in a controlled process. The sol-gel coating of Iridium oxide process usually consists of the following steps (Figure 2.2) (Huang, 2010) (Huang et al., 2011):
Figure 2.2 Sol-gel process
Step 1: The Iridium particles are dispersed in a solution, to prepare the solution we dissolved
1 gram of IrCl4 into 42 ml of Ethanol and 10 ml of Acetic acid, the solution was mixed for 2 hours at room temperature using magnetic rod stirring. The resulting solution (a stable dispersion of Iridium particles) has a dark-brown color;
15
Step 2: The substrate is dipped in the solution and is progressively covered by a coating
containing the desired material (Iridium);
Step 3: The particles in the solution are polymerized through the removal of the stabilizing
components (by evaporation) and provide a gel coat;
Step 4: Heat treatment removes the remaining organic components and oxidize the Iridium to
become IrOx. By using a programmable oven, we progressively increase the temperature with a rate of 1.5 °C/min, when it reaches 300 °C the temperature is kept stable at that value for 3 hours, and finally, it decreases progressively with a rate of 1.5 °C/min, until it cools down. Figure 2.3 shows the results of a Scanning Electron Microscopy (SEM) and Energy Dispersive Spectroscopy (EDS). The results confirm that we get a uniform Iridium oxide formation.
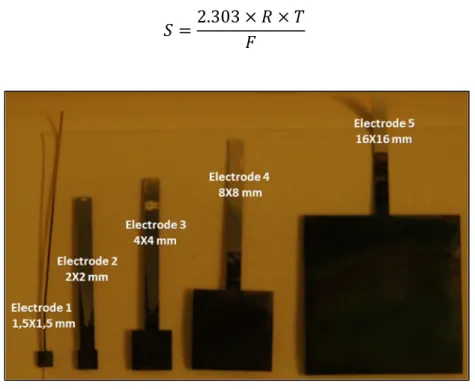
The most important parameter for the working electrode is its sensitivity (S) expressed in (mV/pH) as follows (Huang, 2010):
= 2.303 × × (2.7)
Figure 2.4 Different sized working electrodes
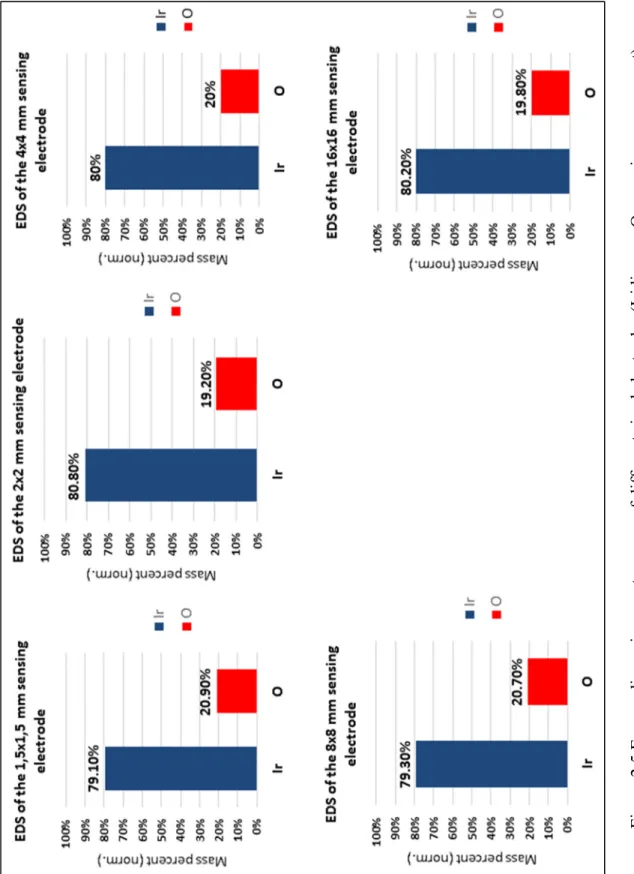
Our aim is to develop a miniaturized pH sensor. For this reason, it is important to study the effect of the miniaturization on the sensitivity. To do that, we prepared five different sized electrodes (figure 2.4) using the sol-gel process described previously. To study the effect of size, we have to be sure that all electrodes have the same properties: the same chemical composition, structure, etc. To be able to do that, all those electrodes were prepared at the same time in the same batch and exposed to the same parameters. In fact, they were made simultaneously using the same sol-gel solution and heated in the same oven at the same time. Then, we are sure that only the size of each electrode was different. To confirm that, we performed an Energy Dispersive Spectroscopy (EDS). According to the EDS analyses shown in figure 2.5, all electrodes have approximately the same chemical composition, only the size changes. Since only IrOx is involved in pH sensing (Huang, 2010); then, in this EDS analyze we setup the software to show only the ratio in mass percent of Iridium vs. Oxygen, and ignore other chemical elements such as Chlorine, Carbon, etc.
17
Figure 2.5 E
nergy dispersive spectroscopy of different
sized electrodes (Iridium vs
Figure 2.6 Nernst response of differe
nt sized working electrode vs. a comm
19
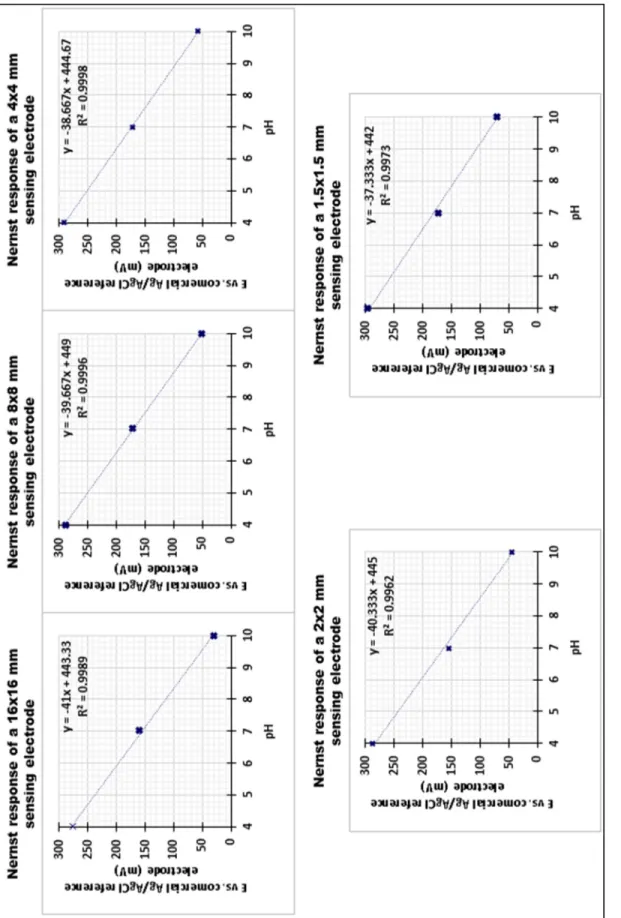
To calculate the sensitivity of each electrode we used three buffer solutions with a known pH; pH of 4.01(Acid), pH of 7 (Neutral) and pH of 10 (Alkaline). According to results illustrated in figure 2.6, the miniaturization does not have a significant impact on the sensitivity and all electrodes (Based on sol-gel) showed a Nernstian response. For this reason, iridium oxide is a good candidate for pH sensing. Using the Nernst response, we can extract the standard potential of the commercial reference electrode and the sensitivity of each sensing electrode (Table below).
Table 2.1 Sensitivity vs size
Sensing electrode
size Sensitivity at 19°C
standard potential of the commercial electrode 16x16 mm 41 mV/pH 443 mV 8x8 mm 39.66 mV/pH 449 mV 4x4 mm 38,6 mV/pH 444 mV 2x2 mm 40,33 mV/pH 445 mV 1.5x1.5 mm 37,33 mV/pH 442 mV
To characterize each sensing electrode, we used the same commercial Ag/Ag-Cl reference electrode. In literature, many people claimed that they get a sensitivity equal to 50-60 mV/pH using sol-gel deposition (Huang, 2010) (Huang et al., 2011). Initially we thought that we had achieved worse results; we get only 41 mV/pH but in reality, we have good results. In fact, according to the Nernst equation, the sensitivity is correlated with temperature as follows (Bhadra et al., 2013):
= 2,303 × × = × (2.8)
R and F are constant and known, so the sensitivity of the sensor is associated with the temperature: if the temperature increases the sensitivity increases too and vice versa (the reactivity of IrOx increases at a higher temperature and absorbs more H+ protons). We
measured the sensitivity at room temperature (On that day, it was 19°C. We did not control the temperature, we just used an external thermometer to measure it.) while others measured it at different room temperature 25°C. It had a significant impact. For instance, at 19°C, it was 41 mV/pH and at 25°C, it became 53 mV/pH.
Figure 2.7 Sensitivity of a WE based on sol-gel vs temperature
Figure 2.7 illustrates the sensitivity of a working electrode (WE) based on sol-gel deposition of IrOx at different temperatures. For this reason, a temperature sensor is generally used with commercial pH sensors to allow adequate compensation (Bhadra et al., 2013).
2.3.2 Electrodeposition of Iridium oxide
Electrodeposition is the application of a conductive coating to another conducting surface by an electrochemical process. The item to be plated is made the cathode of an electrolysis cell through which an electric current is applied. The article is immersed in an aqueous solution (the bath) containing the desired metal in a soluble form (as cations or as ions).
The anode is usually made from noble metal, such as Platinum. IrOx films can be formed by electrodeposition using a potentiostat (We used model 700E, CH Instruments, Austin, TX). Electrodeposition steps are illustrated in Figure 2.8 as follows (Hu et al., 2009):
21
Figure 2.8 Electrodeposition of Iridium oxide
Step 1: We prepared the Yamanaka solution at room temperature as follows. First, 70 mg of
for 30 minutes, followed by adding 0.5 ml of H2O2 (30%). After 10 minutes, 250 mg of oxalic acid dehydrates (C2H6O6 from Sigma-Aldrich) was added and the solution was stirred for another 10 minutes. The pH was then adjusted to 10.5 by slowly adding potassium carbonate (K2CO3 from Sigma-Aldrich). The resulting solution was left for four days to stabilize;
Step 2: To form the IrOx sensing film, the working electrode was electrodeposited using cyclic voltammetry (CV) feature of the potentiostat with a potential range of -0.8 V to +0.7 V and a scan rate of 0.1 V/s for 50 minutes. Electrodeposition activity which is illustrated in figure 2.8 shows that the current is increasing after each cycle this means that the thickness of electroplated IrOx is increasing too (IrOx has higher electrical resistance than Silver).
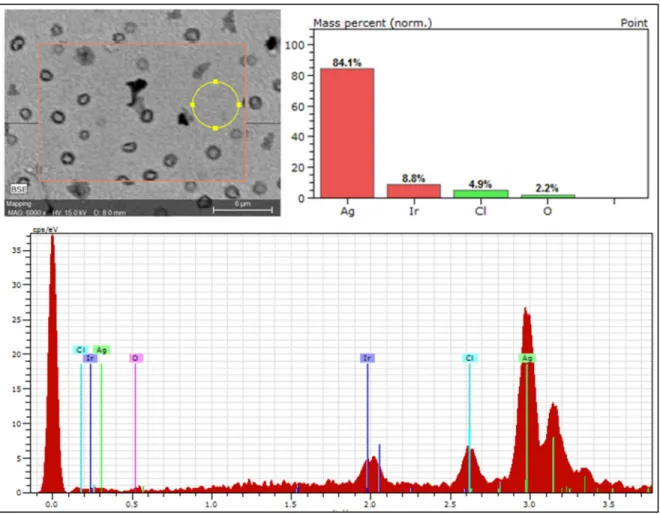
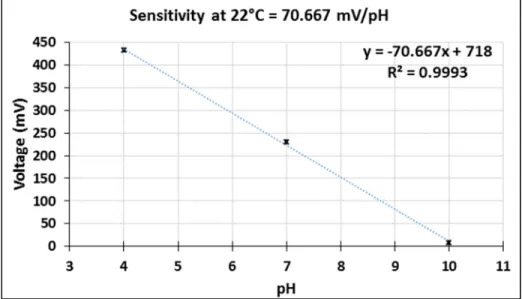
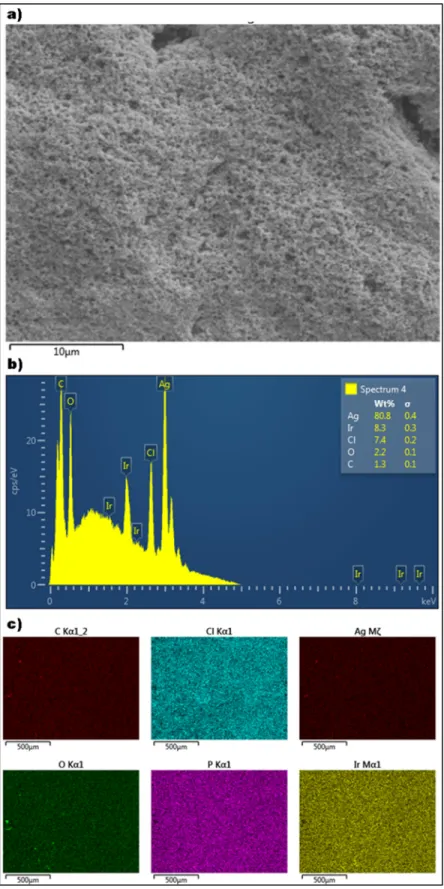
According to results illustrated in Figure 2.9, we get a linear response, better than the Nernstian response (Called super-Nernstian) with higher sensitivity. In fact, the sensitivity at room temperature (22°C at that time) was equal to 70.66 mV/pH. This non-Nernstian response slopes presented here is explained by the complexation processes in IrOx membrane (Miyake et al., 2012) We also performed a SEM and an EDS to confirm the formation of Iridium oxide; figures 2.10 (a) and (b) show a uniform deposition of IrOx. Figure 2.10 (c) shows a map distribution of each element. As we can see, we have a uniform distribution of Iridium and oxygen.
23
2.4 Conclusion
Thanks to its high thermal and chemical stability, Iridium oxide is one of the best materials for pH sensing. We have different deposition techniques; the following table (table 2.2) illustrates a comparison between the two methods: Sol-gel and electroplating. According to our characterization, the working electrode made by the first technique had a Nernstian response with a sensitivity equal to 45 mV/pH at 22°C, when the working electrode made by electrodeposition had a linear but non-Nernstian response with a higher sensitivity equal to 70.66 mV/pH at 22°C (Super-Nernstian response). Unlike sol-gel process which needs thermal treatment; electroplating is done at room temperature which eliminates heat stresses. Then, electroplating is a better deposition technique for IrOx.
Table 2.2 Comparisons between sol-gel and electrodeposition of IrOx
Deposition
technique Advantages Disadvantages
Sol-gel
• Maybe an alternative to electrodeposition if the last method is Incompatible.
• Nernstian response (Low sensitivity equal to 45 mV/pH at 22°C),
• Chemical process (use of solvents),
• Require heat treatment (generates heat stress), • Time consuming.
Electrodeposition
• Super Nernstian response with high sensitivity (71 mV/pH at 22°C),
• Done at room temperature, • Only two steps.
• Incompatible with thin electrodes (peel off during electrodeposition activity).
CHAPTER 3
pH SENSOR FABRICATION TECHNIQUES
3.1 Introduction
In the previous chapter, we found that IrOx is one of the best materials for pH sensing. Also, that electrodeposition is better than sol-gel. According to literature, we have many options to make a sensor, the most popular one for sensors are MEMS (Micro-Electro-Mechanical System), and LTCC (Low-Temperature Co-fired Ceramic) (Pietrikova, 2001). In this chapter, we will evaluate different fabrication processes, and try to select the best-adapted technique for the manufacturing of a miniaturized pH sensor targeting specific applications (Medical, food, enviremental monitoring). Selection criteria (feasibility, sensitivity, cost, simplicity, etc.) depends on the target application.
3.2 MEMS pH sensor
MEMS (Micro-Electro-Mechanical System), has been identified as one of the most promising technologies for the 21st century. It is a microfabrication technology similar to integrated circuits. The goal is to manufacture miniaturized components (can range in size from a few micrometers to millimeters). It offers many benefits that’s why it is commonly used to design sensors (such as pressure sensors, gyroscopes, etc.). For instance, microfabrication process enables the production of batch devices which reduces the cost and production time, also MEMS devices are more accurate, have lower power consumption and their small size facilitate their integration (Klaus, Paris et Sommer, 2016). To make the pH sensor there are three main steps:
Part 1: Design of electrodes (to design the electrodes, we used three different processes:
photolithography, sputtering, and lift-off.);
Part 2: IrOx deposition (Sensing electrode);
3.2.1 Photolithography
The photolithography is a photographic approach to transfer a pattern from a mask onto the surface of a substrate. A thin layer of a polymer, which is sensitive to ultraviolet (photoresist), is then deposited on the substrate by centrifugal force; The coated substrate is exposed to the ultraviolet transferring the pattern from the mask to the photoresist which is then developed in a way similar to the process used for developing photographic films. The radiated ultraviolet causes a chemical reaction in the exposed areas of the photoresist. There are two types of photoresist positive and negative. Positive photoresist is polymerized and strengthened by UV whereas negative photoresists are weakened. A developer is used to remove the weakened part and reveal the desired patterns (figure 3.1).
27
3.2.2 Sputtering
Sputtering is a process used to deposit very thin films of material onto a surface of a substrate. It is a physical deposition technique: it starts by the generation of a plasma and then the acceleration of ions from this plasma into the source material which is commonly called target. If the material is a metal; then, we use a direct current (DC) to generate the plasma if it is not; then, RF current is preferred. The arriving ions attack the target and eject neutral particles via energy transfer in the form of which will travel in a straight line unless they come into contact with the substrate which will be coated with a thin film of the source material. For our case, we deposited a thin layer of chromium 100 nm to allow a better adhesion of the second layer of silver 700 nm (known to be one of the best conductive material). Finally, we deposit 200 nm of gold known to be chemically inert (Figure 3.2).
3.2.3 Liftoff
We used Acetone to remove the photoresist; the material directly deposited on top of the substrate will remain, and the material sputtered in the upper part of the photoresist will be removed exposing the desired electrodes. (Figure 3.3).
Figure 3.3 Liftoff
3.2.4 IrOx deposition
Sputtering allows the deposition of very thin layers; Figure 3.4 shows that the thickness of our electrodes is 0.9 um. According to our investigation in chapter 2, electrodeposition offers a better sensitivity compared to gel deposition. For instance, at room temperature (22°C) sol-gel deposited IrOx has a sensitivity equal to 45 mV/pH; electrodeposited IrOx sensitivity is equal to 71 mV/pH.
29
Figure 3.4 Electrode thickness measurement
For that reason, first, we tried to deposit IrOx via electrodeposition. Unfortunately, the thickness of the sputtered electrode is not enough to support the electrodeposition activity, for instance, the sputtered metal peel off during this process (figure 3.5).
To overcome the problem encountered in electrodeposition; we tried sol-gel deposition as an alternative (explained in chapter 2); here too, we faced many difficulties:
• We first tried to use Lithography and Lift-off process to protect some area and deposit IrOx only in the desired areas; the problem is that we used solvents (Developer and Acetone) to remove the photoresist, but solvents will also remove the deposited gel containing Iridium; • To solve the problem, we used a laser-cutting machine to create a protective mask made from an electrostatic film; we aligned it manually then we deposited the gel containing Iridium. (manual alignment, reduce the precision);
• When the gel containing Iridium became dry, we removed the mask, and the batch of sensors was co-fired. The heat stress generated by the dilatation of different superposed materials (Kapton, Chromium, Silver, Gold, IrOx), created many cracks (illustrated in Figure 3.6).
Figure 3.6 Cracks formation due to thermal stress
Then, we have to admit that microfabrication technique (steps are shown in figure 3.7) is simply not well adapted to the two deposition techniques of IrOx (electrodeposition and sol-gel) then it is not the fabrication process for our pH sensor.
31
3.3 Laser micromachined pH sensor
To avoid the use of solvents, we developed a process (Figure 3.9) using infrared laser etching instead of chemicals:
Step 1: we cleaned and prepared the substrate; Step 2: we sputtering a thin layer of silver; Step 3: we designed the layout;
Step 4: we used a laser to etch and cut the electrodes;
Step 5: Sol-gel deposited iridium was then heat treated to transform it into IrOx (working electrode);
Step 6: Finally, we applied Ag/AgCl paste as a reference electrode.
With this technique we cut the electrodes before co-firing; then, we reduced the surface, doing so, we reduced heat stresses. As a result, (Figure 3.8) we get a uniform deposition of IrOx.
33
Figure 3.9 L
To calculate the sensitivity of this sensor we used three buffer solutions with a known pH; pH of 4.01(Acid), pH of 7 (Neutral) and pH of 10 (Alkaline). According to results illustrated in figure 3.10, we get a linear Nernstian response, in fact, the sensitivity at 19°C is equal to 40 mV/pH.
Figure 3.10 Laser micro-machined pH sensor response at 19°C
Compared to MEMS, this technique is simpler, faster, doesn’t need chemicals and is compatible with the sol-gel deposition but it is still not compatible with electrodeposition because of the thickness of the conductive layer (very thin). Then, this technique is suitable for flexible devices because sputtered conductive thin layer is flexible in opposition to thick traces.
3.4 LTCC based pH sensor
Low temperature co-fired ceramic (LTCC) technology has been used since the 1950s, especially for radio-frequency (RF) and high-frequency applications. Further, it also offers an excellent integration capability (up to 10 layers, feature size can be 15 µm) to reduce the entire device size compared with systems based on printed circuit boards (PCB). For instance, it allows for the production of three-dimensional structures while providing integration with sensors and electronic components in the same ceramic substrate (Pietrikova, 2001). As Au and Ag's metal traces are used, providing enhancements in conductor thickness compared to sputtering.
35
Figure 3.11 LTCC p
H
We used two DuPont’s 951AT layers as a substrate, and all steps followed an industry-standard LTCC fabrication chain (figure 3.11). The first step was to prepare the mask. Next, the traces were printed using a mask and DuPont’s silver paste. A laser-cutting machine was used to create a testing chamber. The two layers were aligned using a high-precision aligner and pressed together using hydraulic pressure. Finally, the batch of sensors was separated using a guillotine and the resulting laminated circuit was co-fired.
Further, since the thickness of the printed conductor (shown in figure 3.12, is equal to 9.955 um) is significantly greater than those formed by other methods, such as sputtering (0.9 um); then, LTCC is convenient with both sol-gel and electrodeposition of IrOx. Knowing that electrodeposition allows a better sensitivity; then, we chose this last method.
37
Figure 3.13 a) SEM image, b) ED
S analyses, c) Map distrib
To form the IrOx sensing film, the WE was electrodeposited using cyclic voltammetry (CV) feature of the potentiostat with a potential range of -0.8 V to +0.7 V and a scan rate of 0.1 V/s for 50 minutes. Figure 3.13 shows the results of a Scanning Electron Microscopy (SEM) and Energy Dispersive Spectroscopy (EDS). The results confirm that we get a uniform Iridium oxide formation. To reduce costs and time, as well as to obtain a compact size of the system compared with those using the glass RE electrode, our RE was simply printed using the Ag/AgCl paste.
Figure 3.14 LTCC pH sensor calibration at room temperature
We used five different solutions with pH values of 4, 5, 7, 8.8 and 10 to calibrate our pH sensor, at room temperature. Buffer solutions with pH of 10, 7 and 4 were purchased from Fisher Scientific, while the ones with pH of 5 and 8.8 were made in house using DI water and buffer solutions. The pH values were determined using a commercial pH meter (SPER Scientific). The calibration results were plotted in figure 3.14, showing a super-Nernstian response with the sensitivity slope of 71 mV/pH. The response was also highly linear (R2 = 0.9988).
39
3.5 Conclusions
Microfabrication technique (MEMS) is simply not adapted for the two deposition techniques of IrOx (electrodeposition and sol-gel). In fact, heat treatment generates heat stresses, resulting in the formation of cracks. Also, the use of solvent dissolves the coating during sol-gel. Then, this technique is not a convenient fabrication process for our pH sensor. In terms of simplicity and cost, laser micro-machined pH sensor is a good option; except the fact that, sputtered thin conductor cannot support electrodeposition activity. Then, it is only compatible with sol-gel deposition (Electrodeposited IrOx have a better sensitivity than sol-gel deposited IrOx). LTCC proved to be the most suitable fabrication technique, in fact, it allows a better integration and miniaturization; it is compatible with both electrodeposition and sol-gel deposition of IrOx, and it allows batch production which reduces costs. (Table 3.1 resumes the main advantages and disadvantages of each fabrication technique).
Table 3.1 Comparison of different fabrication techniques
Fabrication
technique Advantages Disadvantages
MEMS pH sensor
• High integration (Precision 10 um).
• Incompatibility with sol-gel deposition due to the use of solvents,
• Heat stresses are generated during heat treatment (cracks formation),
• Sputtered electrodes are very thin and did not resist to electrodeposition activity (they peel off).
Laser micromachined
pH sensor
• Precision 15 um, • Very simple and fast,
• Allow batch fabrication (Low cost),
• No chemicals,
• Uniform sol-gel deposition, • Sputtered electrodes are very
thin (sensor may be flexible if the substrate is also flexible).
• Sputtered electrodes are very thin and did not resist to electrodeposition activity, they peel off (not compatible with electrodeposition), • Only one-layer schematic
design.
LTCC pH sensor
• High integration, • Multilayer 3D design,
• Allow batch fabrication (Low cost),
• Printed traces are thick, so it is compatible with both sol-gel and electrodeposition of IrOx.
• Not flexible,
• Ceramic contain some traces of plumb (incompatible with in vivo medical applications).
CHAPTER 4
NOVEL MINIATURIZED WIRELESS pH SENSING SYSTEMS
4.1 Introduction
In the previous chapter, LTCC proved to be the best fabrication technique. In fact, it offers an excellent integration capability to overcome the size constraint. For instance, it allows the production of three-dimensional structures while providing integration with sensors and electronic components in the same ceramic substrate. The technology also helps improve the performance and reliability as well as reduce the cost. We proposed and developed a novel miniaturized LTCC based wireless pH sensing system which could be used for several applications aiming for environmental or food-safety monitoring purposes.
4.2 Miniaturized wireless LTCC based pH sensing device 4.2.1 Circuit and layout design
The pH sensor act as a small battery (producing a potential proportional to pH level). The output signal is included between -0.5V and +0.5V. Many analog-digital converters (ADC), which are embedded in low-cost microcontrollers, are monopolar and read a potential range from 0V to 3V. To use the ADC in full scale and get the best resolution, we amplified the signal using the LMP7721 amplifier which is typically designed to be the conditioning circuit for pH sensors. To get a monopolar signal from the LMP7721; the input needs to be offset. To transform the bipolar signal (produced by the pH sensor) to a monopolar signal, we used the REF3312 as a voltage reference to offset the reference voltage from 0V to +0.5 V. Then the output of the pH sensor (after the conditioning circuit) will be between 0V and 3V. The sensor part consists of two electrodes with the size of 1×1 mm2 each. Figure 4.1 shows the circuit schematic and the designed layout of the pH sensing device.
Figure 4.1 a) Sensing device sche
matic; b) Sensi
43
4.2.2 Integration
We used four DuPont’s 951AT layers as a substrate, and all steps followed an industry-standard LTCC fabrication chain (Figure 4.2). The first step was to form via holes using a punching machine, which was then filled with conductive paste. Next, the traces were printed using a mask and DuPont’s silver paste. A laser-cutting machine was used to create a testing chamber and access to contact pads for soldering surface-mount device (SMD) components. All layers were aligned using a high-precision aligner and pressed together using hydraulic pressure. Finally, the batch of sensors was separated using a guillotine or laser cutting for better precision, and the resulting laminated circuit was co-fired. To form the IrOx sensing film, the WE was electrodeposited using cyclic voltammetry (CV) feature of the potentiostat with a potential range of -0.8 V to +0.7 V and a scan rate of 0.1 V/s for 50 minutes.
In the previous chapter, we showed that electroplating is not compatible with a thin layer of the conductor, in fact, the sputtered conductor (MEMS, laser etching) peeled off during the process, and only thicker printed silver (LTCC) was able to support electroplating.
To reduce costs and time, as well as to obtain a compact size of the system compared with those using the glass RE electrode, our RE was simply printed using the Ag/AgCl paste during the serigraphy process of the LTCC chain. Further, since the thickness obtained by this method is significantly greater than those formed by other methods, such as electroplating, our sensor is more durable and reliable. And finally, all SMD components were soldered.
LTCC fabrication is a great option for industrial mass production, in fact, it allows the production of 50 sensors in the same batch. For LTCC the most time-consuming step is the co-firing (8 hours), but it is possible to get around it using an industrial oven (able to fire more than 20 batches at the same time). To validate the design and demonstrate the repeatability, we designed two similar pH sensors, and we measured their response simultaneously (Blue plot is the response of sensor 1, and the yellow plot is the response of sensor 2). The results shown in figure 4.3 indicate that our integrated device provides fast responses (3 seconds) with excellent repeatability.
Figure 4.2 L
T
45
.
4.2.3 Wireless user interface
Figure 4.4 Block diagram
For a proof of concept, we used modular approach (Sensing device and communication part are separated). Future work may integrate them in the same substrate. For the communication part, we used the wireless module EZ430-RF2500 (Texas instrument). It is a complete development tool for the ultra-low power with embedded MSP430 microcontroller and CC2500 2.4 GHz wireless transceiver.
47
This module offers a good communication range, up to 35 m in normal conditions. Any other wireless communication module can be used (Bluetooth Low Energy, ZigBee, etc.). Figure 4.4 illustrates the block diagram of the entire wireless pH sensing system. A graphical user interface (figure 4.5) was developed using Visual Studio to display and store data in an Excel file. We used five different solutions with pH values of 4, 5, 7, 8.8 and 10 to calibrate our pH sensor, at room temperature. Buffer solutions with pH of 10, 7 and 4 were purchased from Fisher Scientific, while the ones with pH of 5 and 8.8 were made in house using DI water and buffer solutions. The pH values were determined using a commercial pH meter (SPER Scientific).
Figure 4.6 Real-time pH testing of our system
We introduced the pH solutions into the testing chamber, and we recorded the voltage values. The results show that our IrOx film formed by CV is among the best for sensing pH (71 mV/pH) compared to those obtained by conventional methods with a sensitivity of 50-60 mV/pH. Assuming interferences are Gaussian, the limit of detection (LOD) can be evaluated as 3 times of the standard deviation of the baseline. Through the data we obtained, a LOD of ~0.054 was determined. Figure 4.6 demonstrates the device capability in wireless sensing pH in real time.
4.3 Other prototypes
LTCC proved to be the most suitable fabrication technique, in fact, it allows a better integration and miniaturization; it is compatible with electrodeposition of IrOx, and it allows batch production which reduces costs. Then it is suitable for environmental and food quality monitoring applications. However, LTCC has few limitations (As shown in the previous chapter), for instance, it is not flexible, ceramic is breakable, and it is not biocompatible (it contains traces of plumb). For those reasons, LTCC is not suitable for few applications where flexibility, biocompatibility, and robustness are required. So we developed other prototypes: • Flexible pH sensing device (flexibility);
• Glass based microfluidic pH sensing device (biocompatibility).
Unlike LTCC devices, we did not make the pH measurement for these (lack of time and we made only one prototype of each), we just proved the fabrication feasibility.
4.3.1 Flexible pH sensing device
We already explained in chapter 1 that pH is an important factor in tissue regeneration. Then, it is possible to monitor a burn or wound healing and detect the presence of bacteria by incorporating pH sensor into smart bandages (Shorrock et al., 2000). Here comes one potential use of our flexible pH sensor (described and characterized in chapter 3). To prove the feasibility, we designed a flexible pH sensing device including a miniaturized pH sensor (1x1mm2) and required electronics (amplifier, offset, etc.). The prototype was designed using a similar technique described in chapter 3. The process is shown in figure 4.7. Step 1: we prepared the layout; step 2: we sputtered silver; step 3: we laser etched and cut the desired patterns; step 4 we deposited IrOx via sol-gel; step 5: we deposited Ag/AgCl paste as a reference electrode, and finally we soldered SMD components. We used Kapton as a substrate which is a flexible and biocompatible polyimide film, which remains stable across a wide range of temperatures, from −269 to +400C. It is used in, among other things, space instruments, flexible printed circuits (flexible electronics), etc.
49
Figure 4.7 F
lexible pH sens
4.3.2 Glass based microfluidic pH sensing device
As discussed in chapter 1, an accurate pH value detection in real time is of keen interest in a significant number of medical applications. For instance, the blood circulating through our body should have a pH balanced between 7.35 and 7.45. Exceeding this interval by as little as 0.1 of a pH could be deadly. Some patients with kidney problems are forced to use a dialysis machine to clean their blood: a micropump is forcing the blood thru filters to clean it and then reinject it back to the body, actually, the pH of the blood (very important parameter) is not monitored in real time during dialysis.
The only advantage of glass compared to LTCC is biocompatibility: due to the presence of plumb (according to DuPont’s 951AT datasheet), LTCC is not biocompatible. So, we developed a glass-based microfluidic pH sensing device to prove the feasibility of a miniaturized glass based pH sensing device targeting potential microfluidic applications (The pH of a fluid can be measured in a closed loop thru the microfluidic channel). We saw an opportunity to improve existing dialysis machines, we thought about adding this pH sensing device which is potentially capable of measuring the pH level of blood in real time and in a closed loop. According to literature, we know that there is a correlation between the pH level of blood and kidney dysfunctionality. Due to lack of time and also because we have only one prototype, then we only made a proof of concept, to prove the feasibility; but, without making a test with blood. The fabrication chain is illustrated in Figure 4.8 as follows: Step 1: we etched 1x1mm2 cavity for each electrode using a controlled laser beam; then, we sputtered a thin layer of silver. Step 2: we laser etched the desired layout. Step 3: we deposited IrOx via sol-gel to form the sensing electrode, and Ag/AgCl to form the reference electrode. Step 4: SMD components were soldered. Step 5: using a controlled laser beam we etched a microfluidic channel and we also etched cavity to fit with SMD components. And finally, step 6: the two pieces obtained in steps 4 and 5 were stuck together (a biocompatible glue could be used). Doing so, SMD components are hermetically sealed, and a liquid solution can circulate thru the microfluidic channel; in contact with the pH sensor.
51
Figure 4.8 Microfluidic glass base
d miniaturized pH
Figure 4.9 illustrate the system block diagram of a blood pH monitoring system. Many other sensors could potentially be added such as arterial pressure, salinity, etc. Our device is designed to monitor pH level in real time wirelessly. The fluid (blood) could circulate in a closed loop which eliminates coagulation and infectious risks.
53
4.4 Conclusion
LTCC proved to be the most suitable fabrication technique, in fact, it allows a better integration and miniaturization; it is compatible with the electro-deposition of IrOx, and it allows batch production which reduces costs. Then it is suitable for environmental and food quality monitoring applications. However, LTCC has few limitations. For instance, it is not flexible, it is breakable, and it is not biocompatible. For those reasons, LTCC is not suitable for few applications where flexibility and biocompatibility are required. Then, other substrates (we showed some examples such as Kapton, Glass, etc.) could be used as an alternative. We used modular approach (Sensing device and communication part are separated), future work may integrate them in the same substrate. It is a battery-based solution; battery-less may be a great option for better miniaturization, and sanitization. Due to biocompatibility, infections and size concerns, the need for wireless and battery-less is evident, especially for medical devices. A new expectation raises for those devices, in fact, power becomes an essential issue.
CHAPTER 5
WIRELESS POWER TRANSFER FOR BATTERY-LESS APPLICATIONS
5.1 Introduction
In chapter one we mentioned that pH measurement is knee interest for many medical applications (For example: analyzing the pH of blood, wound, and gastric fluid). Due to biocompatibility and size concerns, there is an urgent need for wireless and battery-less, especially for medical devices which have been utilized for years to improve healthcare, helping or replacing functions of certain organs. They can be employed for diagnosis, prognosis, and/or treatment. Nowadays, numerous chronic diseases have been targeted with the uses of IMDs throughout the body, from the brain, cochlea, retina to heart, lungs, knee joints and even vessels, esophagus, and bladder.
With the development of technologies in the last decade, healthcare has been changed in several aspects. Nano, micro and wireless technologies have transformed medical diagnosis, monitoring, and intervention to individualized care. Self-care, e-care, and mobile-health have been emerged changing traditional roles of doctors and patients. A new expectation raises for medical devices; for instance, they need to be battery-less and wirelessly communicate with external units for real-time tracking and sensing, diagnosis and treatment.
Nikola Tesla is the first person who had a vision of wirelessly distributing power over long distances through the air (Tesla, 1914). Today, after over a century, many devices are already using wireless charging, for instance: electric teeth brush, Mp3 players, smartphones, etc. Power became an essential issue, not only for biomedical devices but also for other applications. Therefore, we take a more general approach to wireless power transfer. In this chapter, we will try to prove the feasibility of wireless power transmission and focus on the design and optimization of an efficient Wireless Power Transfer (WPT) setup (Transmitter antenna and different receiver antennas).