HAL Id: emse-03128271
https://hal-emse.ccsd.cnrs.fr/emse-03128271
Submitted on 2 Feb 2021
HAL is a multi-disciplinary open access archive for the deposit and dissemination of sci-entific research documents, whether they are pub-lished or not. The documents may come from teaching and research institutions in France or abroad, or from public or private research centers.
L’archive ouverte pluridisciplinaire HAL, est destinée au dépôt et à la diffusion de documents scientifiques de niveau recherche, publiés ou non, émanant des établissements d’enseignement et de recherche français ou étrangers, des laboratoires publics ou privés.
REQUIREMENTS IN A HEALTHCARE CENTER
USING DATA-DRIVEN DISCRETE-EVENT
SIMULATION
Jules Le Lay, Vincent Augusto, Xiaolan Xie, Edgar Alfonso-Lizarazo,
Bienvenu Bongue, Thomas Celarier, Regis Gonthier, Malek Masmoudi
To cite this version:
Jules Le Lay, Vincent Augusto, Xiaolan Xie, Edgar Alfonso-Lizarazo, Bienvenu Bongue, et al.. IM-PACT OF COVID-19 EPIDEMICS ON BED REQUIREMENTS IN A HEALTHCARE CENTER USING DATA-DRIVEN DISCRETE-EVENT SIMULATION. Winter Simulation Conference, Dec 2020, Orlande, United States. �emse-03128271�
K.-H. Bae, B. Feng, S. Kim, S. Lazarova-Molnar, Z. Zheng, T. Roeder, and R. Thiesing, eds.
IMPACT OF COVID-19 EPIDEMICS ON BED REQUIREMENTS IN A HEALTHCARE CENTER USING DATA-DRIVEN DISCRETE-EVENT SIMULATION
Jules Le Lay Vincent Augusto
Xiaolan Xie
Center for Biomedical and Healthcare Engineering CNRS, UMR 6158 LIMOS
Mines Saint-Etienne, Univ Clermont Auvergne Saint-Etienne, F - 42023, FRANCE
Edgar Alfonso-Lizarazo
LASPI, EA3059
Universit´e de Lyon, Univ Jean Monnet Saint- ´Etienne Saint- ´Etienne, F-42023, FRANCE
Bienvenu Bongue
Universit´e Jean Monnet, Chaire de sant´e des ain´es, Centre Technique d’Appui et de Formation
des Centres d’Examens de Sant´e (CETAF) Saint-Etienne, 42000 FRANCE
Thomas Celarier Regis Gonthier
Department of clinical gerontology University hospital, University Jacques Lisfranc
Saint-Etienne, 42000, FRANCE
Malek Masmoudi
Faculty of Sciences and Techniques
Universit´e de Lyon, Univ Jean Monnet Saint- ´Etienne Saint ´Etienne, 42000, FRANCE
ABSTRACT
Bed occupancy ratio reflects the state of the hospital at a given time. It is important for management to keep track of this figure to proactively avoid overcrowding and maintain a high level of quality of care. The objective of this work consists in proposing a decision-aid tool for hospital managers allowing to decide on the bed requirements for a given hospital or network of hospitals on a short-medium term horizon. To that extent we propose a new data-driven discrete-event simulation model based on data from a French university hospital to predict bed and staff requirements. We propose a case study to illustrate the tool’s ability to monitor bed occupancy in the recovery unit given the admission rate of ED patients during the pandemic of Sars-Cov-2. These results give an interesting insight on the situation, providing decision makers with a powerful tool to establish an enlightened response to this situation.
1 INTRODUCTION 1.1 Context
The management of key resources in healthcare centres has become a crucial matter for decision makers of the hospital. In particular, the bed occupancy ratio of a service is a useful performance indicator for the hospital. It is essential for caregivers to keep a small number of beds available to address emergencies while having too much unoccupied bed shows that the service is in overcapacity. A relevant management of beds will also have advantages for the patient, as it will improve the quality of care at the hospital and reduce the inpatients mean waiting time. The number of unoccupied beds to keep is the element in which management can rely to be responsive when unexpected events occur, such as the failure of a key device, or the departure of a surgeon. Other factors can impact the hospital attendance, like seasonality (epidemics such as flu in winter or heat waves in summer) or more persistent factors like the ageing of the population. Before defining those figures it is essential to have a mid-term vision on the patients attendance to the hospital. The administration staff of the hospital needs to know the number of beds required to state on annual closing of beds during holidays or on the exceptional opening of extra beds for emergent patients. Industrial engineering and operational research approaches have been widely used to predict bed occupancy in hospital, and Discrete-Event Simulation (DES) have proven useful to manage resources in a process analysis. In this paper, we describe the development of a DES tool designed to predict bed occupancy ratios for a healthcare center taking into account the history of patients’ attendance over the past years and predictions of future arrivals.
1.2 Related Work
The analysis of patients’ stays in hospital is extensively covered in the literature. Predicting the attendance in a healthcare delivery structure allows managers to become proactive regarding resource management decisions. Forecasting models like time-series have been developed by (Farmer and Emami 1990) to give health service planners this opportunity. Numerous analytical models were designed as decision support systems. For instance short-term bed occupancy can be predicted using autoregressive integrated moving average according to (Abraham et al. 2009). Regression techniques also give good results (Kumar et al. 2008) when predicting short-term bed demands for several classes of beds. Similarly (Tan et al. 2019) implemented Principal Component Analysis and Multiple Linear Regression methods to alert an Emergency Department (ED) of bed crunching risk on the short-term.
Beyond analytical prediction, simulation models have proven to be useful for modelling the patients’ flow and a decision’s impact on a healthcare system. For instance, queuing networks have been used by (El-Darzi et al. 1998) to understand the behavior of bed blockers in a geriatric department. Complete hospitals models are quite rare and researchers often focus on a department in particular. For instance, (Chavis et al. 2016) studies the impact of a post-emergency unit on ED patient’s length of stay. Indeed, EDs are probably the most studied department using simulation. A review done by (Salmon et al. 2018) counts 254 journal or conferences publications and thesis using simulation to model ED between 2000 and 2016, with DES being the most used technique. Other techniques, like system dynamics (SD) or agent-based modelling (ABM) are more used when considering the interactions between ED and exterior factors. (Cabrera et al. 2011) modelled a Spanish ED with ABM to better characterise the operations of a complex system and (Chong et al. 2015) uses SD for its ability to account for the complex behaviour of such a service. However, when looking at the whole simulation area, (Brailsford et al. 2019) notes that models combining different techniques are becoming more and more popular.
Building a model of the hospital as a whole is a challenge. The model proposed by (Ben-Tovim et al. 2016) simplifies the hospital’s organisation to do so. The authors grouped together the ward into one unit, and did the same with surgical theatres. In (Busby and Carter 2017), DES is used to detail the links between ED, inpatients wards and surgical theatres. Such models are conceived to be generic and applicable to many hospitals.
1.3 Objective and Scientific Contribution
The objective of our work consists in proposing a decision-aid tool for hospital managers, allowing them to decide on the bed requirements for all medical units of a given hospital on a medium term horizon, using past hospitalization data such as medico-administrative data. The main contribution consists in the development of a data-driven DES model, allowing the user to test different resource scenarios and observe their consequences on bed occupancy prediction. The prediction of arrivals and length of stays will be done analytically and then passed to the simulation model. This model can be set up in different ways, to visualize the departure of a key resource at a precise time like the retirement of a surgeon, or a sudden influx of patients due to an unexpected epidemic. The scientific challenges are twofold:
• The model should consider all medical units: such tool is relevant if patient transfers are taken into account.
• The model should be fed with patient traces extracted from hospital data history to take into account patient’s journey complexity. To do so we use a data mining approach to extract past patient traces that will be replayed in the model.
This paper is organised as follows. In Section 2 we present the modelling approach to create the forecast log and the simulation model. In Section 3 we present the results of the different experiments we ran. The analysis regarding those results are detailed in Sections 4. Conclusions and perspectives are given in Section 5.
2 MODELLING APPROACH
2.1 Modelling Hypothesis
The main objective of this paper consists in providing a simulation-based decision aid tool for hospital manager. This tool will help decide on bed allocation in a medium term horizon (next few months). The following hypothesis are taken into account:
• H1: A macroscopic model of the hospital is used. The lowest level of detail is the stay in a medical unit by a patient. To that extent, the patient journey in the hospital is modelled as a trace of stays in different medical unit between his/her admission and his/her discharge. Peripheral activities, such as transfers, tests and surgeries, are not explicitly modelled.
• H2: We consider staffed-beds for resources. Each medical unit of the hospital has a predefined number of staffed-beds available. Human resources requirements are extrapolated from bed requirements. • H3: We consider that patients spending less than a day in a medical ward are not occupying a bed. Indeed our main data source gives the length of stay of patients in days, causing wards with a low mean length of stay to be very easily overcrowded.
This model considers two main sources of patients:
1. Elective admissions patients. These are the patients already scheduled in the next few months. 2. Non elective and emergent patients. Such patients are admitted through the Emergency Department
(ED) of the hospital, or directly in a medical unit under recommendation of the general practitioner or emergency services (e.g., Covid patients who are directly admitted in dedicated units).
For elective admissions patients, the model is fed using available data in the information system of the hospital. For non elective patients, we do not have any information apart from the previous admission. To model such patients, we build a case-mix of previous emergent patients and pick up randomly patients in this case-mix.
2.2 Formal Model 2.2.1 Patients
We decided to divide the admissions into 2 groups: (i) patients admitted directly into a ward, and (ii) patients admitted through the Emergency Department. We considered patients of the first group as being “planned” by the hospital: although their origins are varied, direct admission show that these pathways are under control. On the other hand, patients admitted through the ED are managed on the run and the medical staff is reacting to their pathologies. The information available through the patient record are the following:
• Anonymous patient identifier,
• Wards in which the patient have been admitted, • Date of admission in each ward,
• Length of Stay (LoS) in each visited ward, • Admission modalities and provenance.
From this we computed each patient’s trace in the hospital, defined as the chronological succession of wards visited by a patient during his stay at the hospital.
We divided the available data in two subsets, patients admitted to the hospital through the ED (urgent patients), that we will be referring to as Data-set 1, and elective patients, similarly Data-set 2. We used those data-sets to compute several inputs for our simulation.
2.2.2 Medical Units
Medical Units (MU) are modelled as agents and their characteristics as parameters. Two kinds of parameters are used: constants giving information about the existing MU such as the capacity of the ward, and variable parameters used to keep track of the bed and staff demand. When a patient is admitted to a new ward, the ward’s occupancy is incremented. The needed staff - doctors, nurses, and caregivers - is calculated by multiplying the occupancy by a theoretical ratio. Those ratios are given by a classification of wards established with health professionals.
2.2.3 Hospitalization Process Model
In our process, we use different sources for each patient type (elective and urgent). Following our hypothesis H1, the model is macroscopic, thus all medical units are modelled by a single delay block on AnyLogic. The only exception to this rule is the Emergency Department, which is placed after the urgent patient source. The patient is routed again to the unit’s block if his stay is not finished, creating a loop on the medical unit block. When the stay is over, and all the medical units constituting the trace have been visited, the patient is discharged.
To account for the limited number of beds available, we designed a queuing process. A list of similar services was conceived for each unit. If the medical unit needed by the patient is full, we try to reroute the patient toward these services. The patient waits until a bed is available in a suitable unit. If no bed have been found after a week in the targeted services, the patients is routed to an unoccupied bed in a randomly chosen ward. This abusive choice is made in order to avoid the simulation from being blocked by an endless accumulation of patients. In similar situations, doctors would change the patient destination to ensure the care.
A poll of traces followed by emergency patients admitted during the first semester was created using the Data-set 1. This poll is used as a basis for the admissions of generated urgent patients, each generated agent will be randomly assigned a trace from this poll. We calculated admission rates for each day of the week from the daily number of admission in 2017/2018.
In the final version of our model, planned admissions will be entered in the simulation from the hospital’s information system. However in the experiment presented here, we used the 2018 patients in Data-set 2 to create the elective patients’ admission log.
3 EXPERIMENTS AND RESULTS
Our objective is to assess the efficiency of bed-allocation policies in response to predefined situations. After assessing the consistency of the model with the hospital normal activities, we will consider two different scenarios. An increase of arrivals through the Emergency Department and the sudden arrival of patients positive to Covid-19. The Covid+ patient pathway is described here-under.
3.1 Case Study
This project is a collaboration with Saint- ´Etienne’s University Hospital (CHUSE). This hospital is composed of 1,795 hospitalisation beds, in 60 departments, located on 3 different geographical sites across the city. It is also the heart of a large territory healthcare network (Groupement Hospitalier de Territoire Loire in French). This large group of healthcare centres is designed to pool the hospitals’ resources and facilitate the coordination of care inside a territory.
In this study we excluded the paediatric sector as it is managed independently from other services. The main preoccupation of the hospital is the prediction of the bed demand on the medium term, which could help to predict the impact of unexpected events or policies on bed occupancy levels.
Our objective with this simulation is to provide the hospital with a decision-aid tool. Nowadays, decisions of bed allocations or seasonal bed reductions are based on experience, demands from medical wards or financial perspectives. This visualisation tool will allow the hospital to centralise admission previsions and see how these policies impact the patient’s flow. In the actual context of pandemic, we decided to focus on recovery and intensive care units that are facing an unpredicted surge of patients. 3.1.1 Parameters of the Studied Hospital
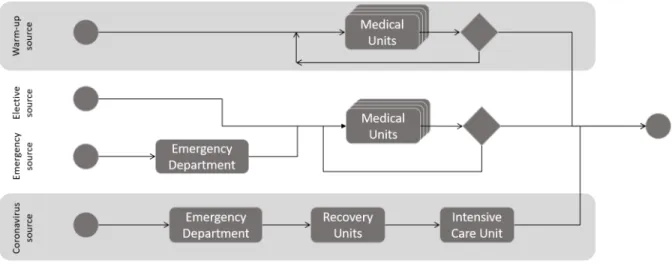
The layout of the model is displayed in Figure 1. We used four independent sources to generate patients. ED and MU are modelled by delay blocks, the occupancy of each ward is calculated by incrementing the corresponding parameter.
As explained in 2.2.3, two sources generate urgent and elective patients. ED LoS is modelled by by triangular distribution with a mean of 6 hours. Elective and urgent patients are served by the same MU block. LoS for each patient is calculated with probability distributions specific to the ward. Using Arena Input Analyzer software we fitted probability distributions and the corresponding parameters for each MU. Another source is generating warm-up patients. All patients admitted to the CHUSE in 2018 and still present on the 1st of January 2019 are generated using this source to initialise the simulation. Pathways and lengths of stay in each MU are directly used in the simulation. These patients go through a MU block with fixed LoS passed as patient’s parameters.
The last source generates Covid-19 patients. Their pathway is fixed, they are admitted to the general recovery unit after a short ED stay. The LoS in this MU is determined by a normal law with a 12 days mean and a standard deviation of 3 days. This is a rough approximation based on discussions with professionals and preliminary data. 10% of the patients are discharged to account for in-hospital mortality. Others are redirected to an intensive care units for a similar time. We consider that after this ICU stay, the patients are discharged from the hospital.
Figure 1: Hospitalization process model representation. 3.2 Data
The data was extracted by the Department of Medical Information of the CHUSE. It includes all patients admitted to an adult care unit and discharged during the years 2017 and 2018. We also have the daily bed openings in 2018 for each ward to complete the model.
We used the data (Sant´e Publique France 2020) regarding patients admitted to a recovery unit in the Loire department for coronavirus with respiratory complications from 03/18/2020 to 04/20/2020. We decided to set the upper bound for arrival rate to 10 patients per day. To simplify and simulate a short epidemic outbreak, Covid patients arrival is programmed from 03/18/2020 for 2 weeks before being set back to 0.
3.3 Design of Experiments
We ran different experiments to test the simulation model summarized in Table 1. First we tested the model with real data by using the available log on 2017/2018. This validation scenario will be run with infinite capacities, Scenario 0, and finite capacities, Scenario 0’.
A second set of experiments (Scenarios 10–43) is proposed to study a daily admission rate increase. We used our generated data predicting the attendance on 2019 with a varying arrival rate of urgent patients. According to (Bergonzoni et al. 2019), ED attendance in France has annually increased by 3.5% on average since 1996. Thus we decided to consider 4 ED admission rates (observed average, 1%, 3%, 5% increases). Experiments will be run with infinite and finite capacities to see the impact of the rerouting possibilities on occupation indicator. Then we will redefine the MR capacity to 90% and 110% of the mean occupation of the finite capacity scenario to experiment a sizing of the ward.
For the last set of experiments (Scenarios 50–54), we extended the simulation to the first semester of 2020 and added the Covid patients outburst. We make set the admission rate of Covid patients to 5 per day for two weeks. Again, we will test this at finite, Scenario 5, and infinite capacities. However, we will allow the entry of Covid patients, even when the ward is fully occupied. We will test two response policies: the rerouting of urgent and elective patients to another ward, and a 25% increase of capacity of the MR ward, independently and combined.
In scenario 0 we consider a 1-year warm-up period (2017). For all other scenarios, the warm-up period of the model is set to 6 months using the warm-up patients described here-above.
Table 1: Details of the experiments considered.
Scenario Finite ED admission rate MR sizing Covid Response
capacities
Scenario 0 No - -
-Scenario 0’ Yes - -
-Scenario 10 No Observed average Observed capacity
-Scenario 11 Yes Observed average Observed capacity
-Scenario 12 Yes Observed average 90% Mean OR Sc11
-Scenario 13 Yes Observed average 110% Mean OR Sc11
-Scenario 20 No 1% increase Observed capacity
-Scenario 21 Yes 1% increase Observed capacity
-Scenario 22 Yes 1% increase 90% Mean OR Sc21
-Scenario 23 Yes 1% increase 110% Mean OR Sc21
-Scenario 30 No 3% increase Observed capacity
-Scenario 31 Yes 3% increase Observed capacity
-Scenario 32 Yes 3% increase 90% Mean OR Sc31
-Scenario 33 Yes 3% increase 110% Mean OR Sc31
-Scenario 40 No 5% increase Observed capacity
-Scenario 41 Yes 5% increase Observed capacity
-Scenario 42 Yes 5% increase 90% Mean OR Sc41
-Scenario 43 Yes 5% increase 110% Mean OR Sc41
-Scenario 50 No Observed average Observed capacity none
Scenario 51 Yes Observed average Observed capacity none
Scenario 52 Yes Observed average Observed capacity Reroute other patients Scenario 53 Yes Observed average Observed capacity Temporary capacity increase
Scenario 54 Yes Observed average Observed capacity Sc 52 and 53
3.4 Key Performance Indicators
The output variables of the simulation are the mean occupancy ratio of the “Multi-purpose Recovery” (MR) ward and the maximum occupancy over the studied period. The first figure will allow us to compare the global impact of the epidemic on the ward, while the second gives us the maximum amount of resources that are required to face the demand and thus quantify how the service is overwhelmed.
Those indicators were calculated over different periods depending on the scenario. In scenario 0 we consider the year 2018, for scenarios 10–43 we consider the year 2019, and for scenarios 50–54 regarding Covid patients, the indicators were calculated between the 01-01-2020 and 06-30-2020.
3.5 Results
For each scenario we set 10 replications and calculated the mean and standard deviation of the two KPIs. The results are summed up in Tables 2, 3 and 4.
3.5.1 Validation Scenario
In this scenario we inject history log and compare the output of the simulation with real KPIs. The results in Table 2 show a Mean OR of 83.90%. This result is coherent with the real observed occupation rate. The maximum occupancy in the service is 16. This ward is required by a lot of patients and sudden surges can occur. However doctors and nurses will manage patients pathways to keep the number of patients under the
Table 2: Occupancy ratio and maximum occupancy in the MR ward at infinite capacities. Mean OR (%) (std dev) Average maximum Occupancy (std dev)
Scenario 0 83.90 (-) 16 (-)
Scenario 10 52.19 (1.53) 18.0 (1.63)
Scenario 20 52.94 (1.65) 18.2 (1.23)
Scenario 30 54.00 (2.49) 18.7 (1.50)
Scenario 40 54.48 (2.52) 18.1 (1.52)
ward’s capacity, explaining the small difference between the capacity (15) and the maximum occupancy (16).
3.5.2 Normal Activity Simulation
In scenarios 10, 20, 30 and 40 we notice that mean occupancy ratio is a lot smaller than the one in validation scenario, while the maximum occupancy across the 10 repetitions is higher (see Table 2). We believe this difference may be partly caused by the hypothesis H3. Indeed, this hypothesis may conduce the model to accept patients too quickly into certain wards, thus reducing the global occupation rate in critical services. The increase of admissions through the ED has a small impact on the ward’s occupancy, but is still noticeable.
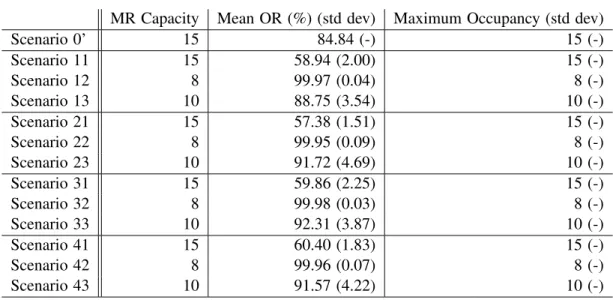
3.5.3 Finite Capacities and Ward Resizing
The results are summed up in Table 3. First, we see that taking into account finite capacities leads to higher occupation rates for the MR ward. We can also notice that the increase in emergency patients arrival does not affect the mean OR enough to have an impact on the wards’ target values for our sizing experiment (8 and 10 beds) on such a short period of time. When the capacity is fixed to 8 beds, we can see that the MR ward occupation rate is really close to 100%, leaving no beds available for unexpected patients.
Table 3: Occupancy ratio and maximum occupancy in the MR ward with finite capacities. MR Capacity Mean OR (%) (std dev) Maximum Occupancy (std dev)
Scenario 0’ 15 84.84 (-) 15 (-) Scenario 11 15 58.94 (2.00) 15 (-) Scenario 12 8 99.97 (0.04) 8 (-) Scenario 13 10 88.75 (3.54) 10 (-) Scenario 21 15 57.38 (1.51) 15 (-) Scenario 22 8 99.95 (0.09) 8 (-) Scenario 23 10 91.72 (4.69) 10 (-) Scenario 31 15 59.86 (2.25) 15 (-) Scenario 32 8 99.98 (0.03) 8 (-) Scenario 33 10 92.31 (3.87) 10 (-) Scenario 41 15 60.40 (1.83) 15 (-) Scenario 42 8 99.96 (0.07) 8 (-) Scenario 43 10 91.57 (4.22) 10 (-) 3.5.4 COVID Simulation
The massive arrival of patient logically causes an increase of the Occupancy Rate of the MR ward. At baseline, with a Covid patient arrival rate at 0, the system behaves as expected, with indicators similar to the one of scenario 1. The staff needed to respond to this surge is high as well.
In Table 4 a daily arrival rate of 5 Covid patients overcrowds the ward, with an average maximum occupancy of 65 patients at the same time. The bed and staff requirements are high, at baseline our medical partner indicates that about 8 doctors and 40 nurses work in the MR ward with 15 beds. Without any action on the admission policy, the hospital would need the equivalent of 5 MR units fully staffed to treat all patients during the pandemics. We can see that the combination of a temporary increase of the capacity and the routing of non-covid patients to other units are significantly reducing the Mean OR.
Table 4: Occupancy ratio and maximum occupancy in the MR ward with Covid patients. Mean OR (%) (std dev) Average maximum Occupancy (std dev)
Scenario 0 83.9 (-) 16.0 (-) Scenario 50 60.8 (1.52) 65.0 (9.37) Scenario 51 69.0 (2.12) 63.3 (10.12) Scenario 52 67.1 (2.43) 62.5 (9.96) Scenario 53 66.2 (1.99) 59.5 (7.06) Scenario 54 64.6 (1.96) 61.5 (7.15) 4 DISCUSSION
The main contribution of this paper is the conception of a digital twin of a health care centre, able to adequately mimic the behaviour of our partner hospital. We believe that our model can be a valuable decision-helping tool to estimate the resources needed for day-to-day operations and to assess the need for a special policy in the case of unpredicted events as we did in scenarios 50–54.
Although the results of the simulation are promising, we believe this model can be improved, in particular the wards’ finite capacities and waiting queues. Indeed the relations between the ward can be more accurately described. For instance, a patient could be rerouted to another ward based on his diagnoses and the wards’ specialities for instance.
Moreover, additional work should be done to clean the database and correct the problems posed by hypothesis H3. Indeed we noticed that wards highly demanded for short stays (less than 3 days in average) are not well modelled by our simulation, causing an accumulation of patients waiting for a bed, even in Scenario 0. We believe that obtaining more precise data for those few wards should help improve the model.
Response policies have been designed and tested to test our model. We believe that studying the actual response of the CHUSE to this crisis, with precise data on Covid patients’ pathways, would improve this model. In addition, implementing dynamic surge policies, like allowing an admission without considering capacities under certain conditions would greatly improve the model.
5 CONCLUSIONS
In this paper, we described the creation of a simulation model of the hospital from patients’ records. The study of patients’ stays allowed us to build a macroscopic and representative model of the studied hospital. We produced a prospective analysis of patients arrivals on the year 2019 and the first semester of 2020. This allowed us to analyse bed occupancy when the hospital is running its usual activities.
Using data from the current coronavirus pandemic, we ran an experiment to demonstrate how this simulation could be used to assess the model’s response to an unexpected variation of arrivals. We believe the results demonstrates how this tool can help the decision process concerning bed management policies when facing unexpected events. The strength of this data-driven DES model is its ability to account for the major part of the hospital. In addition, given a thorough data analysis, it can be used to test different organisations of the hospital in what-if scenarios, or applied to other health care centres.
We identified and detailed several perspectives of improvement that will help in providing a robust insight on the hospital current state and reassert its use as a decision-helping tool. First, implementing more realistic patients’ pathways will improve the accuracy of the model in describing hospital’s day-to-day activities. Secondly, the definition of dynamic surge responses is a necessary step analyze the impact of exceptional crises like Covid-19 epidemic. Once completed and reviewed by hospital’s officials, a standalone version of the model is to be delivered as a decision-aid tool.
REFERENCES
Abraham, G., G. B. Byrnes, and C. A. Bain. 2009. “Short-Term Forecasting of Emergency Inpatient Flow”. IEEE Transactions on Information Technology in Biomedicine13(3):380–388.
Ben-Tovim, D., J. Filar, P. Hakendorf, S. Qin, C. Thompson, and D. Ward. 2016. “Hospital Event Simulation Model: Arrivals to Discharge–Design, Development and Application”. Simulation Modelling Practice and Theory 68:80–94.
Bergonzoni, A., B. Boisgu´erin, N. Boussa¨ıd, H. Chaput, A. Dahmouh, A. Delaporte, G. Gateaud, C. Legris, S. Morin, A. Pla, C. de Peretti, T. Seimandi, F. Toutlemonde, R. Tr´emoulu, A. Vilain, A. Vuagnat, and E. Yilmaz. 2019. Les Etablissements de Sant´e - Edition 2019. Paris, France: DREES.
Brailsford, S. C., T. Eldabi, M. Kunc, N. Mustafee, and A. F. Osorio. 2019. “Hybrid Simulation Modelling in Operational Research: A State-of-the-Art Review”. European Journal of Operational Research 278(3):721–737.
Busby, C. R., and M. W. Carter. 2017. “Data-Driven Generic Discrete Event Simulation Model of Hospital Patient Flow Considering Surge”. In 2017 Winter Simulation Conference, edited by W. K. V. Chan, A. D’Ambrogio, G. Zacharewicz, N. Mustafee, G. Wainer, and E. Page, 3006–3017. Piscataway, New Jersey: Institute of Electrical and Electronics Engineers, Inc.
Cabrera, E., M. Taboada, M. L. Iglesias, F. Epelde, and E. Luque. 2011. “Optimization of Healthcare Emergency Departments by Agent-Based Simulation”. In Proceedings of the International Conference on Computational Science, edited by M. Sato, S. Matsuoka, P. M. Sloot, G. D. van Albada, and J. Dongarra, Volume 4, 1880–1889. Amsterdam, Netherlands: Elsevier B.V.
Chavis, J., A. L. Cochran, K. E. Kocher, V. N. Washington, and G. Zayas-Cab´an. 2016. “A Simulation Model of Patient Flow through the Emergency Department to Determine the Impact of a Short Stay Unit on Hospital Congestion”. In 2016 Winter Simulation Conference, edited by T. M. K. Roeder, P. I. Frazier, R. Szechtman, E. Zhou, T. Huschka, and S. E. Chick, 1982–1993. Piscataway, New Jersey: Institute of Electrical and Electronics Engineers, Inc.
Chong, M., M. Wang, X. Lai, B. Zee, F. Hong, E. Yeoh, E. Wong, C. Yam, P. Chau, K. Tsoi, and C. Graham. 2015. “Patient Flow Evaluation with System Dynamic Model in an Emergency Department: Data Analytics on Daily Hospital Records”. In 2015 IEEE International Congress on Big Data. October 29th - November 1st, New York, New York, 320–323. El-Darzi, E., C. Vasilakis, T. Chaussalet, and P. Millard. 1998. “A Simulation Modelling Approach to Evaluating Length
of Stay, Occupancy, Emptiness and Bed Blocking in a Hospital Geriatric Department”. Health Care Management Science1(2):143–149.
Farmer, R. D., and J. Emami. 1990. “Models for Forecasting Hospital Bed Requirements in the Acute Sector.”. Journal of Epidemiology & Community Health 44(4):307–312.
Kumar, A., R. J. Jiao, and S. J. Shim. 2008. “Predicting Bed Requirement for a Hospital Using Regression Models”. In IEEE International Conference on Industrial Engineering and Engineering Management. Singapore: December 8th- 11th, Inc. 665-669.
Salmon, A., S. Rachuba, S. Briscoe, and M. Pitt. 2018. “A Structured Literature Review of Simulation Modelling Applied to Emergency Departments: Current Patterns and Emerging Trends”. Operations Research for Health Care 19:1–13. Sant´e Publique France 2020. “Donn´ees Hospitali`eres Relatives `a l’Epid´emie de COVID-19”.https://www.data.gouv.fr/fr/datasets/
r/63352e38-d353-4b54-bfd1-f1b3ee1cabd7, accessed 20th April.
Tan, K. W., Q. Y. Ng, F. N. H. L. Nguyen, and S. S. W. Lam. 2019. “Data-Driven Decision-Support for Process Improvement through Predictions of Bed Occupancy Rates”. In 2019 IEEE 15th International Conference on Automation Science and Engineering, 133–139. Vancouver, Canada: August 22nd- 26th, Institute of Electrical and Electronics Engineers, Inc. 665-669.
AUTHOR BIOGRAPHIES
JULES LE LAY is currently a Ph.D Student at the Center for Health Engineering at Mines Saint-Etienne, FRANCE. He received a MsC in Engineering from Mines Saint-Etienne, Auvergne-Rhˆone-Alpes in 2017. His research interests include modelling, simulation and optimisation of health-care systems. His e-mail address isjules.le-lay@emse.fr.
VINCENT AUGUSTO is a professor and a permanent faculty member of Mines Saint- ´Etienne, Center for Biomedical and Healthcare Engineering. His areas of research are performance evaluation, engineering of healthcare systems (industrial engineering, simulation), optimization and management of healthcare systems (operational research), health data and medical decision aid (process mining, machine learning). He defended his thesis in 2008 related to the modeling, analysis and control of flows in healthcare systems using UML and Petri nets (Industrial Engineering). He defended his “Habilitation `a Diriger des Recherches” in 2016 on the topic of Health Territories Engineering. He was a visiting professor at CIRRELT (Interuniversity research center on business networks, logistics and transport), Laval University, Qu´ebec, Canada in 2009 and 2015. He is coresponsible of the living lab MedTechLab. He is director of the Center for Biomedical and Healthcare Engineering of Mines Saint- ´Etienne since January 2020 (70 people). His email address isaugusto@emse.fr.
XIAOLAN XIE is a professor and the head of the department of Healthcare Engineering of the Center for Biomedical and Healthcare Engineering, Ecole Nationale Sup´erieure des Mines (EMSE), Saint Etienne, France. His research interests include data analytics, design, planning and scheduling, supply chain optimization, and performance evaluation of healthcare and manufacturing systems. He is author/coauthor of 300+ publications including 110+ journal articles and six books. He has rich industrial application experiences with European industries and is PI for various national and international projects. Pr. Xie is a fellow of IEEE, the founding chair of the IEEE RAS-Technical Committee on Automation in Health Care Management and an IEEE RAS 2017 Distinguished Lecturer. He has been an editor/associate editor for IEEE Transactions on Automation Science & Engineering, IEEE Transaction on Automatic Control, IEEE Transactions on Robotics & Automation and International Journal of Production Research. He has been a Guest Editor of various special issues on healthcare engineering and manufacturing systems. He is general chair of the 2021 IEEE Conference on Automation Science and Engineering to be held in Lyon, France. His email address isxie@emse.fr.
THOMAS CELARIER is an associate professor, geriatric doctor is also head of the geriatric department and clinical gerontology of the university hospital center of St Etienne. Medical consultant for the AURA G´erontopˆole, he coordinates many studies on interventional research and works on healthcare modelling. His email address isthomas.celarier@chu-st-etienne.fr. REGIS GONTHIER is Professor Emeritus of Geriatric at Jean Monnet University ( Saint-Etienne). Member of the National Academy of M´edecine. Research Gerontologist at AURA G´erontopole His email address isregis.gonthier@chu-st-etienne.fr. BIENVENU BONGUE holds a Ph.D. in pharmacoepidemiology of Toulouse III university, he is also holder of an Habilitation to supervise research since 2013. Mr Bongue is researcher member of the SNA-EPIS Laboratory; EA 4607 of Jean Monnet University (Saint- ´Etienne, France) and Associate Professor at Montr´eal University (Qu´ebec, Canada). He is also the Chair of ”Seniors health - Prevention engineering” of Jean Monnet University of St-Etienne. He is supervising 4 PhDs students. Mr. Bienvenu Bongue is member of numerous scientific councils and author of numerous scientific papers and reports. His email address isbienvenu.bongue@univ-st-etienne.fr.
EDGAR ALFONSO-LIZARAZO holds a Ph.D. in industrial engineering from the ´Ecole Nationale Superieure des Mines de Saint- ´Etienne, France. Currently, he is researcher member of the LASPI laboratory and Associate Professor at Universit´e Jean Monnet, Saint- ´Etienne, France. His research interests include modelling, simulation and optimization of health care systems and medical decision-making. His email adress is edgar.alfonso.lizarazo@univ-st-etienne.fr.
MALEK MASMOUDI is engineer and PhD in industrial engineering. He is associate professor and head of the industrial engineering Master in Jean-Monnet University. He received the Doctorate of Sciences (Habilitation) from Jean-Monnet University in 2017. His main research interests are the applications of data science and optimization techniques to various engineering and management fields. He published two springer books in data science and more than fifteen international journal papers in operations research and industrial engineering His email address is malek.masmoudi@univ-st-etienne.fr.