HAL Id: hal-01007731
https://hal.archives-ouvertes.fr/hal-01007731
Submitted on 17 Oct 2017HAL is a multi-disciplinary open access
archive for the deposit and dissemination of sci-entific research documents, whether they are pub-lished or not. The documents may come from teaching and research institutions in France or abroad, or from public or private research centers.
L’archive ouverte pluridisciplinaire HAL, est destinée au dépôt et à la diffusion de documents scientifiques de niveau recherche, publiés ou non, émanant des établissements d’enseignement et de recherche français ou étrangers, des laboratoires publics ou privés.
A constitutive model for uncemented and grouted sands
Christophe Dano, Pierre-Yves Hicher
To cite this version:
Christophe Dano, Pierre-Yves Hicher. A constitutive model for uncemented and grouted sands. 5th European Conference on Numerical Methods in Geotechnical Engineering, NUMGE2002, 2002, Paris, France. �hal-01007731�
A CONSTITUTIVE MODEL FOR UNCEMENTED AND GROUTED SANDS
UN MODELE DE COMPORTEMENT POUR SOLS VIERGES ET INJECTES
C. Dano
1, P-Y. Hicher
11
Laboratoire de Génie Civil de Nantes Saint-Nazaire, Ecole Centrale de Nantes, France
ABSTRACT. The mechanical behaviors of both uncemented and grouted sands show some
common features, in particular non linearity. A straightforward constitutive model with only seven parameters allows to simulate this non linearity, as well as the contracting – dilating volumetric behavior through an original plastic potential. Some computations are finally presented.
RÉSUMÉ. Le comportement mécanique des sables vierges et injectés par du coulis montre des
caractéristiques communes, en particulier un comportement non linéaire. Un modèle de comportement simple à sept paramètres permet de décrire cette non linéarité, ainsi que le comportement volumique contractant – dilatant au travers d’une fonction potentiel plastique originale. Quelques calculs de validation sont finalement présentés.
1. Introduction
Constitutive models have been previously proposed in the literature in order to simulate the mechanical behavior of cemented soils (Hirai et al., 1989; Di Prisco et al., 1992; Reddy et Saxena, 1992; Abdulla et Kiousis, 1997; Sun et Matsuoka, 1999). However, their degree of complexity usually make these models not easily applicable in engineering design because they are generally characterized by an important number of parameters whose physical meaning could also be questionable. The identification of these parameters could require sophisticated laboratory tests.
Therefore, for a design purpose, a straightforward constitutive model with seven parameters is presented herein. Based on the elastic perfectly plastic model with a Mohr-Coulomb yield surface, it aims at describing the non linear behavior of both uncemented and grouted soils from the onset of shearing to the maximum shear strength by use of only two additional parameters.
2. Experimental observations
2.1. Grout injection in the laboratory
Grout injection allows to reinforce a soil by filling its voids with a cementitious binder. The setting of the cement gives rise to a notable improvement of the stiffness and of the strength of the soil, which subsequently protects the workers and the neighboring building foundations from any structural damage.
In order to study the mechanical behavior of grouted sands, a fine and siliceous Fontainebleau Sand, with a mean grain size D50 equal to 220 µm, a Hazen’s ratio Cu equal to 1.4, a minimum
and maximum void ratio emin and emax respectively equal to 0.576 and 0.857, was injected in the
laboratory by a microfine cement grout with a cement to water ratio equal to 0.172. The injection device was described in Dano (2001). It leads to a good homogeneity of the grouted samples as well as a good repeatability of the injection process.
2.2. Mechanical behavior
Drained triaxial tests were performed on samples of uncemented Fontainebleau sand prepared through air pluviation and on samples of grouted sand. Density indexes of the granular skeleton were similar in the two cases (Id≈ 95 %). Confining pressures σ’c were taken between 0 and 400
grout injection on the mechanical behavior of the tested soils. Similar patterns were observed on alluvial deposits sampled during the tunneling of the 14th metro line in Paris (France) and injected with the same microfine cement grout.
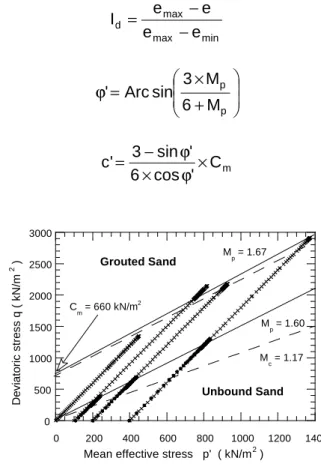
0 500 1000 1500 2000 2500 3000 0 0.005 0.01 0.015 0.02 0.025 0.03 0.035 0.04 D e v ia to ri c s tr e s s q ( k N /m 2 ) Axial strain ε1 σ' c = 100 kN/m 2 σ' c = 100 kN/m 2 σ' c = 200 kN/m 2 σ' c = 400 kN/m 2 σ' c = 400 kN/m 2 σ' c = 200 kN/m 2 Grouted Sand Unbound Sand min max max d e e e e I − − = + × = ϕ p p M 6 M 3 sin Arc ' m C ' cos 6 ' sin 3 ' c × ϕ × ϕ − = 0 500 1000 1500 2000 2500 3000 0 200 400 600 800 1000 1200 1400 D e v ia to ri c s tr e s s q ( k N /m 2 )
Mean effective stress p' ( kN/m 2 )
M c = 1.17 M p = 1.60 M p = 1.67 Unbound Sand Grouted Sand C m = 660 kN/m 2 -0.01 -0.005 0 0.005 0.01 0.015 0.02 0 0.005 0.01 0.015 0.02 0.025 0.03 0.035 0.04 V o lu me tr ic s tr a in εv Axial strain ε 1 Unbound Sand Grouted Sand σ' c = 100 kN/m 2 σ' c = 400 kN/m 2 σ' c = 200 kN/m 2
Figure 1a. Stress – strain curves Figure 1b. Shear strength envelopes. Figure 1. Results of triaxial tests carried out on uncemented and grouted Fontainebleau sand.
The maximum strength is increased. In the (p’, q) representation where p’ is the mean effective stress and q the deviatoric stress, the maximum shear strength envelope of the grouted sand is fitted by a straight line whose slope Mp is almost parallel to the linear strength envelope obtained
for the uncemented sand, for the same density index (Figure 1b). In other words, the friction angle
ϕ’ is hardly changed by the grout injection. The slope Mp is equal to 1.60 for the uncemented sand
(ϕ’ = 39.1 degrees) and 1.67 for the grouted sand (ϕ’ = 40.7 degrees). The slight increase of the friction angle is probably due to the additional compaction of the granular skeleton during injection.
It also induces a cohesion Cm whose value mainly depends on the soil (nature, density,
grading curve) and on the grout (nature and cement to water ratio C/E) (Tailliez, 1998 ; Dano, 2001). The cohesion Cm is equal here to 660 kN/m2, which corresponds to a cohesion c’ in the
Mohr diagram equal to 341 kN/m2.
Tailliez (1998) proved experimentally that the mechanical behavior is independent of the strain rate for soils injected with microfine cement grouts.
Grout injection also generates a clear improvement of the stiffness. However, in the case of grouted sands, the effect of the mean stress on the tangent stiffness is less sensitive than in the case of uncemented sands (Dano, 2001).
In the two cases, the volumetric behavior is firstly contracting and then dilating for greater deviatoric stresses. Values of the Poisson’s ratio ν are also similar, between 0.2 and 0.3. However, some differences appear due to the cementation between the grains. The dilation angle
ψ of grouted sands is at least equal and often greater than the dilation angle of uncemented sands (Figure 1a).
For uncemented sands, the characteristic state concept defined by Luong (1980), which corresponds to the transition between the contracting domain and the dilating one, can be considered. The maximum shear strength coincides with the maximum dilation rate. For grouted sands, it is no longer the case. The transition from the contracting domain to the dilating one is more or less simultaneous to the peak strength. Consequently, the mechanical behavior of grouted sands is rather contracting up to the maximum strength.
3. Constitutive model 3.1. Equations of the model
In order to numerically simulate the previous experimental observations, a strain hardening elastoplastic model was elaborated. This constitutive model was based on the commonly used elastic perfectly plastic model with a Mohr-Coulomb criterion. It aimed at describing the non linear behavior of both uncemented and grouted sands. Compressive stresses and strains are taken negative, except the mean stress p’ for convenience.
At the beginning of the loading, these materials are assumed to behave elastically according to the Hooke’s law:
(
+ν) (
× − ν)
×( )
ε Ι+ × ×(
+ν)
×ε × ν = σ 1 2 E 2 Tr 2 1 1 E o (1)where E, ν, σ, ε and Ι are respectively the elastic modulus, the Poisson’s ratio, the stress tensor, the strain tensor and the identity matrix.
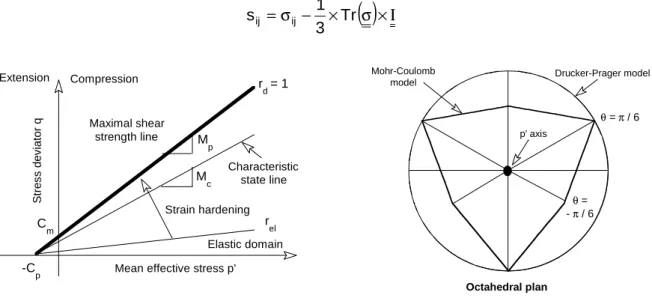
However, the elastic domain is limited to a small region around the hydrostatic axis in the principal stress space (Figure 2). By strain hardening, the size of the elastic domain gradually increases as a function of the deviatoric plastic strain εdp through the yield function f and the
hyperbolic hardening function rd:
( )
(
)
m( )
(
p' C)
r( )
0 M q r , , q , ' p f p p d pd p p d d ε = × θ − + × ε = θ (2)( )
(
p)
d ve el p d el p d d a r 1 r r ε + − × ε + = ε (3)where Mp is the slope of the maximum shear strength line in the (p’, q) representation and Cp the
hydrostatic tensile strength which is assumed to be fixed on the hydrostatic axis as indicated in Figure 2. The parameter rel defines the initial size of the elastic domain whereas the parameter ave
characterizes the hardening rate. The function rd is equal to 1 when the maximum shear strength
line is reached.
Previous experimental works on purely frictional materials and on sand – cement mixtures have shown the effect of the third stress invariant on the shear strength (Reddy et al., 1993). Assuming that the third stress invariant also affects the behavior of grouted sands, the yield function depends on the Lode’s angle θ such as:
( )
(
)
θ × ϕ − θ × ϕ − = θ sin 3 ' sin cos ' sin 3 3 6 mp (4) × × − = θ 3 2 3 J J 2 3 3 sin Arc 3 1 (5)where J2 and J3 are respectively the second and the third stress invariants of the deviatoric stress
tensor s whose components are:
( )
σ ×Ι × − σ = Tr 3 1 sij ij (6) -50 0 50 100 150 200 250 300 350 S tr e s s d e v ia to r qMean effective stress p' Compression Extension -C p Elastic domain Characteristic state line Maximal shear strength line r el r d = 1 M c M p C m Strain hardening Octahedral plan Drucker-Prager model Mohr-Coulomb model θ = π / 6 θ = - π / 6 p' axis
Figure 2. Principle of the constitutive model.
The function m(θ) is equal to 1 in axisymetric compression (θ = π/6) and to β = (3-sinϕ’)/(3+sinϕ’) in axisymetric extension (θ = -π/6). The relation (2) is therefore equivalent to the Mohr-Coulomb criterion (Bardet, 1990). The constitutive model is also chosen as a non-standard model which requires the formulation of a plastic potential function. Based on the characteristic state concept by Luong (1980), the plastic strain increments are related to the slope Mc of the characteristic line
in the (p’,q) representation and to the cohesion Cp by:
( )
( )
el p d d p c c p d p v r 1 r 1 C ' p q m M d d − ε − × + − θ = ε ε (7)( )
(
)
θ × ϕ − θ × ϕ − = θ sin 3 sin cos sin 3 3 6 m c c c (8)where ϕc is the friction angle corresponding to the characteristic state. A fictitious degradation of
the cohesion which depends on the hardening function rd is introduced in the relation (7). It allows
to accurately reproduce the volumetric strains in the dilating domain for grouted sands. The plastic potential function depends on the Lode’s angle in order to maintain it inside the yield surface.
3.2. Identification of the parameters
The constitutive model is characterized by seven parameters :
- the elastic modulus E and the Poisson’s ratio ν for the elastic part of the model;
- the slope of the shear strength envelope Mp and the intercept with the stress deviator axis Cm
or the pseudo-hydrostatic tensile strength Cp (Cp = Cm / Mp);
- the slope of the characteristic state line in the (p’,q) representation Mc;
- the parameters rel and ave which respectively define the initial size of the elastic domain and
the strain hardening rate.
The elastic parameter E is conventionally the tangent modulus at the origin of the stress deviator – axial strain curve. The Poisson’s ratio ν is related to the initial slope of the volumetric strain versus axial strain curve in the contracting domain:
ε ∆ ε ∆ − × = ν 1 v 1 2 1 ∆εv > 0, ∆ε1 > 0 (9)
The identification of the three parameters Mp, Cm and Mc requires to perform at least three
triaxial tests and to report the stress states corresponding to the maximum shear strength and to the characteristic state in the (p’,q) representation, as done in Figure 1.
The determination of the initial size of the elastic domain is a complex experimental problem since it involves to follow the evolution of the secant modulus from the very small strain domain to the large strain domain. It is well-know that for many soils, the elastic behavior is limited to strains less than 10-5 (Hicher, 1996). Only specific devices placed on the specimens themselves inside the triaxial cell and fitted out with high performance transducers give access to an accurate measure of the secant modulus. When such an internal device can not be used, the value of the parameter rel can only be assessed. For instance, the value of the parameter rel is set to 0.01 for
uncemented sands and to 0.1 for grouted sands.
Finally, assuming that elastic strains are negligible compared to the plastic strains, the value of the parameter ave is optimized from the stress – strain curves obtained in the laboratory. In the
case of uncemented sands, the hyperbolic hardening function is particularly well adapted. Computations reveal that the parameter ave depends on the nature of the soil and on the confining
stress such as ave = k × σ’c where k is a constant (k = 1.3 × 10⁻⁶ m²/kN for the Fontainebleau
sand) (Table I). On the contrary, in the case of grouted sands, an exponential hardening function would be more suitable to describe the non linearity. The implementation of an exponential hardening function constitutes a further development of the model. The hyperbolic function is subsequently considered for grouted sands: optimization computations show a slight dependence of ave with the confining stress (Table II).
4. Validation computations
Verification of the predictions of the model for axisymetric loading paths is done in this section. Triaxial tests on saturated uncemented Fontainebleau sand samples (Id = 95 %, B-values greater
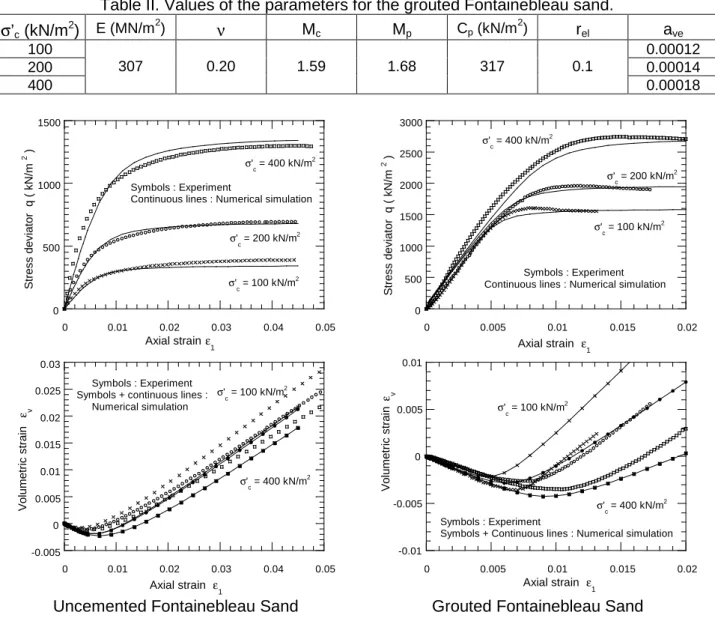
than 0.96) and on grouted Fontainebleau sand samples saturated with water before injection were carried out. The values of the model parameters are indicated in Table I for the uncemented sand and in Table II for the grouted sand. Figure 3 represents the comparison between experimental data and computational results. The slight scattering can be explained by the fact that the values of the parameters Mc, Mp and Cp are mean values obtained by carrying out at least
three triaxial tests. Stress-strain relationships and volumetric strains are correctly assessed.
5. Conclusions
Based on experimental results, a strain hardening elastoplastic model was elaborated. Seven parameters characterize this model suitable for describing the behavior of both uncemented and grouted sands. The model also constitutes a good compromise between simplicity and performances of the predictions. Further improvements will include the implementation of a continuously differentiable yield surface in order to avoid singularities due to the Mohr-Coulomb formulation and the definition of a new hardening function in order to better fit the non linear behavior of grouted sands.
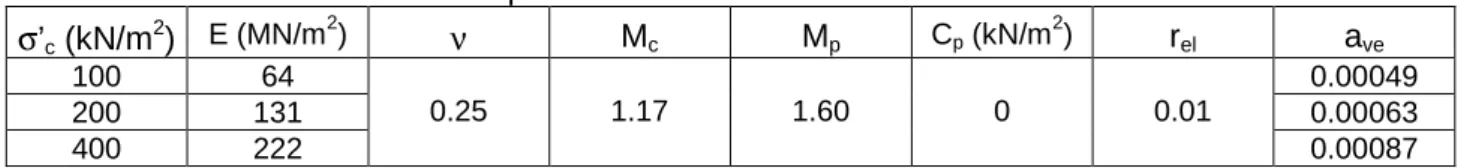
Table I. Values of the parameters for the uncemented Fontainebleau sand.
σ’c (kN/m2) E (MN/m 2 ) ν Mc Mp Cp (kN/m 2 ) rel ave 100 64 0.25 1.17 1.60 0 0.01 0.00049 200 131 0.00063 400 222 0.00087
Table II. Values of the parameters for the grouted Fontainebleau sand. σ’c (kN/m2) E (MN/m 2 ) ν Mc Mp Cp (kN/m2) rel ave 100 307 0.20 1.59 1.68 317 0.1 0.00012 200 0.00014 400 0.00018 0 500 1000 1500 0 0.01 0.02 0.03 0.04 0.05 S tr e s s d e v ia to r q ( k N /m 2 ) Axial strain ε1 Symbols : Experiment
Continuous lines : Numerical simulation
σ' c = 100 kN/m 2 σ' c = 200 kN/m 2 σ' c = 400 kN/m 2 0 500 1000 1500 2000 2500 3000 0 0.005 0.01 0.015 0.02 S tr e s s d e v ia to r q ( k N /m 2 ) Axial strain ε 1 Symbols : Experiment Continuous lines : Numerical simulation
σ' c = 100 kN/m 2 σ' c = 200 kN/m 2 σ' c = 400 kN/m 2 -0.005 0 0.005 0.01 0.015 0.02 0.025 0.03 0 0.01 0.02 0.03 0.04 0.05 V o lu me tr ic s tr a in ε v Axial strain ε 1 σ' c = 100 kN/m 2 σ' c = 400 kN/m 2 Symbols : Experiment
Symbols + continuous lines : Numerical simulation -0.01 -0.005 0 0.005 0.01 0 0.005 0.01 0.015 0.02 V o lu me tr ic s tr a in ε v Axial strain ε1 σ' c = 400 kN/m 2 σ' c = 100 kN/m 2 Symbols : Experiment
Symbols + Continuous lines : Numerical simulation
Uncemented Fontainebleau Sand Grouted Fontainebleau Sand
Figure 3. Numerical computations for uncemented and grouted sands.
6. References
Abdulla A.A., Kiousis P.D. (1997), Behavior of cemented sands – Part II: modelling. International Journal for
Numerical and Analytical Methods in Geomechanics 21, 549-568.
Bardet J.P. (1990), Lode dependences for isotropic pressure-sensitive elastoplastic materials. Journal of
applied mechanics 57, 498-506.
Dano C. (2001), Comportement mécanique des sols injectés. Thèse de Doctorat, Ecole Centrale de Nantes
& Université de Nantes (in french).
Di Prisco C., Matiotti R., Nova R. (1992), A mathematical model of grouted sand allowing for strength degradation. Numerical Models in Geomechanics, 25-35.
Hicher P.Y. (1996), Elastic properties of soils. Journal of Geotechnical Engineering 122(8), 641-648.
Hirai H., Takahashi M., Yamada M. (1989), An elastic-plastic constitutive model for the behavior of improved sandy soils. Soils and Foundations 29(2), 69-84.
Luong M.P. (1980), Phénomènes cycliques dans les sols pulvérulents. Revue Française de Géotechnique
10, 39-53 (in french).
Reddy K.R., Saxena S.K. (1993), Constitutive modeling of cemented sand. Mechanics of Materials 14,
155-178.
Sun D., Matsuoka H. (1999), An elastoplastic model for frictional and cohesive materials and its application to cemented sands. Mechanics of Cohesive-Frictional Materials 4, 525-543.
Tailliez S. (1998), Etude expérimentale du comportement mécanique des sols granulaires injectés. Thèse