AVIS
Ce document a été numérisé par la Division de la gestion des documents et des archives de l’Université de Montréal.
L’auteur a autorisé l’Université de Montréal à reproduire et diffuser, en totalité ou en partie, par quelque moyen que ce soit et sur quelque support que ce soit, et exclusivement à des fins non lucratives d’enseignement et de recherche, des copies de ce mémoire ou de cette thèse.
L’auteur et les coauteurs le cas échéant conservent la propriété du droit d’auteur et des droits moraux qui protègent ce document. Ni la thèse ou le mémoire, ni des extraits substantiels de ce document, ne doivent être imprimés ou autrement reproduits sans l’autorisation de l’auteur.
Afin de se conformer à la Loi canadienne sur la protection des renseignements personnels, quelques formulaires secondaires, coordonnées ou signatures intégrées au texte ont pu être enlevés de ce document. Bien que cela ait pu affecter la pagination, il n’y a aucun contenu manquant.
NOTICE
This document was digitized by the Records Management & Archives Division of Université de Montréal.
The author of this thesis or dissertation has granted a nonexclusive license allowing Université de Montréal to reproduce and publish the document, in part or in whole, and in any format, solely for noncommercial educational and research purposes.
The author and co-authors if applicable retain copyright ownership and moral rights in this document. Neither the whole thesis or dissertation, nor substantial extracts from it, may be printed or otherwise reproduced without the author’s permission.
In compliance with the Canadian Privacy Act some supporting forms, contact information or signatures may have been removed from the document. While this may affect the document page count, it does not represent any loss of content from the document.
" ,
Comparison of proteins of the endoplasmic reticulum from control rat
Uver witb proteins of the endoplasmic reticulum from disseded liver
tumor nodules
par
Eman Abdou
Département de pat!tologie et biologie cellulaire'
Faculté de médecine
Mémoire présenté à la Faculté des études supérieures
en vue de l'obtention du grade de
Maître ès sciences (M.Sc.)
en pathologie et biologie cellulaire
Avril, 2008
Université de Montréal
Faculté des études supérieures
Ce mémoire intitulé:
Comparison of proteins of the endoplasmic reticulum from control rat
Iiver with proteins of the endoplasmic reticulum from dissected liver
tumor nodules
Présentée par:
Eman Abdou
A été évalué par un
jury composé des personnes suivantes:
Docteur Dorin-Lucian Ghitescu ... président-rapporteur
Docteur Jacques Paiement ... directeur de recherche
Docteur Nicole Leclerc ... membre du jury
DEDICATION
TO MY BELOVED GRANDPARENTS, PARENTS, MY SISTER AND BROTHER.
TO MY DEAR AUNT AND UNCLES AND TO MY COUSINS.
SPÉCIAL DEDICA TIaN Ta
MYBELOVED:
SOMMAIRE
Le carcinome hépatocellulaire (CHC) est parmi les tumeurs malignes le plus répandu au monde (Parkin et al., 2005). Une intoxication à l'aflatoxine (une hépatotoxine puissante) est parmi les causes majeures de cancer de foie dans le monde (Bennett and Klich, 2003; Camaghan, 1964).
On a comparé la composition protéique du réticulum endoplasmique (RE) de foie de rats témoins avec la composition protéique du RE de nodules tumoraux disséqués de foie de rats traités avec l'aflatoxine B 1. La spectrométrie de masse, Je compte· de peptide
et la validation. par immunobuvardage ont été utilisés pour identifier et· pour déterminer l'expression relative de protéines dans les fractions enrichies de RE.
Le RE est une organelle clé pour la voie de sécrétion. II est impliqué dans la biosynthèse des protéines et des lipides (Shibata et al., 2006). Aussi, il est impliqué dans la dégradation des protéines et la détoxication des produits toxiques (Lavoie and Paiement, 2008).· Ces divers fonctions sont etfeètuées par de nombreuses protéines certaines sont identifiées dans ce mémoire et elles sont comparées avec les mêmes protéines dans le cancer.
Beaucoup de protéines liées au cancer étaient surexprimées dans le RE dérivé des nodules tumoraux~ Parmi les protéines surexprimées on note l'annexine II, les produits des gènes activés par l'aflatoxine BI (exemple GST pi), les inhibiteurs de l'apoptose (exemples tripeptidyl peptidase II et nucleophosmine), des protéines impliquées dans la dégradation protéique ubiquitine-dépendante (sous-unités deprotéasome), des protéines impliquées dans le métabolisme de l'ARN méssager (exemples hnRNP K, hnRNP M et P ABP 1), des protéines impliquées dans la transcription (exemple Y box protéine 1), des protéines impliquées dans la traduction (exemples eIF 2n et eEF 2) et des protéines des filaments intermédiaires du cytosquelette (exemples vimentine et cytokératine 19).
,
Plusieurs protéines impliquées dans la détoxication (exemple, protéines de la famille du cytochrome p450) étaient sousexprimées dans le RE de tumeurs. D'autres protéines impliquées dans la détoxication étaient surexprimées (protéines de la famille des aldo-keto réductases) ..
Au contraire, les protéines chaperones (exemples, Bip et calreticuline) et les protéines du complexe MHC class 1 qui est impliqué dans la présentation antigénique étaient en quantité similaire dans le RE de tumeur et dans le RE de foie témoin. Des protéines phosphorylées à un résidu tyrosine incluant ATP citrate lyase qui est le substrat de la voie de signalisation Akt, étaient présentes en quantité significative dans le RE de tumeur.
Les études d'immunobuvardage employant dix-huit anticorps différents ont conftnnés la distribution relative de protéines entre le RE de tumeurs et celui de foie contrôle. Donc ces résultats ont pennit de valider les résultats obtenu par spectrométrie de masse.
En conclusion, la composition protéique du RE des hépatocytes tumorales est différente de celle du RE de hépatocytes nonnaux. Cette différence favorise probablement la survie des cellules cancérologique du foie. En plus, plusieurs protéines inconnues étaient présentes en concentration plus grande dans le RE de tumeur comparé à celle dans le RE de foie de· rats témoins. Certaines de ces protéines inconnues pourraient être devenir de nouveaux marqueurs de tumeurs.
Mots I:lés: réticulum endoplasmique, carcinome hépatocellulaire, immunobuvardage, protéomique, spectrométrie de masse, protéines phosphorylées, protéines inconnues, biomarqueurs.
ABSTRACT
Hepatocellular carcinoma (HCC) is one of the Most common malignancies worldwide (Parkin et al., 2005). Aflat,oxin (a potent hepatoxin) is one of the major causes of liver cancer in the world (Bennett and Klich, 2003; Carnaghan, 1964).
We have compared the protein composition.of endoplasmic reticulum (ER) from control rat liver with the composition of ER from dissected liver tumor nodules from rats treated withaflatoxin BI. Mass spectrometry, peptide counts and immunoblot validation were used to identify and detennine the relative expression level of the proteins in highly enriched ER fractions
Normally, the ER is a key organelle of the secretion pathway involved in the biosynthesis of
both
proteins and lipids (Shibata et al., 2006). AIso, it is involved in prote in degradation and toxic products detoxification. These diverse functions of the ERare carried out via multiple proteins (Lavoie and Paiement, 2008).
Many proteins relevant to cancer were overexpressed in ER from dissected liver tumor nodules. These include examples as Annexin II, the classical aflatoxin BI gene targets (Le. GST pi), inhibitors of apoptosis (i.e. tripeptidyl peptidase II and nucleophosmin), proteins involved in proteasome metabolism (Le. proteasome subunits), proteins involved in mRNA metabolism (Le. hnRNP K, hnRNP M and PABP 1), in transcription (i.e. Y box protein 1) in translation (i.e. eIF 2« and eEF 2) and intermediate filaments cytoskeleton proteins (Le. vimentin and cytokertain 19). Many proteins implicated in the detoxification (examples include the cytochrome p450 proteins) were underexpressed whereas a mnnber of aldo-keto reducatases proteins were overexpressed in ER from tumors. In contrast, proteins of the folding machinery (Le. Bip and calreticulin) and proteins of the MHC class l peptide loading complex were almost expressed in equal amounts in ER from dissected tumor nodules compared to those in
control ER. Tyrosine phosphorylated proteins including ATP citrate lyase a substrate of the Akt signaling pathway were observed in a significant quantity in cancer ER preparations. Many proteins of unknown function were observed in either concentration in hepatic cancer ER membranes.
Eighteen antibodies confirmed the relative distribution of immunoblotted proteins. These different antibodies confumed the relative distribution of proteins of ER from tumor and control liver. Therefore, the se results allowed the validation of the results obtained by mass spectrometry.
Therefore, in conclusion the proteomic composition of the ER of cells in HCC is different from those of ER of normal hepatocytes. This difference is probably ao advantage for the surviVal of tumoral cells in liver cancer. Furthermore, many known proteins that were observed in greater concentration in cancer ER as compared to the ER from control liver, cao he as potential tumor markers in HCC (examples include eEF2, OST pi and vimentin).
Key words: endoplasmic reticulum, hepatocellular carcinoma, immunoblot, proteomics, mass spectrometry, phosphorylated proteins, unknown proteins, biomarkers.
TABLE OF CONTENTS
COMPOSITION OF THE THESIS JURy... ••••
iiDEDICATION
...•...•...••..•...•..•..••...•
iiiSOMMAIRE •••••••••••••••••••••••••••••••••••••••••••••••••••••••••••••••••• •••• •••••• iv ABSTRACT ... _._ ... ~.... ••• vi
TABLE OF CONTENTS... ••••
vüiLIST OF FIGURES ••••••••••••••••••••••••• ••••••••••••• •••••• ••••••••••••••••• •••••
xiiiLIST OF TABLES... ••••••••••••••••••• ••••••••••••••
xivLIST OF ABBREVIA TIONS ••••••••••••••••••••••••••••••••••••••••••••••••••••••• XV" 1 INTRODUCTION •••••••••••••••••••••••••••••••••••••••••••••••••••••••••• 1 1 1 1 Liver cell tumor: Hepatocellular carcinoma
(HCC) •••••••••••••••••
1.1 Epidemiology ... . 1.2 Etiological factors ... 11.3 Clinical picture ...•... 2
1.4 Diagnosis ... . . . 2
1.5 Prevention and treatment ...•.. '.. ... 3
1.6 Survival ... '. . . .... ... ... ... . . .. .. ... 4
2 Aflatoxin BI (AFBl) •••••••••••••••••••••••••••••••••••••• ,~ ••••••••••• 4 2.1 Aflatoxin BI (AFBl) metabolism ... ... 5
2.2 Aflatoxin BI (AFBl) as a chemical carcinogen ... 6
3 Endoplasmic reticulum (ER) ••••••••••••••••••••••••••••••••••••••• ••• 6 3.1 General structure of the ER.... ... 7
3.2 Functions of ER ... 7 ,3.2.1 Metabolism of proteins: Biosynthesis, transport 7
and degradation ... . 3.2.2 Metabolism of lipids: Biosynthesis and transport 8
3.2.3 Metabolism of drugs ... 8
3.3 Domains of the endoplasmic reticulum (ER) ... 9
3.3.1 Rough Endoplasmic reticulum (RER) ... 9
3.3.2 Smooth Endoplasmic reticulum (SER) ... 9
3.3.3 Transitional Endoplasmic reticulum (tER) ... 9
3.3.4 Nuc1ear envelope (NE) ... 10
4 Proteomics ...•... 12
4.1 Organelle proteomics ...•. 12
4.1.1 Advantages and disadvantages of organelle 13 proteomics ... : ... . II ()~C:1L~S •••••••••••••••••••••••••••••••••••••••••••••••••••••••••••••• 14 III ~1J1rIl()It'Sc:()~ItIlI1J1rI()~
••••••••••••••••••••••••••••••••••••••••••••
16 IV MA TERIALS AND METHOnS ...•..•...•. 17 ,1 Induction and characterization of rat liver tumors ...•.•....•. 17
1.1 Induction of rat liver tumors ... 17
1.2 Characterization of rat liver tumors ... '. . . .. 18
2 Preparation of subcellular fractions... ...•. 20
3 Mass speetrometry ... ... ... .... ... 24
3. 1 Protein separation, mass spectrometry and data analysis ... 24
4 Gel electrophoresis experiments •...•...•...•...•.. 30
5 Immunoblot (Western blot) experiments ... ~.... 31
6 Densitometry calculations ...•... 34
6.1 ImageJ... 34
6.2 Scion Image... 35
7 Statistical data analysis: Ratio and P-value calculations ... 36
7.1 Calculation of ratios of total peptides... 36 7.2 Calculation of P-value (test ofsignificance for differentially 36
expressed pro teins ) ...
V ~S1J~1rS ••••••••••••••••••••••••••••••••••••••••••••••••••••••••••••••••••• 38.
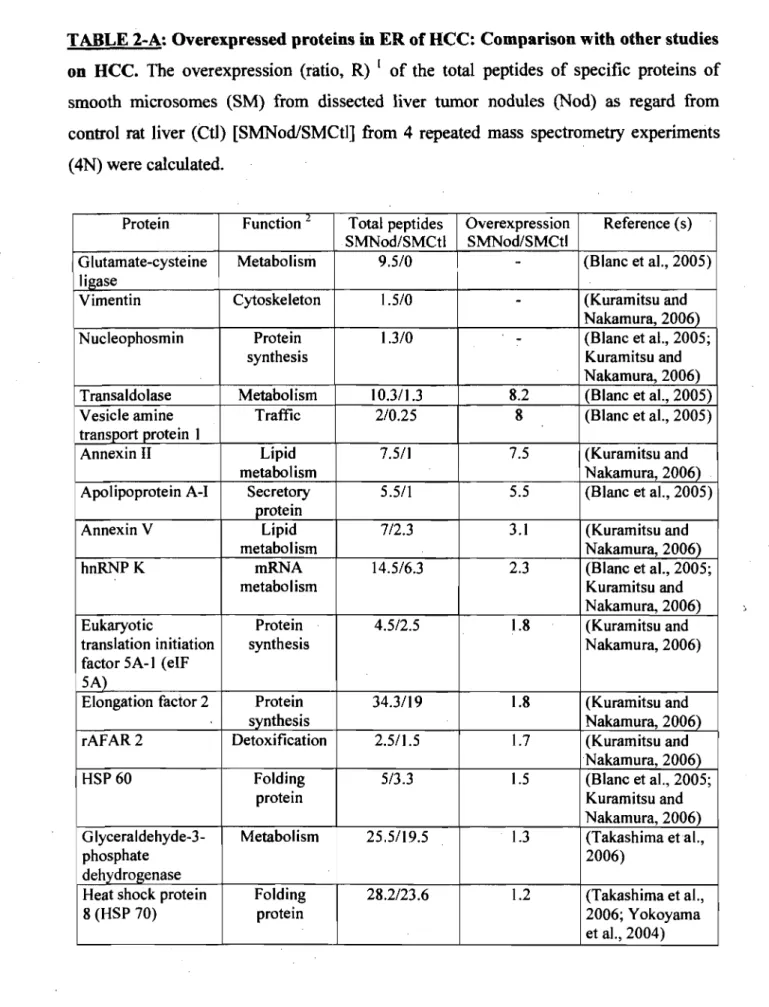
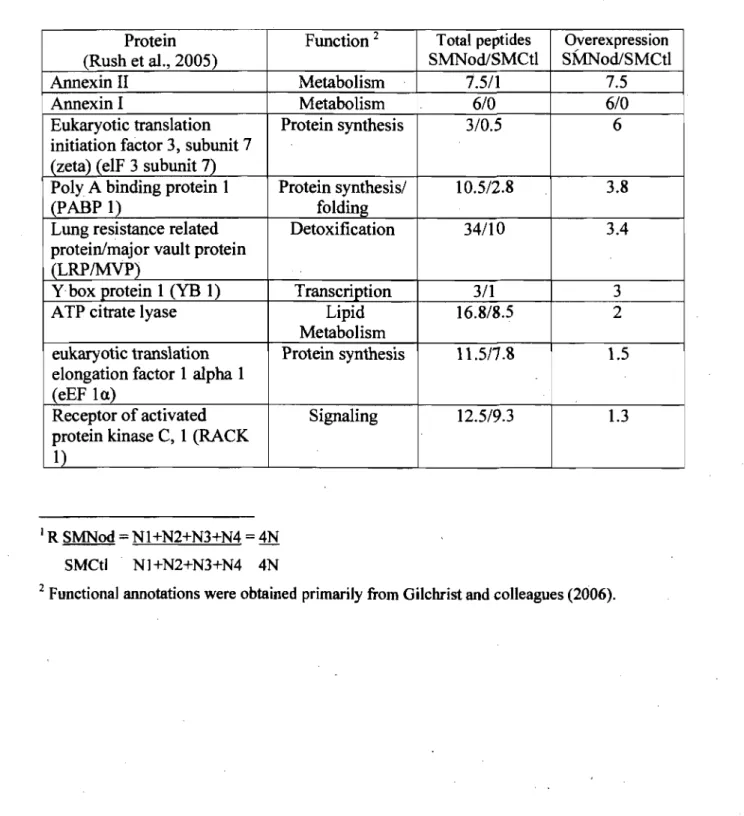
PART A: Mass spedrometry (MS) analysis ... 38 A.t Known proteins ... 38 A.t.I Comparison of our results with the results reported in the 38
cancer literature ... A.1.1.1 Overexpressed proteins reported in cancer 39
li terature ... A.l.l.2 Underexpressed proteins reported in cancer 43
literature ... Al.l.3 Summary of comparison of our results with the 47
results reported in the cancer literature ..•... A. l. 1.4 Differentially expressed phosphotyrosine 47
proteins reported in cancer literature ... A.l.2 Differentially expressed proteins in ER from dissected livet 49
tumor nodules: Our new findings ... A.l.2.1 Overexpressed proteins in ER from dissected 49
liver tumor nodules ... A.1.2.1.1 Proteasome enzymes ... 53 Al.2.2 Underexpressed proteins in ER from dissected 57
. liver tumor nodules ... A.l.3 Proteins showing no significant difference in concentration 61
between control ER and tumor ER ... A.t.3.1 Proteins involved in folding ... 61
A 1.3.2 Proteins involved in histocompatibil.ity antigen 64
presentation ...•... A.2 Unknown proteins ...•...•...•... 68
PART 8: Validation of mass spectrometry (MS) results •••••••••••••••••• 72 B.l Known proteins ... ", 72
B.l.1 Endoplasmic reticulum (control and tumor) fractions ... , 72
B.1.1.l Validation of mass spectrometry results using 72 antibodies directed against cancer related proteins ... B.1.1.1.1 Overexpressed tumor ER proteins . 74 B. 1.1. 1.2 Underexpressed tumor ER proteins. 75 B.1.1.1.3 Equally expressed ER proteins in 75 both fractions (control and tumor) . B. 1. 1.2 Validation of MS results using densitometry ... 76
B.1.2 Endoplasmic reticulum and cytosol (control and tumor) 76 fractions ... . B.l.3 Comp~son of densitometry of known proteins with mass 80 spectrometry data for smooth membrane fractions ... . B.2 Unknown proteins ... "... 82
B.2.1 ,Studies with anti~ER antibodies ... ... 82
B.2.2 Studies with anti~phosphotyrosine antibodies ... 85
VI DISCUSSION ... 89
A Differentially expressed proteins ... 89
A.l Proteins involved in mRNA metabolism ... 89
A.2 Proteins involved in diverse metabolic pathways ... .... 90
A.3 Proteins involved in aflatoxin BI metabolism ... .... 91
B Proteins that do not change in expression •••••••••••• 0 0 0 • • • 0 0 0 . . 0 . . 94
B.l Folding proteins ... ~ . . . .. . . .. ... ... ... 94 B.2 Proteins in the major histocompatibility class 1 (MHC class 95
C Phospboty"rosine proteins ... :... 96
D Protein contaminants of the ER fractions •••••••••••••••••••••••••• 97 E Pro teins witb clmical relevance ••••••••••••••••••••••••••••••••••••• 97 E.l Liver tumor biomarkers ... 98 E.2 Proteins related to tumor therapy ... . . . ... 99 E.2.1 Dihydropyrimidine dehydrogenase deficiency ... 99 E.2.2 Proteins involved in multiple drug resistance .... 99 E.2.3 The Warburg effect and cancer therapy ... 100
VII
CONCLUSIONS AND FUTURE PERSPECTIVES... •••
101
VIII REFERENCES... ... 104
LIST OF FIGURES
FIGURE 1 Diagram of the foursubcompartments of the endoplasmic Il
reticulum ...•...
FIGURE 2 Dissected liver tumor from rat treated with aOatoxin Dl ••• :. •••• 22 FIGURE 3 Flow diagram summarizing the fractionation protocol used to 23
prepare ER subfractions from control rat Iiver and from·
FIGURE 4 FIGURE 5
dissected Iiver tumor nodules ••••••••••••••••••••••••••••••••••••••••• Diagram of simplified process ofproteomics ••••••••••••••••• •••••• 29 Peptides of proteins of proteasome in ER of dissected liver 55 tumor nodules and in ER of control rat liver ••••••••••••••••••••• FIGURE 6 Peptides of folding proteins in ER of dissected Iiver tumor 62
nodules and in ER of control rat Iiver •••••••••••••••••••••••••••••• FIGURE 7 Proteins in the major histocompatibility class 1 (MHC class 1) 66
peptide loading complex (PLC) ••••••••••••••••••••••••••••••••••••• FIGURE 8 Novel endoplasmic reticulum associated proteins (NERA) ••••••• 69 FIGURE 9
FIGURE 10 FIGURE 11
Immunoblots for known proteins ... 73
Pro teins bands revealed by immunoblot •• ~.. •• •• • •• • • •• • ••• • •• • ••• 77 Comparison of densitometry results with mass spectrometry 81
results ...•...•...•...•...•..••• ' ..••...
FIGURE 12 Densitometric analysis of-proteins in fractions from control rat 83 liver and from dissected Iiver tumor nodules using anti-ER
aotibodies .•. 0 • • • • • • • • • • • • • • • • • • • • • • • • • • • • • • • • • • • • • • • • • • • • • • • • • • • • • • • FIGURE 13 Densitometric analysis ofproteins in fractions from control rat 86
liver and from dissected liver tumor nodules using
LIST OF TABLES
TABLE 1 List of the primary antibodies used in the immunoblot 33
experiments ...•...
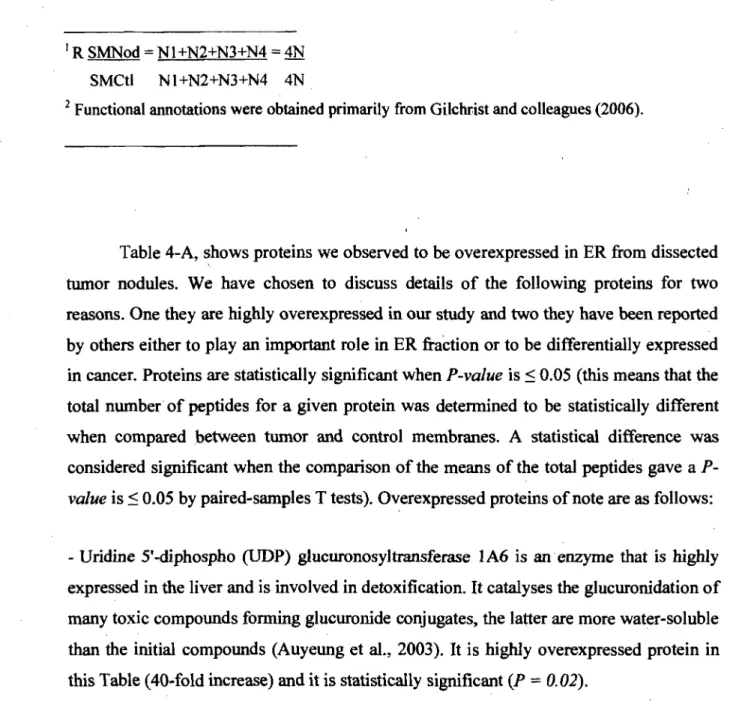
TABLE2-A Overexpressed proteins in ER of HCC: Comparison with other
40
studieson 11<;«: •••••••••••••••••••••••••••••••••••••••••••••••••••••••
TABLE2-B Underexpressed proteins in ER of HCC: Comparison with other
43
studies on HeC ...•... TABLE 3 Differentially expressed phosphotyrosine proteins reported in
48
cancer lite rature •••••••••••••••••••••••••••••••••••••••••••••••••••••• TABLE4-A Most overexpressed proteins in ER from disseeted Iivér tumor 49
nodules ... ' ...•...
TABLE4-B Most underexpressed proteins in ER from dissected Iiver tumor
58
nodules ...•..•...•...AFBl rAFAR2 rAFAR 1 AFP AKRs ATP
BiP/GRP 78
CYP450 DNA eIF 2« eEF2 ER GAS 2 GST hnRNPK LRPIMVPMHC
MS NADPH NERA PABPI PA2G4/EBP 1 PAGE PDI PLCRER
Ribo S6LIST OF ABBREVIATIONS
Aflatoxin BIRat aflatoxin B l' aldehyde reductase member 2 Rat aflatoxin BI aldehyde reductase member 1 Alpha fetoprotein
Aldo-keto reductases Adenosine triphosphate
Immunoglobulin heavy chain-binding protein/78 kDa glucose-regulatedprotein precursor
Cytoehrome p450 family protein Deoxyribonucleie acid
Eukaryotic translation initiation factor 2, subunit 1 alpha Eukaryotie translation elongation factor 2
Endoplasmie retieulum
Growth arrest-specifie protein 2 Glutathione S-transferase
Heterogeneous nuclear ribonucleoprotein eomplex K Loog resistanee related proteinlmajor vault protein . Major histocompatibility eomplex
Mass spectrometry
Nieotinamide adenine dinucleotide phosphate Novel endoplasmie retieulum associated protein
Polyadenylate-binding protein IlPoly(A)-binding protein l Proliferation-associated protein 2.G41ErbB3 binding protein 1
Polyaerylamide gel elecuophoresis Protein disulfide isomerase
Protein loading eomplex Rough Endoplasmie retieulum Ribosomal protein S6
RNA mRNA
RM
RMNod/nnnod SlOOCtl SlOONod SER SMCtl/smctl SMNod/smnod tER VCPYBl
Ribonucleic acidMessenger ribonucleic acid Rough microsomes
Rough microsomes from dissected liver turnor nodules From cytosolic fraction from control rat liver
From cytosolic fraction from dissected livet tumor nodules Smooth endoplasmic reticulum
Smooth microsomes from control rat liver
Smooth microsomes from dissected liver tunior nodules Transiûonal ER
Valosin--contairiing protein y box protein 1
INTRODUCTION
1 Liver cell tumor: Hepatocellular carcinoma (HCC)
Hepatocellular carcinoma is the most common primary malignant disease of the liver (Kew, 2002). It signifies a tumor arising from the epithelial layer of the liver (Suriawinata and Thung, 2002).
1.1 Epidemiology
Hepatocellular carcinoma is the sixth most common cancer worldwide and is the
third
leading cause of cancer-related deaths worldwide (Parkin et al., 2005). Although the incidence of HCC increases with age, the age of peak incidence vary with population (Suriawinata and Thung, 2002). For example, it occurs at earlier ages in black African and ethnic Chinese populations. Men are more affected than women. Male to female ratio is 3: 1 in high incidence regions (Kew, 2002) and a lower ratio is found in low-incidence regions (Parkin et al., 2005). The highest incidences are found to be in Asia (eastem and southeastem), sorne of the sub-Saharan Africa and Melanesia and the lowest are found to be in developed areas (except for southem Europe), Latin America, and south-central Asia (Park in et al., 2005).1.2 Etiologieal fadors
Hepatocellular carcinoma is assOciated with chronic liver disease, mainly cirrhosis (Borzio et al., 1998; Motola-Kuba et aL, 2006; Thorgeirsson and Grisham, 2002). Cirrhosis of the liver may derive from a variety of factors inc1uding, chronic hepatitis viral infections (hepatitis B virus and hepatitis C virus), alcoholism, AFB 1 intoxication and genetic diseases such as hemochromatosis (Mazzanti et aL, 2008), Wilson's disease, alpha-l antiprotease (antitrypsin) deficiency (Fattovich et al., 2004). Hence, cirrhosis can be considered as a premalignant condition (Fattovich et aL, 2004).
1.3 Clinical picture
Clinical presentations can be right upper quadrant abdominal pain (where is the anatomie location of the liver organ), early satiety, and weight loss. Others can include spontaneous rupture of the tumor into the peritoneal cavity, obstructive jaundice, or bony pain from metastasis. Moreover, paraneoplastic syndromes may occur leading to erythrocytosis (due to production of erythropoietin), hypoglycaemia (due to production of an insulin-like growth factor), and hypercalcemia (due to production of parathyroid-related protein). Physical findings may he enlarged liver upon palpation and a vascular bruit on auscultation, consistent with hypervascularity of the tumor (parikh and Hyman, 2007).
lA Diagnosis
Although there is no definite evidence that screeningin liver cancer improves survival, many hepatologists screen patients in high-risk groups with either serum alpha-fetoprotein and/or ultrasound of the liver (Parikh and Hyman, 2007). The biopsy of the tumor is an important tool to establish diagnosis as weil. However, the considerable false negative rate from biopsy of lesions lessthan 2 cm makes a negative biopsy does not. conclusively rule out the diagnosis of HCC. Also, among the most important downsides of the invasive biopsy of liver tumor includes risk of tumor seeding (1 %-2%) and its limitation by generaI contraindications (ascites, decreased coagulation factors, thrombocytopenia) due to a risk of bleeding (Durand et al., 2007; Parikh and Hyman, 2007). A recommendation stated that an ultrasound of the liver every 6 months in high-risk patients to screen for hepatocellular cancer would be helpful (parikh and Hyman, 2007). Hence, markers are needed to correctly. diagnose HCC (Y oon et al., 2006).
On the other hand, many staging and scoring systems are available for clinicians in their routine practice to determine the stage of the disease of their patients. Pons and colleagues (pons et al., 2005) grouped these different too]s ina relatively recent article. Examples of these tools include the Okuda and Tumor-Lymph Node-Metastasis (TNM) staging systems. The latter is the most commonly usèd staging system for solid tumorsin
general, but has severe limitations hecause it does not put in consideration the severity of underlying cirrhosis (Parikh and Hyman, 2007).
Genetic analysis is thought to be a way to classify tumors. Since then there have been several studies of genetic analysis of HCC (Wong et al., 1999). Nevertheless, such genetic studies should he validated using other techniques examples include immunohistochemistry and immunoblot.
Finally, another emerging method of classification of HCC can be according to phenotypic (differentiation) markers. Forthat, immunohistochemistry was used ·to study the expression of different differentiation markers that included hepatocytic differentiation marker (HEP-P AR-reactive antigen), biliary differentiation markers (AEl-AE3, cytokeratin-19), proliferation markers (Ki-67, proliferating cell nuclear antigen), AFP, p53, and transfonning growth factor alpha in the tumor tissue (Wu et al., 1996).
1.5 Prevention and treatment
Prevention of cancer can be achieved by preventing the development of cirrhosis and proper management cirrhosis (Fattovich et al., 2004) in order to preserve the liver function. This can he achieved by the use of a vaccine against hepatitis B virus (Chang et al., 2005), treatment of chronic hepatitis C infection by combination of interferon alpha and ribavirin (patel et al., 2006), early detection of inherited liver diseases 'as weIl as better management of alcohol intake, examples incIude encouraging persons in alcoholics anonymous participation (Mann et al., 2005) and prevention of aflatoxin intoxication, examples include applying post-harvesting technologies to limit fungus growth and crop contamination (Lodato et al., 2006).
Treatment can he divided into four categories: surgi cal interventions (tumor resection and liver transplantation), percutaneous interventions (ethanol injection, radiofrequency thermal ablation), transarterial interventions (embolization, chemoperfusion, or chemoembolization) and drugs incIuding gene and immune therapy. Curative treatment that can result in complete response and improved survival in many
-cases can
he
tumor resection, liver transplantation, and percutaneous interventions. On the other hand, palliative treatment that can improve survival and patient' s quality of life in sorne cases may include transarterial interventions. Finally, drugs and conventional radiotherapy have no proven efficacy (Blum, 2005). However, in the long-tenn management for HCC patients the only definitive treatment option remains to be liver transplantation (Krige and Beckingham~ 2001a; Krige and Beckingham~ 2001b; Llovet et al., 2003; Parikh and Hyman, 2007). This is because in case of liver transplantation both the tumor and the liver dysfunction due to the underlying cancer-prone cirrhotic liver are definitively cured (Parikh and Hyman, 2007). However. this therapeutic approach has limitations because of the shortage of organ donations (Parikh and Hyman, 2007).1.6 Survival
Survival rates are 3% - 5% in United States and developing countries (Parkin et al., 2005). In patients with preserved liver function and without portal hypertension, the five-year survival rate is more than 70 % after surgical resection of the tumor (Bruix et al., 1996; Mazzanti et al., 2008). On the other hand, patients with advanced liver disease, liver transplantation offers one year and five-year survival rates of 80% and 60% respectively(Krige and Beckingham, 2001a).
2 Atlatoxin BI (AFBI)
In 1967, Halver (Halver, 1967) mentioned the early role played by rainbow trout (a species from the salmon family) in the discovery of the carcinogenic action of AFB1. AFBl is now a well-known mycotoxin that affects largely the crop product (such as corn and rice) especially if improperly stored. It is produced by certain strains of fungi namely; Aspergillus flavus, Penicillium, Fusiarium, Claviceps· and Stachybotrys (Meissonnier et al., 2007; Smela et al., 2001). It is principally produced by Aspergillus flavus and Aspergillus parasiticus which are common in most soils and are usually involved in decay of plant materials (Grishin, 2005).
Mycotoxicoses would describe the group of disease that develops secondary to consumption of mycotoxins (Kiessling, 1986). The mechanism of mycotoxicity involves interference with various aspects of ceLI metabolism. The toxins vary in specificity and potency for their target cells, cell structures or cell processes by species and straÏn that produces them, producing neurotoxic, teratogenic or carcinogenic effects. The latter effect is the one of our interest here in this work. Aflatoxins BI, B2, G l, and G2 are produced in grains in both field and storage. The four compounds are distinguished based on their fluorescence colour under the effect of the long-wave ultraviolet illumination (hence B is for blue and G is for green), with the subscripts relating to their relative chromatographic mobility. AFBl is usually found in the highest concentrations, followed by AFG 1, AFB2, and· AFG2. The toxins pose a significant public health concem as diseases resulting from ingestion of aflatoxins, include acute liver disease to cancer development (McLean and Dutton, 1995).
2.1 Aflatoxin BI (AFBl) metabolism
AFB 1 is a specifically metabolized by the action of the mixed function mono-oxygenase enzyme systems (cytochrome P450-dependent) in the tissues (particularly ttJ.e liver) of the affected animal into 8,9-epoxide form (activated and mutagenic form) and others (detoxication products) (McLean and Dutton, 1995). This epoxide form is highly reactive and interacts with severa! cellular macromolecules, such as DNA, RNA and protein (Grishin, 2005; McLean and Dutton, 1995). Consequently, AFBl can affect the liver and can cause serious adverse effects, hence known to be the most potent hepatotoxin and hepatocarcinogen (Carnaghan, 1964).
Aldo-keto reductases (AKRs) are a superfamily of proteins that among its members are those that deal with aflatoxin detoxification: for example, AKR7A2/A3 known as Aflatoxin aldehyde reductases. Tt is noted that A2 member is widely distributed in human tissues while the A3 member is expressed in the liver, colon, kidney, and pancreas. These. proteins can reduce the dialdehyde protein-binding form of aflatoxin BI (AFBI) to the non-binding AFBl dialcohol (Jin and Penning, 2007).
2.2 Atlatoxin BI (AFBI) as a chemical carcinogen
AFB 1 is considered one of the chemicals that can induce carcinogenesis, hence known as a chemical carcinogen. It enhances cancer development and progression. In
fact, carcinogenesis is considered as a multistep process. This includes three distinct (morphological and molecular) steps as follows: initiation (occult), promotion (reversible) and progression (increasing aggressivenes~ of the tumour and malignant
,
conversion) (Pitot, 2001) in which control of cell growth is progressively perturbed (Mazzanti et al., 2008). AFBl is a potent mutagen (Kobertz et al., 1997). Exposure to AFB 1 as the case· in high contamination of cereal food was found to be in close association with development of specifie mutant p53 gene that can consequently favor recurrent HCC. The carcinogenic potential of AFBl vary between individuals, as for the same exposition not aIl patients will develop HCC (Laurent-Puig and Zucman-Rossi, 2006). Nonnally the p53 gene functions as a tumor suppressor (Hanahan and Weinberg, 2000) and is expressed at a low level in the cell. Its up-regulation (in response to various stimuli as DNA damage, hypoxia, viral proteins, or telomere erosion and oncogene activation) will end in the induction of pathways that lead to either cell cycle arrest
oi
apoptosis (Vousden, 2000). One of the fmt measurable effects of AFBl, on cells and tissues is inhibition of DNA synthesis (McLean and Dutton, 1995). Practically speaking, any malignant growth is in need of six basic alteration in the cell physiology; namely self-sufficiency in growth signaIs, insensitivity to growth-inhibitory (antigrowth) signaIs, evasion of programmed cell death (apoptosis), limitless replicative potential, sustained angiogenesis, and tissue invasion and metastases (Hanahan and Weinberg, 2000).3 Endoplasmic reticulum (ER)
The endoplasmic reticulum (ER) is widely present in aIl eukaryotic cells being an essential dynamic subcellular organelle for cell life. It plays an important role in the biosynthesis and modification of membrane and secretory proteins and the biosynthesis of lipids. It also plays a role in calcium homeostasis, and degradation of misfolded proteins (Baumann and Walz, 2001; Lavoie and Paiement, 2008; Shibata et al., 2006).
---7
3.1 General structure of the ER_
The ER membrane is organized into a network of branching tubules and flattened sacs extending throughout the cytosol (8hibata et al., 2006; Voeltz et al., 2006). The tubules and sacs are continuous and enclose a single internal space called the ER lumen (ER cisternal space) (Baumann and Walz, 2001).
3.2 Functions of ER
3.2.1 Metabolism of proteins: Biosynthesis, transport and degradation
The ER is involved in the metabolism of proteins; this includes protein biosynthesis, transport and degradation. The biosynthesis of proteins takes place inside the ER (lumen). This is completed by the insurance of proper folding of newly synthesised prote in (soluble proteins are folded within the lumen of the ER whereas membrane proteins are folded in three environments; the cytosol of the ceU, the lipid bilayer of the ER and the ER lumen), correct disulfide bonding and posttranslational modifications (such as the addition of oligosaccharides). After that, the secretory pathway will ensure the transport of a given newly synthesised protein from ER to the Golgi apparatus (where in the latter, the protein will undergo further posttranslational modifications) then to its final destination at the cell surface. 80 like that, the newly synthesized proteins that fold, assemble and assume a stable conformation are recognized and sorted into secretory vesicles by the activity of the cytosolic coat protein complex cOP 1 and II. The later are crucial for directing the sequential transfer of material between the ER and the Golgi complex. However, the newly synthesized proteins with unstable conformation are specifically targeted for degradation by an ER quality control process called ER associated degradation (BRAD). The ERAD will result in degradation of proteins by the cytosolic ubiquitin-proteasome system (Aridor, 2007; Brodsky and Fisher, 2008; Duden, 2003; Klumperman, 2000; Nickel et al., 1998; Pelham, 1996; y orimitsu and Klionsky, 2007)
3.2.2 Metabolism of lipids: Biosynthesis and transport
The ER is also involved in the metabolism of lipids; this includes lipids' biosynthesis and transport. The lipogenic enzymes involved in the biosynthesis of lipids are bound to the cytosolic surface of the ER membrane. The secretory pathway will ensure the transport of a given newly synthesised lipid from ER to the Golgi apparatus then to its final destination as to the plasma membrane. In case of nascent cholesterol, it moves against a steep concentration gradient to reach the plasma membrane. Vesicular transport along the protein secretory pathway through the Golgi is one route from ER to plasma membrane (Bawnann and Walz, 2001; Davis, 1999; Maxfield and Wustner, 2002; Nickel et al., 1998; Riezman and van Meer, 2004; Soccio and Breslow, 2004).
3.2.3 Metabolism of drugs
The ER is also involved in the metabolism of drugs; this also includes detoxification of xenobiotics by the detoxification machinery present in the ER, namely detoxification enzymes as cytochrome p450 family members (Cribb et al., 2005).
So disruption of the ER can lead to changes in protein synthesis and processing, dysregulation of lipid metabolism and accumulation of toxic compounds (Cribb et al., 2005). Therefore, the crucial metabolic role played by the ER made it a key organelle in development of màny cellular pathological states, notably cancer events. Examples of other ER related diseases include cystic fibrosis, diabetes, neurodegenemtive conditions and polycystic liver disease (reviewed in (Aridor,2007). In addition the ER proteins are direct targets of hepatotoxic compounds (Cribb et al., 2005). Consequently, all the previously mentioned factors made the ER the most valid organelle target for our study.
3.3 Domains of the endoplasmie retieulum (ER)
The ER is composed of four main subdomains namely, rough ER (RER), smooth ER (SER), transitional ER (tER) and nuclear envelope (NE) (Làvoie and Paiement, 2008).
3.3.1 Rough endoplasmic reticulum.(RER)
The RER is the part of the ER where ribosomes are bound at its external surface hence given its narne as rough (Palade, 1975). Nonnally, there are two fonns of ribosomes in the cytosol. Membrane bound ribosomes (attached to the cytosolic side of the ER membrane), are engaged in the synthesis of proteins that are being concurrently translocated into the ER) and free unattached ribsomes involved in the synthesis of cytosolic proteins. Palade initially· described these two fonns of ribosomes (palade,
1955). When a ribosome happens to he making a protein with a signal sequence, the signal directs the ribosome to the ER membrane via interaction with the signal recognition particle (Osborne et al., 2005).
3.3.2 Smooth endoplasmic reticulum (SER)
It is the part of the ER, which is ribosome-me and hence is given its narne as smooth (Shibata et al., 2006). In certain specialized cells (exarnples include livercells, neurons and muscle cells), the SER is abundant and has additional functions (Voeltz et al., 2002). For exarnple in case of liver cells, the SER contains the enzymes that are involved in the detoxification of various xenobiotics. Furthennore, there is an increase in the specific activity of cytochrome p450 farnily enzyme after treatment of the organism with phenobarbital (Kuriyarna et a'., 1969).
3.3.3 Transitional endoplasmie retieulum (tER)
This represents the part of the ER showing areas corif1uent between the RER and . the SER. The SER portion of the tER is often the origin of ER exit sites, which produce
r
transport vesicles carrying newly synthesized proteins and lipids to the Golgi apparatus for distribution in and out of the cell (Fan et al., 2003). Other names for this compartment include ER-Golgi intermediate compartment, vesiculo-tubular clusters or pre-Golgi intennediates (Hauri et al., 2000; Schweizer et al., 1988).
3.3.4 Nu~lear envelope
(NE)
This is a double. membrane envelope, which is composed of an outer nuclear membrane, a nuclear pore, and an inner nuclear membrane. The nuclear pore complex (NPC) is anchored in the nuc1ear pore by transmembrane proteins that extend into the lumen of the nuclear envelope (NE). Moreover, the NPC acts as a doorkeeper by regulating the access of integral membrane proteins to the inner nuclear membrane (Hsia et al., 2007; Lusk et al., 2007). Thus, the NPC mediates the selective exchange of macromolecules between the nucleus and cytoplasm (Melcak et al., 2007). Figure 1 shows that the outer membrane of the NE is in continuity with RER and that both of them are covered with ribsosomes.
(A) RER (8) (D) SER tER (C)
FIGURE 1: Diagram of the four subcompartments of the endoplasmic reticulum.
(A) The nuclear envelope (NE) is shown with nuclear pores (NPs) and ribosomal particles attached to the outer membrane. (B) The rough ER (RER) is continuous with the NE and consists of stacked fattened saccules, whose limiting membranes have numerous attached ribosomal particles. (C) Transitional ER (tER) is composed of a RER subdomain continuous with a smooth ER (SER) subdomain consisting of buds and tubules devoid of associated ribosomes. (D) The smooth ER (SER) is devoid or almost free of ribosomal attachment and composed of a network of interconnecting tubules. The cistemal space forming the ER lumen is also shown (Modified from Lavoie and Paiement, 2008).
4 Proteomics
Proteomics is the study of the complete protein complement or the proteome of the cell. The proteome is dynamic and is in constant flux depending on the physiological state of the cell or depending on its pathological state (Cui et al., 2004). Hence, proteomic study allows the identification of protein changes caused by the disease. Prote in changes occurring during neoplastic transfonnation affect cellular function and changes may include altered expression, differential protein modification, changes in specific activity, and unusual localization (Ai et al., 2006). Proteomics is currently considered as a powerful tool for studying protein expression and has been widely applied in field of cancer research (oncoproteomics) (K.olch et al., 2005; Sun et al., 2007). In addition,
proteomics analysis can provide a profile of quantitative ,J'rotein expression; this requires methods that are able to provide efficiently accurate and reproducible differential expression values for proteins in two or more biological samples (Kolkman et al., 2005). Proteomics involves the analysis of protein mixtures in a cellular environment (Drahos et al., 2005) or in an organelle (Brunet et al., 2003).
4.1 Organelle Proteomies
Organelle protèomics involve the study of proteins of intracellular organelles. This can be achieved initially by subcellular fractionation, which is the essential step among enrichment techniques in proteomics research, especially for study of organelles. Thus, subcellular fractionation allows the separation of organelles based on their physical
/
or biological properties. In fact, subcellular fractionation is based on two major steps, which include homogenization (disruption of the cellular organization) and fractionation of the homogenate to separate the different populations of organelles followed by purification techniques (Stasyk and Huber; 2004).
4.1.1 Advantages and disadvantages of organelle proteomics
Organelle proteomics is a sensitive and more reliable way of studying proteins tban tissue or cellular proteornics, since it allows us to study proteomics of small volume of isolated organelles, which are enriched in high protein content (Au et al., 2007). Organelle proteomics allow for precise prote in localisation inside the ceU and is linked to organelle function. Thus, organelle proteomics provides a unique opportunity to Hnk: proteornics data with subcellular functional unit (Le. organelle) (Brunet et al., 2003).
On the other hand, contamination of organelle samples is a main problem in organelle proteornics studies (Au et al., 2007).
OBJECTIVES
Paiement and colleagues (Paiement et al., 1992) found that the microinjection of endoplasmic reticulum (ER) membranes from adult rat liver into blastomeres ofXenopus laevis embryos led to inhibition of cellular division in the blastomeres, while the microinjection of endoplasmic membranes from liver nodules of rats treated with aflatoxin BI or from liversundergoing regeneration after partial hepatectomy did not. These membrane transplantation studies suggested the presence of cell cycle specifie factors in association with ER membranes in adult rat liver. factors which were absent or modi:fied in ER membranes from liver turnors. These microinjections results led to the consideration that the protein composition of ER is different in normal non-dividing cells compared with that of ER from rapidly dividing tumor cells. We have now used mass spectrometry to examine the difference between these two types of ER and to try to explain why ER from rapidly dividing tumor cells are more compatible with cytoplasmic environment of frog blastomeres.
For our study, we used a purified ER from control rat liver and dissected liver turnor nodules. Endoplasmic reticulum membrane fractions enriched in rough and smooth microsomes were isolated by differential centrifugation and sucrose gradient sedimentation from rat liver homogenates (Paiement et. al., 2006). First mass spectrometry was used in order to identify the proteome profile of the ER derived from control rat liver and nodular liver, then we used one-dimensional gel electrophoresis in order to separate different proteins foHowed by immunoblot (using primary ,and secondary antibodies) to identify and to determine the concentration of ER proteins from control rat liver and from dissected liver tumor nodules. Tables have been generated to compare differentially expressed ER proteins with differentially expressed proteins in nodular liver. Other Table has been generated to identify tyrosine-phosphorylated proteins. Tables were done by using Excel and SPSS software programs, in order to calculate and to identify the overexpressed. underexpressed and equally expressed proteins in turnor ER, means, s~dard deviat~on and
P-values
calculations. Graphs havebeen generated to calculate the relative concentration of novel proteins, folding proteins, peptide loading complex and proteasome subunits. Densitometry was used to determine the relative concentration of protein bands in control and in tumor ER, those bands that were detected initially by immunoblot.
Our final goal was to study the expression of proteins involved in the process of liver cancer. Consequently, we hope that our work can serve to select the interested proteins for further specific isolated experiments to study in details the related underlying signaling pathways and the corresponding cytosolic and/or nuclear interactions.
The main objectives of this thesis were to perform the following:
- Determine the protein composition of ER fractions from control and tumor liver as weil as to detetmine the identity of the overexpressed and underexpressed proteins in tumor ER Also, to detetmine the identity of proteins that did not change in expression in tumor ER relative to controlliver ER
- Confirm by immunoblot and densitometry the relative expression of specific proteins in tumor ER and controlliver ER
- Compare relative concentrations of specific proteins in both ER and cytosolic fractions from dissected liver tumor nodules with similar fractions from control rat liver.
- Use bioinfonnatics tools to. determine the unknown proteins based on prote in domain . analysis.
AUTHOR'S CONTRIBUTION
Certain results shown in this thesis had been presented in scientific meetings as follows:
1 Posters
• Roy L., Abdou E., Thibault G., Hamel N., Taheri M., Lanoix J., Keamey R., Paiement
J.
Molecular machines of the endoplasmic reticulum cancer. 2nd IRCM Meeting on Systems Biology: Molecular Networks. Montreal, Quebec, Canada. March 11-12, 2008.• Abdou E., M Taheri M., Roy L., Thibault G., Servant F., Keamey R., Paiement
J.
Carcinome hépatoceUulaire: composition protéique du Réticulum,
endoplasmique. The 24th Annual Scientific Day, Department of Pathology and Cell Biology, University of Montreal, Canada. May 2007.• Abdou E., Taheri M., Roy L., Thibault G., Boismenu D., Hayes
J.,
Servant F., Kearney R., PaiementJ.
The Proteome of the Endoplasmic Reticulum in Cancer Molecular Biology of the Cell. American Society of CeU Biology. December Supp., 2006.2 Article (under preparation)
• L. Roy, E. Abdou, G. Thibault, N. Hamel, M. Taheri, R. Kaemey and J. Paiement Quantitative proteomics analysis of the endoplasmic reticulum in hepatocellular carcinoma: An organelle perspective on cancer.
MATERIALS AND METHODS
1 Induction and characterization of rat liver tumors
The animal model was obtained according to procedure previously described by Paiement and colleagues (Paiement et aI., 1992) as follows:
1.1 Induction of rat Iiver tumors J
- Male Fischer rats (F344, Charles River Canada Inc., St-Constant, Quebec, Canada) weighing 150 ± 10 g were maintained on rat chow (Prolab Agway, Charles River Canada Inc., St-Constant, Quebec, Canada) for 1 week before the start of the experiment. They were kept in a conventionaIly maintained animal facility (2 animaIs / cage) under conditions of controlled temperature (22 ± 2°C), humidity (50 ± 10%) and lighting (12-h-light: 12-h-dark' daily cycle). Water and food were available ad libitum. Care of the animaIs conformed to guidelines established by the Canadian Council on AnimaI Care (Ottawa, Ontario).
- Fifty rats were separated into two groups. Forty rats in group 1 were feed aflatoxin BI (AFB 1) (Sigma ChemicaI Co., St. Louis, Missouri, USA). The rats were treated with AFB 1 according to Butler and colleagues (Butler et al., 1969), but with the following modifications. Aflatoxin BI was first dissolved in dimethyl sulfoxide and then provided in a continuous supply in the drinking water at a concentration of 1 ~g!ml in darkened bottles. Group Il rats were provided with water containing the sanle amount of dimethyl sulfoxide as provided in group 1. Water containing AFB 1 or vehicle alone was prepared fresh each week and stored in a cold room (4°C) until needed; it was usually changed 3 times / week, for a total of 55 weeks. This 55-week periodrepresented the total number of days during which rats were treated with AFB 1.
1.2 Charaderization of rat liver tumors
1- Rats were starved 48 h before they were killed (Eriksson et al., 1983). At different times after initiation of treatment, livers were recovered and placed immediately in ice-cold sodium immidazole butTer (pH 7.4) containing 0.25 M sucrose. Small fragments of tissue were dissected from the edge of the median lobe and placed in fixative and the remaining mass of liver (~ 15 g) was used for subcellular fractionation.
- Light and electron microscope studies on the same tissues that were employed to prepare subcellular fractionations. Hence, tissue pieces were fixed by immersion and to maximize fixation efficiency, a fixation and embedding protocol estabHshed for use with developing embryos was used (Kalt and Tand1er, 1971). Histopathologieal diagnoses were based upon criteria described by the eommittee on histologie classification of laboratory animal turnors, Institute of Laboratory ~ma1 Resources (Resourees. 1980):
- T 0 determine' the extent of cell proliferation oceurrÎng after various proliferative stimuli. a single injection of eH] thymidine (New England Nuclear, Canada; sp.aet., 70 Ci/mmol; 1 Ci
=
37 GBq) was given intrapertionea1ly (250 f.1Ci) 1 h before sacrifice. Pieces of liver (1-3 mm) were obtained ànd immersed in the fixative of (Kalt and Tandler, 1971). Following dehydration and embedding in paraffin,seetions (5 f.1m thick) were eut serially, put on slides and stained with hematoxylin and eosin. The sections wereeoated with Kodak NTB2 emuslion and processed for radioautographie analysis (Kopriwa and Leblond, 1962).- Light microscope radioautography was carried out to determine the eH] thymidine-labeling index of hepatocytes in turnor-bearing rats. The thymidine-labeling indices for cells in tumors were compared with those of surrounding liver tissue. Results from 2 different experiments showed higher labeling indices for cells within tumors (4.2- to lO-fold greater eH] thymidine incorporation). The higher labeling indices found in the nodules indicates the higher rate of cell proliferation within these, liver regions.
- Macroscopic analysis of liver from rats treated with AFB 1 for up to 45 weeks revealed the presence of multiple white foci
«
5mm). At 51 weeks after initiation oftreatment, 2-'
rats were sacrificed. The liver of 1 rat displayed small foci
«
5mm) and the liver of the other rat revealed the presence of large nodules (> 20 mm). The livers of rats examined 52 weeks or later after initiation of treatment with AFB 1 aU contained large nodules, several measuring > 20 mm in diameter.- Light microscopy was camed out on the livers of control and AFB 1 treated rats. Control rat liver and dissected liver tumor nodule's were fixed in Bouin's Fixative and embedded in paraffin. Ten microns serial sections were cut and stained with Haematoxylin and Eosin. Livers from control rats revealed a normal histology; hepatocytes were mainly arranged in single layers or cords. Livers from rats treated with carcinogen for periods from 21 to 51 weeks contained small foci measuring < 5mm in diameter and had a different histology from that of normal liver. The foci often contained ceIls with increased amounts of lipid and exhibited different tinctorial properties. The livers of rats examined after treatment with carcinogen for > 51 weeks all contained multiple large nodules measuring > 5mrn in diameter. These consisted of ceIl organizations classified as typical for trabecular hepatocellular carcinoma as weIl as for glandular hepatocellular carcinoma. Sorne nodules contained mixtures of the se 2 types of tissue organizations and sorne contained an undifferentiated tissue organization.
In summary, the histological features of the livers of these experimental animaIs were essentially similar to those described previously for rat liver tumors induced by AFB 1 (Butler and Jones, 1978; Jones and Butler, 1978).
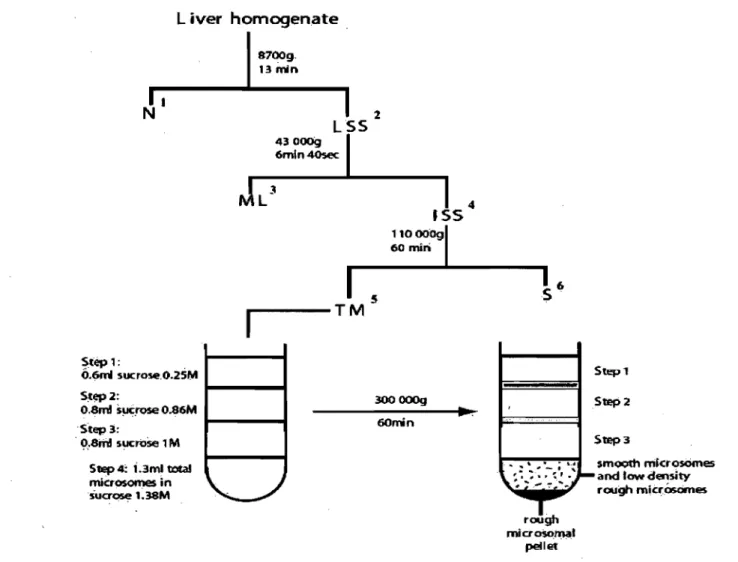
2 Preparation of subcellular fractions
1AH subcellular fractions used in the study were derived from adult rat control liver and dissected liver tumor nodules of adult rat AFB l-induced HCC as described before. The macroscopic appearance of a rat liver with associated tumor nodules is shown in Figure 2. The steps were summarized as shown in Figure 3. These fractions include microsomal (smooth and rough) and cytosolic fractions.
Subcellular fractions isolation and characterization was done based on well-. estabHshed protocols (Paiement et al., 2006). The protocol used can be summarized as follows:
- Briefly, minced rat liver tissue was homogenized. The homogenate was later on submitted to a series of differential centrifugations to allow separation of different cellular co~ponents and total microsomal fractions.
- Total microsomes, containing membrane derivatives from different sources (RER and SER), were resuspended in 1.38 M sucrose and placed under 3 steps gradient of 1 M, 0.86 M and 0.25 M sucrose, and centrifuged (usÎlig Beckman SW 60 rotor at 300 OOOg for 1 hour).
- The rough microsomal faction was extracted from the residual pellet below the step gradient. It was then either washed with 4
mM
imidazole buffer (pH 7.4) containing 0.25 M sucrose.- The smooth microsomal fraction, which includes both ~smooth microsomes and low-density rough micrososmes, was extracted from the upper half of the 1.38 M sucrose step gradient. This fraction was washed once and resuspended in sucrose.
- The cytosolic fractions were obtained from the supematants remammg after sedimentation of total microsomes at 100 000 g. Renee, the name SI 00 for the cytosolic fractions used in our study.
- Protein concentrations were detennined using the Lowry method (Lowry et al., 1951) with the bovine serum albumin as the standard.
1 Une Roy was respoJ)sible for treatment of rats with aflatoxin to induce rat liver tumors, was
FIGURE 2: Dissected liver tumor from rat treated with aflatoxin BI.
Photomicrograph show isolated livers after aflatoxin treatment. The asterisk shows a large liver tumor nodule. Such nodules were later on subjected to dissection and extraction of the subcellular fractions used for the Mass spectrometry proteomic analysis and immunoblot experiments.
L iver homogenate
I~'
13 min1.
N1
2 LSS 4300091
6mln4Os«1
4 .S51
5 11000agl 60 min •I---™
Stèp 1: O.6m1 sucrose.O.2SM S:tE!P2: .... - -.... O.Sm! 5!JC.1"Q$E! 0.86M Step 3: I - - - t . ,?,.Srn! 5UCrOSe 1 M StEp 4: i .3ml tJOitaI microsomes in 5ucr05e 1.38M 3OO000g....
OOmn Step1 Step2 Step3 • " •• _ ; •.• smooth microsOmes\.~ ~ ';" ~. ' :) ... and low density or .... " ; ":' '#0> rough m~c~ôsorn@s
T
rough
micr~n:J<Il pellet
FIGURE 3: Flow diagram summarizing the fractionation protocol used to prepare ER subfractions from control rat liver and from dissected liver tumor nodules. Fractionation protocol used to purify ER derivatives is composed of two main steps where the liver homogenate was subjected to differential centrifugation followed by gradient centrifugation using a sucrose step gradient (Paiement et al., 2006).
IN: Nucleus
2 LSS: Low-speed supematant.
3 ML: ML fraction, containing lysosomes and mitochondria.
4ISS: Intermediate-speed supematant
5 TM: Total microsomes. 6 S: supematant
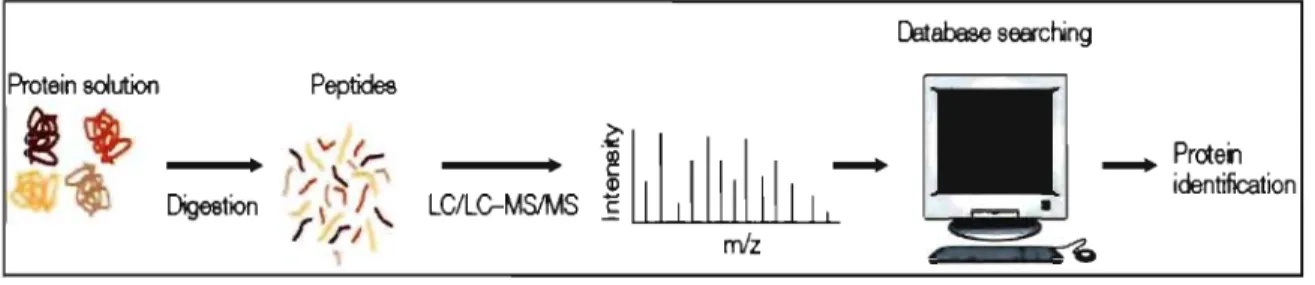
3 Mass speetrometry
The identification of proteins based on mass spectrometry analysis has opened new opportunities for the study of proteins of organelles like ER (Yates .et al., 2005).
,
Massspectrometry can show the sequence of a peptide; this process passes by several steps starting with organelle sampling, purification analysis, gel separation and digestion gel cutting. This is followed by accumulation of mass spectrometry, peptide identification (by using Mascot software program that does the peptide and protein identification by comparing the mass spectrometry raw file results to all theoretica1 peptide spectra calculated to obtain a peptide sequence), scoring and clustering (protein list) and finally annotation and interpretation (proteome). Figure 4 briefly summarizes the steps involved.
3.1 Protein separation, mass spectrometry and data analysis
Samples (from 4 different subcellular fractionation experinients) were solubilized in Laemmli buffer and 75 J.lg proteins of each sample were 10aded on 5.2 cm ID SDS 1. PAGE with 7-15% gradient acrylamide. The gel was stained with Coomassie Brilliant blue G (Sigma, Oakville, Ontario, Canada). The full lane has then been subjected to automated band excision, to generate 28 bands per lane. Following transfer to a 96-well tray, proteins from gel bands were subjected to reduction; alkylation and in-gel tryptic digestion by automation in a MassPrep Workstation (Micromass, Manchester, UK) as previously described (Wasiak et al., 2002). Briefly, gel bands were cut into 1 mm3 gel pieces and put in separate wells of a 96-wel1 sample tray. Gel pieces were then prewashed by two 10 minute incubations in 100 J.lI HPLC 2 grade water. AIl steps up to trypsin addition were done at 37°C. After removal of water, gel pieces were destained by incubating 10 minutes in 50 J.ll of 100 mM ammonium bicarbonate followed by addition of 50 fli of 100% acetonitrile and incubating an additional 10 minutes. Pieces were then incubated for an additional 5 minute in 100% acetonitrile and liquid removed. Destained gel pieces were then sequentially reduced and alkylated by incubating 30 minutes in 50 J.ll of 10 mM dithiothreitol, adding 50 J.lI of 55 mM iodoacetamide, incubatjng 20 minutes, adding 100 J.ll of 100% acetonitrile and incubating 5 minutes. Liquid was
removed and gel pieces were washed by incubating 10 minutes in 50 III of 100 mM ammonium bicarbonate, adding 50 III of 100% acetonitrile, incubating 5 minutes and removing liquid. After dehydration, gel pieces were dried 30 minutes at 37°C. Proteins were in-gel digested by adding 25 III of trypsin (6 ng/Ill in 50 mM ammonium bicarbonate, Promega sequencing grade modified trypsin, cat number V511A) and incubating 30 minutes at room temperature followed by 4 hours 30 minutes at 37°C. To extract peptides, 30 III of a mix containing 1 % formic acid and 2% acetonitrile was added, incubated 30 minutes at room temperature, and 30 III of the liquid was transferred into a new cooled (10°C) tray. Two additional extractions are performed. 12 III of a mix of 1 % formic acid and 2% acetonitrile and 12 III of 100% acetonitrile were added, incubation continued 30 min and 15 III removed and pooled with the tirst extraction. This , step was repeated with the transfer of an additional 15 III of extract yielding a final volume of peptide extract of 60 III at 0.54% formic acid and 15.9% acetonitrile.
Extracted peptides were then subjected t<;l mass spectrometry. The 96-well sample tray was kept in a Micro WeIl-plate Sampler (Agilent 1100 Series). Prior to injection, the precol~ (Zorbax 300SB-CI8, 5 mm X 0.3, 5 J.1m) installed on the 6 port Rheodyne valve of the Column Compartment Module, was conditioned with water containing acetonitrile (5%) and formic acid (0.1 %) supplied by a Isocratic pump (Agilent 1100 series) set at a flowrate of 15 ilL/min. A volume of 20 ilL of the tryptic digest solution was injected on the precolumn at 15 J.1L1min and the sample was washed for 5 min while. the flow through was evacuated to waste. The valve was actuated and the pre-column was back-flushed to the 75 mm i.d PicoFrit column (New Objective, Wobum, MA) (filled with 10 cm of Bio Basic C18 packing, 5 mm, 300 A) by the acetonitrile gradient (5-70% acetonitrile/0.1 % formic acid) supplied by the Agilent series 1100 Nanopump at 200 nL/min. Solvent A was water (formic acid 0.1 %) and solvent B was acetonitrile:water:formic acid (95:5:0.1). The linear gradient was started after the washing step. The mass spectrometer was a QTOF 3 Micro from Waters Micromass equipped with a Nanosource modified with a nanospray adapter (New Objective, Woburn, MA) to hold the PicoFrit column tip near the sarnpling cone. The capillary voltage was adjusted to get the best spraying plume at 35% B. MS survey scan was set to
1 s (0.1 s interscail) and recorded from 350 to 1600 mlz. In a given MS Survey scan, all doubly and triply charged ions with intensity higher that 25 counts were considered candidates to undergo MSIMS fragmentation. Fr<?m these, the strongest one was selected. MSIMS acquisition would stop as soon as the .total ion CUITent would reach 2800 counts/second or after a maximum time of 4 s. MSIMS scan was acquired from 50 to 1990 m/z, scan time was 1.35 sand interscan was 0.15 s. A second precursor ion would be selected from the following MS Survey scan. The doubly and triply charged selected ions were fragmented with the following preprogrammed collision energies: (i) For doubly charged ions, the collision energies are 25 eV for the range 400 to 653 mlz, 26 eV
. .
for the range 653 to 740 mlz, 28 eV for the range 740 to 820 mlz, 32 eV for the range 820 to 1,200 mlz, and 55 eV for the range 1,200 to 1,600 mlz. (ii) For triply charged ions, the collision energies are 14 eV for the range 435 to 547 m/z, 19 eV for the range 547 to 605
mJz, 24 eV for the range 605 to 950 m/z, and 35 eV for mJz higher than 950 mJz.
Mass spectrometrie data were acquired by employing the Data Directed Analysis feature available on MassLynx (Micromass) operating software with a l, 1,4 dut y cycle (1 second in MS mode 1 peptide selected for fragmentation, maximum of 4 seconds in MSIMS acquisition mode). MSIMS raw data were transferred from the QTOF Micro cC)mputer to a 50 terabytes server and automatically manipulated for generation of
peaklists by employing Distiller version 1.1
(http://www.matrixscience.c~mldistiller.htmls) software with peak picking parameters set at 20 as for Signal Noise Ration (SNR) and at 0.7 for Correlation Threshold (CT). The peaklisted data was then searched against a copy of the National Center for
Biotechnology Information (NCBI) non redundant
(ftp:/lftp.ncbi.nih.gov/blastldb/FASTAlnr.gz) data base (NCBI nrdb January 05, 2007}by employing Mascot (http://www.matrixscience.com) version 2.1.04, and restricting the search to up to 1 missed (trypsin) cleavage, fixed carbamidomethyl alkylation of cysteines, variable oxidation of Methionine, 0.5 mass unit tolerance on parent and fragment ions, and monoisotopic. The resulting Iist of peptide identifications was then processed to eliminate those likely to have arised by chance. Thus, only peptide identifications with a probability of occurring by chance of < 0.05 were retained (i.e. only