Design of an A.C. susceptometer based on a cryocooler
Ph. Vanderbemden
University of Liège, S.U.P.R.A.S., Montefiore Electricity Institute, B28, Sart-Tilman, B-4000 Liège, Belgium
This paper describes a simple and low-cost experimental setup intended for low temperature measurements under a time-dependent magnetic field. A typical application of this system is the determination of A.C. susceptibility and flux profiles of high-Tc superconductors. The A.C. magnetic field is generated by a sheeted iron-cored electromagnet. The device is based on a commercial closed-cycle helium refrigerator. A sample holder made of a polycrystalline silicon rod is shown to establish a good thermal contact between the sample and the cold head; it allows temperatures down to 20 K to be achieved. Experimental details are described and illustrative measurements on high-Tc superconductors are included. The performances and limitations of this system are discussed.
Keywords : A.C. magnetic measurements ; high-Tc superconductors ; measuring instruments
The measurement of A.C. magnetic susceptibility as a function of temperature is a convenient and straightforward way to characterize materials. In the case of superconductors, the real part (χ') of A.C. susceptibility demonstrates flux exclusion due to shielding currents, whereas the imaginary part (χ") yields information about A.C. energy losses and relaxation processes1-4. Careful examination of both components can reveal a granular micro structure and the presence of impurity phases5, which determine the feasibility of the materials for practical applications. In addition, when varying the applied magnetic field amplitude and/or frequency, results generally allow estimation of the critical current density Jc6,7 and other more fundamental physical parameters, such as the thermal activation energy of flux lines4 or pinning lengthscales8.
Besides providing a detailed characterization of compounds, A.C. susceptibility measurement is fast and does not require any electrical contact. That is probably the reason why this measuring technique is so widely used for studying High-Tc Superconductors (HTS). The design of a simple and low-cost home-made susceptometer is
therefore of considerable interest. The purpose of the present work is to describe an original system intended for A.C. magnetic measurements on HTS. Some general principles about the measuring technique and the apparatus conception are discussed in the next section. The section 'Experimental setup' deals with experimental details. Finally results are presented and discussed.
Basic measurement technique
The principle of A.C. susceptibility measurement is often based on a coaxial mutual inductance technique (Figure 1a): a primary coil generates an A.C. magnetic field, eventually superimposed to a D.C. magnetic field, and two secondary oppositely wound coils form the basic unit of the measuring circuitry1-3. In the absence of a sample, the voltage measured across these two detection coils is ideally zero. Inserting a sample centred in one of the secondary coils will result in a non-zero signal directly proportional to the amplitude of A.C. susceptibility, χ
= χ' - jχ". The system described in the present paper involves sensing the sample's magnetic response by using a single detection coil surrounding the sample (Figure 1b). In this case, the measured e.m.f. across the pick-up coil
signal is proportional to the A.C. permeability µ = µ0[(1 + χ') - jχ"]. Although this measuring technique is weakly sensitive for very low susceptibility materials (|χ'|<<l), it is well adapted to HTS specimens in the superconducting state, for which the χ' value is contained between -1 and 0.
Most commercial susceptometers and those reported in the literature1-5 are based on liquid helium cryostats. The liquid helium is simultaneously used at two stages: (i) for cooling the sample down to 4.2 K and (ii) for cooling a superconducting magnet which provides large D.C. magnetic fields. The purpose of the present work is to eliminate daily liquid helium expenses and maintenance costs by using a Gifford-McMahon closed-cycle helium refrigerator as a cooling power. The superconducting magnet is replaced by an iron-cored electro-magnet which generates both A.C. and D.C. magnetic fields.
Figure 1 Schematic diagram illustrating the principle of A.C. magnetic measurements using (a) a primary coil and two oppositely wound sensing coils, (b) an electro-magnet and a single sensing coil
(a)
sample
primary coil
2 secondary coils
primary coil
sample
1 secondary coil
sheeted iron core
(b)
Generally speaking, the cooling power produced by a two-stage cryocooler—commonly called 'cold head'—is located on the external surface of the second stage cylinder which a sample holder is usually attached to. The shape of the sample holder depends on the physical property to be measured. In our case it should allow the sample to be located between the poles of the electro-magnet, as depicted in Figure 1b. The choice of the material to be used as a sample holder in an A.C. magnetic measurement is a tricky matter because it requires a combination of the three following properties:
1. low magnetic susceptibility;
2. poor electrical conductivity (σ), in order to avoid eddy currents which may cause a deviation of the flux lines as well as significant phase errors;
3. high thermal conductivity (K),to help achieve a thermal contact between the sample and the cold head. Despite their high thermal conductivity, metals are not suitable owing to their high electrical conductivity. The range of candidate materials is thus restricted to a few non-metallic compounds with high Κ. They are
summarised in Figure 2. Thermal conductivity of copper is plotted on the same graph for comparison. Note that these data, extracted from the literature9-11, are merely indicative since they are sensitive to extrinsic factors, such as impurities concentration or surface roughness12,13.
Figure 2 Thermal conductivity vs. temperature data for Cu and non-metallic crystals: Al2O3, Si, BeO, AlN
Temperature (K)
10 100Th
erma
l con
d
u
c
ti
vit
y
(W/
m
.K
)
102 103 104 Cu Al2O3 Si BeO AlNAmongst the insulating materials, the highest thermal conductivity is, on average, obtained for beryllia (BeO) and sapphire (Al2O3). Beryllia, however, has to be rejected because of its high toxicity. On the other hand, sapphire is quite expensive and difficult to machine. Aluminium nitride (AlN) is better in these respects, but has a smaller κ. For semiconducting materials, silicon is the best heat conductor; its thermal conductivity even exceeds that of copper from 30 K to 120 K. This corresponds to the temperature range of interest while studying magnetic properties of HTS. Concerning electrical properties, the room-temperature resistivity of silicon lies in the range 101-103 Ωm, depending on purity12. Although these values are well below what is expected for insulators ( > 1010 Ωm), they are sufficiently high to prevent an applied A.C. magnetic field from creating eddy currents inside a small silicon piece. This property remains true at low temperatures since the resistivity of a semiconductor globally increases with decreasing temperature. Moreover silicon is weakly diamagnetic and has a susceptibility of -3.9 × 10⁻¹¹ (S.I.), almost temperature independent14. Finally, let us notice that silicon is brittle but can be easily shaped using diamond tools.
From the above discussion, it can be concluded that thermal, electrical and magnetic properties of silicon make it attractive for low temperature applications. This material was thus chosen as a sample holder of the susceptometer described in this paper.
Experimental setup
Cryogenic system
A detailed diagram of the cryogenic system is shown in Figure 3. The vacuum enclosure, required for proper
operation of the cold head, consists of a metallic part and a Pyrex glass tube, sealed on the top by means of a brass cylinder and a viton O-ring. A turbomolecular pumping system allows pressures down to 10-6 mbar to be achieved at room temperature.
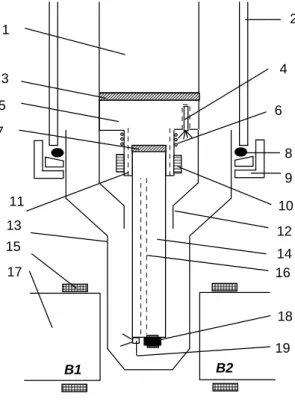
Figure 3 Schematic diagram illustrating the different parts of the cryogenic system: ( 1 ) second-stage cold station; (2) metallic cell; (3) thermal link (indium foil); (4) regulation sensor (carbon-glass); (5) copper block; (6) regulation 25 Ω heater; (7) thermal link (indium foil); (8) viton O-ring; (9) brass cylinder; (10) clamping ring; (11) longitudinal slots; (12) radiation shield; (13) pyrex glass cell; (14) silicon rod; (15) additional coils; (16) groove; (17) poles of the electro-magnet; (18) sample with its measuring coil; (19) temperature sensor (diode) 2 4 1 3 6 19 8 9 10 12 14 16 18 5 7 11 13 15 17 B1 B2
The sample holder is made of two materials: a cylindrical copper block and a 100 mm polycrystalline silicon rod. The upper part of the copper piece is in thermal contact with the second stage cold station. The lower end contains a 10 mm deep hole which the silicon rod perfectly fits into. Further mechanical cohesion is achieved by a clamping ring. Since the thermal expansion coefficient of copper is approximately ten times that of silicon10, three longitudinal slots are made in copper to prevent any contraction of copper at low temperatures from deteriorating the silicon piece. Thermal linkage between both materials is established by a 0.2-mm-thick indium foil in between. The sample to be measured is placed at the lower end of the silicon rod, stuck by a thin layer of GE 7031 varnish.
Two calibrated thermometers are used. First, a carbon-glass temperature sensor is inserted in a hole drilled in the copper block. This thermometer serves as control sensor. The heating power needed for temperature control is provided by a 25Ω Minco film heater mounted on the copper part. Second, a DT-470 GaAs diode is placed at the bottom surface of the silicon rod for measuring the temperature of the sample. A groove parallel to the long axis of the silicon rod facilitates electrical feed throughs. The copper radiation shield which surrounds the upper part of the sample holder improves cooldown speed as well as temperature stability without impeding the magnetic field distribution at the specimen location.
Measuring system
The magnetic field is provided by a home-made iron-cored electro-magnet. Four copper coils are wound onto a magnetic circuit consisting of a stack of insulated Si-doped iron sheets (thickness 0.4 mm). This system minimises the influence of eddy currents set up within the iron core at frequencies up to 20 kHz. Coils are fed either by A.C. or (A.C. + D.C.) current. The A.C. signal is generated by an HP8904a multi-function synthesiser followed by an C-audio power amplifier. A HP6030 source supplies the D.C. current. The magnitude of the applied magnetic induction µ0H ranges from 1 mT to 0.2 T in D.C. and from 0.1 to 10 mT in A.C. In addition,
the magnet can be rotated in a horizontal plane, which enables the applied field orientation with respect to the sample to be varied over a range of 180° with a resolution of 0.4°.
The measuring coil is made of 50 µm insulated copper wire tightly wrapped around the sample. Monitoring of winding under an optical microscope ensures that the coil is as close as possible to the specimen surface without allowing turns to overlap each other. The number of turns lies between 10 and 50, depending on the sample size. The coil is fixed in place with GE varnish. The sample and its measuring coil are then mounted on the sample holder, close to the GaAs diode. The induced voltage across the sensing coil is measured by an EGG 5210 Lock-In Amplifier.
Two additional coils (B1 and B2 in Figure 3) are wound on both magnetic poles of the magnet and are connected in series. The e.m.f. - dφ/dt across these coils is exactly 90° out-of-phase with the applied A.C. magnetic field and serves thus as phase reference for the Lock-In Amplifier. It is also monitored by a Philips PM2534 multimeter to probe the value of the applied magnetic field. All devices are controlled by a personal computer via IEEE-488 interface.
Results and discussion
In order to evaluate silicon piece performances, the temperature of the cold head as well as that of the sample have been recorded during the cooldown provided by the refrigerator; both temperatures are plotted in Figure 4. The temperature measured in the vicinity of the sample (TA) is shown to follow that of the cold station (TB) very closely. The thermal lag (TA-TB) reaches a maximum after 10 min cooling and then gradually decreases. This behaviour is likely due to the increase of thermal conductivity of both copper and silicon with decreasing temperature (cf. Figure 2). It should also be emphasized that the difference (TA-TB) never exceeds 5 K. From these considerations we can conclude that the thermal linkage between copper and silicon parts of the sample holder is really efficient.
Figure 4 Comparison between the temperature measured at the specimen location (TA) and that measured close to the cold station (TB) during the cooling process. The dotted line represents the difference between both temperatures (TA-TB) Time (minutes) 0 10 20 30 40 50 60 Te mp erat ure (K) 0 50 100 150 200 250 300 Tem pera ture lag ( T A - T B ) (K) 0 2 4 6 8 10 TA TB TA TB cold station copper silicon rod Cooling
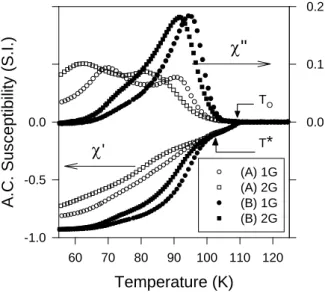
Illustrative A.C. susceptibility measurements on Bi2Sr2Ca2Cu3O10 high-Tc superconducting ceramics were carried out by using the present system. The studied materials were synthesised by employing a classical solid-state reaction method described elsewhere15. Results obtained for two different samples, subsequently called (A) and (B), are shown in Figure 5. The curves display the well-known double-step structure characteristic of ceramics, corresponding to intragranular and intergranular transitions1. The onset of superconductivity (TO) and the coupling between neighbouring grains (T*) occur noticeably at the same temperature for both samples. The shape of the intergranular peaks of χ" suggests that the weak links present in sample (B) are less dispersed in chemical content than those of sample (A). Flux profiles as well as further physical interpretation about intragranular and intergranular currents have been discussed in ref. 15. The curves presented in Figure 5 show that the experimental setup described in this paper provides accurate and reliable A.C. characterization of bulk superconducting samples. Note, however, that the measuring technique using a single sensing coil directly wound around the sample is practically applicable for bulk samples bigger than 1 × 1 × 2 mm3 only. Finally, it is worth mentioning that the use of a silicon rod as a sample holder is not restricted to experiments which involve applying a time-dependent magnetic field. Some other low-level voltage measurements may be improved by using non-metallic sample holders. As an example, cryocoolers habitually produce small mechanical vibrations of the measuring system. When applying large D.C. magnetic fields, these vibrations may give rise to eddy currents inside a classical copper sample holder. Hence parasitic magnetic fields are originated in the vicinity of the specimen and an undesirable noised voltage can be superimposed on the signal to be measured. In this respect the use of a weakly conducting material, such as silicon, can be beneficial in reducing the noise level in some sensitive measurements.
In conclusion, an experimental setup suitable for measurements under A.C. magnetic field has been constructed. It has been shown that a polycrystalline silicon rod can serve as a high thermal conductivity sample holder for temperatures down to 20 K. Therefore, it can be concluded that silicon is an alternative and interesting material which can be successfully used in building cryogenic systems.
Figure 5 Real (χ') and imaginary (χ") components of the A.C. susceptibility as a function of temperature measured on two different BSSCO-2223 high-temperature superconducting ceramics, denoted (A) and (B). A fixed frequency f = 1053 Hz was used. The value of the applied AC induction was either 1 G (circles) or 2 G (squares). Note that the imaginary component (χ") is expanded by a factor of 5 to clearly show the difference between both samples
Temperature (K)
60 70 80 90 100 110 120
A.C. Susceptibility (S.I.)
-1.0 -0.5 0.0 0.0 0.1 0.2 (A) 1G (A) 2G (B) 1G (B) 2G
χ
'χ"
TO T* AcknowledgementsPh. V. is grateful to the F.N.R.S. for the provision of a research grant, and to both Professor H.W. Vanderschueren and Dr. M. Ausloos for many fruitful discussions. The help of J. Simon and P. Harmeling for technical assistance is also acknowledged. This work is part of an U.Lg. Action de Recherches Concertées (ARC 94-99/174) grant from the Science and Research Department of the Communauté Française de Belgique.
References
1. Goldfarb, R. B., Lelental, M. and Thompson, C. A. In: Magnetic susceptibility of superconductors and other spin systems, ed. Hein, R. A., Francavilla, T. L., Liebenberg, D.H. Plenum Press, New York. 1992.
2. Chen, Q. Y. In: Hein, R. A., Francavilla, T. L., Liebenberg, D. H., editors. Magnetic susceptibility of superconductors and other spin
systems. Plenum Press, New York. 1992.
3. Couach, M., Khoder, A. F. In: Magnetic susceptibility of superconductors and other spin systems, ed. Hein, R. A., Francavilla, T. L., Liebenberg, D. H. Plenum Press, New York. 1992.
4. Gömöry, F., Supercond. Sci. Technol., 1997, 10, 523. 5. Nikolo, M., Am. J. Phys., 1995, 63, 57.
6. Campbell, A. M., J. Phys. C, 1969, 2, 1492.
7. Doyle, R. A. and McLachlan, D. S., Supercond. Sci. Technol, 1991, 4, S274.
8. Johnson, J. D., Campbell, A. M., Doyle, R. A., Athanassopoulou, N., Cooper, J. R.. In: Weber, H. W., editor. Proceedings of the 7th
International Workshop on Critical Currents in Superconductors. World Scientific, 1994:185.
9. Slack, G. A., J. Phys. Chem. Solids, 1973, 34, 321.
10. White, G. K. In: Experimental techniques in low temperature physics. Oxford: Clarendon Press, 1979.
11. Touloukhian, Y. S., Powell, R. W., Ho, C. Y., Klemens, P. G. In: Thermophysical properties of matter. New York: IFI/Plenum, 1970. 12. Slack, G. A., J. Appl. Phys., 1964, 35, 3460.
13. Berman, R., Cryogenics, 1965, 5, 297.
14. Durand, E. In: Magnetostatique. Paris: Masson et Cie, 1968.


![[PDF] Support de formation sur le développement Mobile Android Avec jQuery - Free PDF Download](data:image/gif;base64,R0lGODlhAQABAIAAAP///wAAACH5BAEAAAAALAAAAAABAAEAAAICRAEAOw==)