QGIS Calculation Method for Evaluation of ELF Electromagnetic Field
Exposure of General Public due to Overhead Power Lines
Wout Joseph1*, Kris Vanhecke1,C. Geuzaine2, Leen Verloock1, Matthias Van den Bossche1, Mart Verlaek3, Michiel Goethals3, Luc Martens1
1Department of Information Technology, Ghent University/IMEC, Technologiepark 15, B-9052 Ghent, Belgium 2 University of Liège, Dept. of Electrical Engineering and Computer Science, Allée de la Découverte 10, B-4000
Liège, Belgium
3Departement Omgeving, Bureau for Environment and Spatial Development – Flanders, Koning Albert II-laan 20 bus 8, 1000 Brussel, Belgium
*Corresponding author e-mail: [email protected]
Keywords: ELF, QGIS, transmission lines, overhead power lines, exposure of general public, Gmsh, GetDP
Summary (min 150 characters)
A calculation model (applying Gmsh and GetDP) and QGIS plug-in for simulating magnetic field contours of overhead power lines is presented. This model enables the estimation of the ELF exposure of the general population, relevant to environmental and urban planning, and can take into account future changes in the power grid. Simulations are validated with measurements and demonstrated for the region of Flanders, Belgium.
INTRODUCTION
Infrastructure for the transmission of electricity is a source of non-ionizing radiation. In recent years, the power grid has undergone changes to accommodate renewable and decentralized energy sources (wind, solar installations, biomass, etc.). Therefore, investments in the transmission infrastructure are required.
Epidemiological studies showed that time-weighted average exposure to power-frequency magnetic fields above 0.4 microT is associated with a small increase in the absolute risk of leukaemia in children (Ahlbom et al. 2001). The International Agency for Research on Cancer (IARC) evaluated extremely low frequency (ELF) magnetic fields as being “possibly carcinogenic to humans” (classification 2B) (IARC, 2002). Currently, no mechanism has been found that explains possible health risks of extreme low-frequency (ELF) radiation. When installing new infrastructure for the transmission of electricity, governments want to be able to determine geographical areas (i.e. contours surrounding the overhead lines) where the field strength exceeds a given magnitude and account for uncertainties mentioned above by applying precautionary measures. A calculation model enables governments and researchers to make field estimations for environmental and urban planning. A GIS (geographical information system) calculation model is also valuable for communication to the general public.
The goal of this paper is to develop a GIS calculation model for magnetic field contours of transmission lines and enabling an estimation of the exposure of the population. The GIS model is validated with on-site measurements in proximity to overhead power lines and with data
from the transmission system operator. Magnetic field exposure levels for the Flemish region will be presented.
MATERIALS AND METHODS
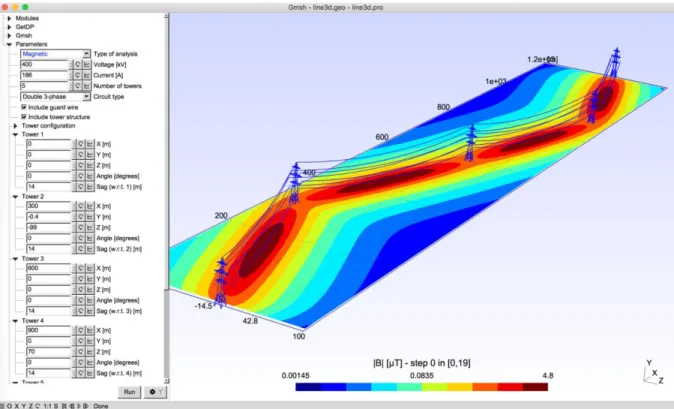
Tower geometry and conductor positions for single or double three-phase circuits are modelled using the open source mesh generator Gmsh (Dular et al. 1998). This is a 3D finite elements grid generator with build-in CAD system. Field calculations are performed using the multi-physics finite element solver GetDP (Geuzaine & Remacle 2009). Gmsh and GetDP are integrated in the graphical environment ONELAB (Geuzaine et al. 2012) (http://onelab.info). Parameters can be set interactively (on-the-fly) and automatic calculation of 3D conductor profile is performed. Fig. 1 shows an example of the calculation of the magnetic field of overhead power lines using Gmsh and GetDP. The arrangement of the electrical circuit (i.e. the arrangement of the phases, and in particular whether there is transposition when there are two circuits) and the maximum sag are accounted for in the calculation.
Figure 1: Calculation of B-field in microT of 400 kV overhead lines using GetDP and Gmsh. A plugin was created for QGIS 2.x to calculate the field contours and to report geographical areas where the population is exposed to a magnetic field in excess of a given magnitude. The inputs of the plugin are (i) geospatial vector data files with the location of towers and overhead lines, (ii) tower geometry information, and (iii) user input such as the maximum allowed field, custom scenarios with regard to mean load, transposition and maximum sag of the conductors. The processing part of the plug-in converts these inputs into parameters for Gmsh and GetDP, and imports the output of GetDP (coordinates and field strength) into QGIS. The plugin generates geographical areas, visualized by polygons, where the field strength exceeds the maximum field level under consideration. A reporting module then determines the number of people that reside in areas that overlap with these polygons. Fig. 2 shows the flow of the methodology of the QGIS plugin’s calculation model. Grid points where the magnetic field exceeds 0.4 microT are indicated by red dots.
Figure 2: Methodology of QGIS plugin (from left to right): overhead line shape file, narrowing down the considered area, dividing into grid points, calculation of 0.4 microT
contour, and visualization of 0.4 microT contour and grid points.
For the validation of the plugin, measurements were performed in proximity to 150-kV and 380-kV overhead power lines in the city of Lokeren, Belgium, in December 2017. The measurement procedure of Joseph et al., (2009) was used. The fields were measured by an electric- and magnetic-field analyzer of type PMM EHP-50C (accuracy magnetic field 6%). The current load was monitored during 24 hours by the operator; e.g., a current of 467 A was recorded for the 150-kV line at 4:02pm. The magnetic field variation is proportional to the relative current variation. Average and maximum field values (over 24 hours, a year, etc.) can then be calculated by averaging the time-varying current in the conductors.
RESULTS AND DISCUSSION
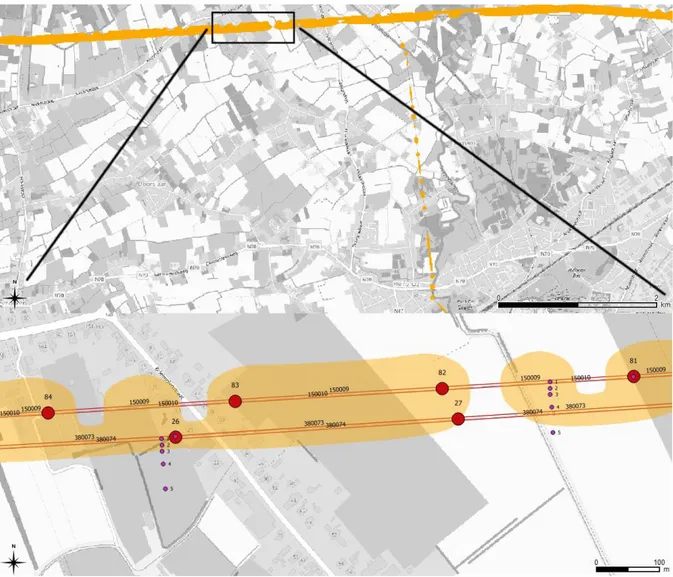
No phase transposition at the time of measurement was applied. The area where the measured value exceeds 0.4 microT, indicated in orange in Fig. 3(b), extends outward for approximately 55 meters and 25 meters from the 150-kV and 380-kV lines respectively. This agrees reasonably well with the simulation.
Fig. 3(a) shows the simulation of the magnetic fields in and around the city of Lokeren, Belgium, and Fig. 3(b) shows a more detailed view of the area where the measurements were performed. The 0.4 microT contours are indicated in orange. By default, the plugin assumes that each transmission line carries a mean load of 25% of its nominal current. The geospatial vector data does not include transposition information. This was disabled to account for a worst-case scenario. A grid size of 10 meters was considered to be sufficiently accurate for the large area being calculated.
The QGIS plugin can perform simulations for both large regions (with a strong tradeoff between grid resolution and calculation time) and smaller, specific areas with increased detail. A simulation of the entire region of Flanders on a 10-meter grid took approximately 14 hours on an Intel i7-4770 desktop processor. The grid size is the determining factor of the simulation time: selecting a 5-meter grid quadruples the processing time. The simulation runs in a single-threaded process, so on a powerful computer a large area can be broken up into multiple smaller sections and simulated in parallel. On the i7-4770, a processor with eight virtual processing
cores, the simulation time can thus be reduced by a factor of eight, if care is taken to divide the processing load evenly across all cores.
Figure 3: Calculation of 0.4 microT for (a) Lokeren, Belgium and (b) zoomed in on the area where the measurements were performed. Purple dots indicate the measurement locations. The plugin includes a scenario feature that allows government agencies and researchers to examine the potential impact of (proposed) changes to the electric power grid. For example, upgrading a transmission line to allow a higher current could result in additional urban areas where the magnetic field exceeds a given allowed magnitude.
CONCLUSIONS
In this paper, an easy to use calculation model (applying Gmsh and GetDP) and QGIS plugin for simulations of magnetic field contours of overhead power lines is presented. The tool enables us to make an estimation of the ELF exposure of the population and make field estimations for environmental and urban planning. Calculations are validated with on-site measurements of overhead lines and good agreement is obtained. Magnetic field simulations are performed for the region of Flanders, Belgium and are demonstrated through the plugin.
This work was financially supported by the department Environment, Flemish Government. We thank ELIA for the data of the power lines.
REFERENCES
Ahlbom A., Cardis E., Green A., Linet M., Savitz D., and Swerdlow A., “Review of the epidemiologic literature on EMF and health,” Environ. Health Persp., vol. 109, pp. 911–933, 2001, (Suppl 6).
Dular P., Geuzaine C., Henrotte F. and Legros W., “A General Environment for the Treatment of Discrete Problems and its Application to the Finite Element Method”, IEEE Transactions on Magnetics, 34(5), pp. 3395-3398, 1998.
Geuzaine C. and Remacle J.-F., “Gmsh, a three-dimensional finite element mesh generator with built-in pre- and post-processing facilities”, International Journal for Numerical Methods in Engineering 79(11), 1309-1331, 2009.
Geuzaine C., Henrotte F., Remacle J.-F., Dular P. and Sabariego R., ONELAB: Open Numerical Engineering LABoratory , Proceedings of the 7th European Conference on Numerical Methods in Electromagnetism (NUMELEC2012), July 3-5, 2012
IARC, “Static and extremely low frequency electric and magnetic fields,” IARC Monographs Eval. Carcinogenic Risks Humans, vol. 80, pp. 429–430, 2002, Int. Agency Res. Cancer Joseph W., Verloock L., and Martens L., “General Public Exposure by ELF Fields of 150-36/11 kV Substations in Urban Environment”, IEEE Transactions on Power Delivery, pp. 642-649, April 2009.