THE DISSOCIATIVE IONIZATION OF CARBON MONOXIDE
R. LOCHTInstitut de Chimie, Département de Chimie Générale et de Chimie Physique, Sart-Tilman Par, B-4000 Liège 1, Belgium
Abstract
The dissociative ionization of CO by low energy electron impact into C+ + O (or O-) and O+ + C (or C-) is investigated using ion energy and mass analysis. The kinetic energy distributions are studied as a function of the impinging electron energy. The threshold energies of C+ and O+ are measured as a function of the released kinetic energy. The formation of the products in their ground level and with a small amount of kinetic energy mainly occurs through predissociation. The CO+ electronic states involved in these processes are tentatively identified. New evidences have been found for the importance of dissociative ionization via autoionization.
1. Introduction
Up to now the careful analysis and the interpretation of the translational energy spectra of ionized fragments produced by dissociative ionization by means of low energy electron (or photon) impact has proved to be a powerful technique in order to obtain valuable information about repulsive and predissociated states of molecular ions. The dissociative ionization of diatomic molecules has been the subject of an increasing number of papers during the last few years. However most of the efforts have been focussed on the most important diatomic and triatom-ic molecules in aeronomy and astrophysics.
The main interest of a careful investigation of the dissociative ionization of a molecule like CO is twofold: (i) carbon monoxide is isoelectronic with the frequently investigated N2 molecule and (ii) the data
available from theoretical as well as experimental work devoted to this species are rather scarce.
Hitherto only the X 2Σ+, the A 2Πi and the B 2Σ+ states of CO+ are spectroscopically well known [1]. It is
only recently that experimental data became available above the 21.21 eV limit obtained with the He(I) resonance line at 584 Å. The 2∆ molecular ion state, excited by energy transfer with Ne in a discharge, has been observed at 21.76 eV in emission toward the A 2Πi state by Marchand et al. [2]. Rydberg series converging to the
higher lying C 2Σ+, E 2Σ+, F 2Σ+ and D 2Π states of CO+ were observed in absorption by means of electron synchrotron radiation [3]. These states, identified by photo-electron spectroscopy in the energy range of 21 eV to 29 eV, were excited by the 304 Å He(II) resonance line [3,4]. Rydberg series as well as highly excited states were detected in the electroionization efficiency curve of CO+ by Carbonneau and Marmet [5].
Even fewer are the theoretical calculations on the excited states of CO+ in the energy range where dissociative ionization occurs. Lefebvre-Brion and Moser [6] and Guerin [7] calculated the energy of Rydberg states and potential energy curves of the first electronic states of CO+. No data at all exist about CO+ electronic states which are repulsive within the Franck— Condon region.
Most of the data about the dissociative ionization of carbon monoxide are available from electron impact work. Beneath dissociation limits defined by appearance potential measurements on the fragments derived from ionization efficiency curves [8], only a few dissociative ionization studies have been made with ion energy analysis, necessary for unambiguous assignment. Hagstrum [9] performed ion energy analysis using the retarding potential technique, and appearance potential measurements on both C+ and O+ fragments. Stanton and Monahan [10] published the ion energy spectra of C+ and O+ at a fixed electron energy. In a double focussing mass spectrometer, Wankenne and Momigny [11] observed metastable transitions corresponding to the formation of C+ and O+ in the first field free region. Kinetic energy and appearance potentials of these species have been measured. Köllmann [12] was the first to investigate the ion energy distribution of C+ and O+ from CO as a function of the angle θ between the electron and ion beams. In principle this kind of experiment allows one to ascribe symmetries to the dissociative molecular ion states based upon Dunn's selection rules [13]. More recently, Smyth et al. [14] studied the dissociative excitation of CO by translational spectroscopy of long-lived high-Rydberg C and O atoms. Their results were interpreted in terms of the corresponding dissociative ionization process. Excitation thresholds were measured as a function of the kinetic energy carried away by the fragments.
After a preliminary paper [15] we shall report the complete results obtained for both C+ and O+ ions formed by dissociative ionization induced by low energy electron impact on CO.
2. Experimental
2.1. Apparatus and operating conditions
The apparatus as well as the experimental conditions have been described in detail elsewhere [16]. Briefly, the experimental set-up consists of four basic units: the ion source, the ion kinetic energy analyzer, the mass spectrometer and the detection system. The ions, formed in an ATLAS AN-4 Nier-type ion source, are focussed at the source exit slit and pass through a retarding region defined by two grids suitably spaced in order to obtain optimum resolution. After being kinetic energy analyzed, the ion beam is accelerated at the entrance hole of a quadrupole mass spectrometer. The ion current corresponding to the desired mass-to-charge ratio m/e is collected on a Cu—Be electron multiplier. The ion current is continuously scanned as a function of either the electron energy at fixed retarding potential or the retarding potential at fixed electron energy. Both signals, electronically differentiated, are stored in a multichannel analyzer and plotted on an X- Y recorder.
Unless otherwise stated, the operating conditions maintained during this work are strictly identical to those described in the previous studies of the dissociative ionization of O2 [16] andN2 [17]. The carbon
monoxide gas, purchased from Air Liquide, is of 99.997% purity. In the vacuum chamber a pressure of 4 x 10⁻⁷ torr is kept constant during operation. The electron trap current is stabilized at 1 µA. The ion accelerating voltage is set at 2.5 V in which conditions the fwhm of the first derivative of the retarding curve of CO+ is 70 meV. 2.2. Calibration and data treatment
2.2.1. Kinetic energy scale calibration
The origin of the kinetic energy scale is taken at the maximum of the first differentiated retarding curve of the CO+ molecular ion. When ionization efficiency curves are recorded at fixed retarding potential values, the latter are measured with respect to the same reference. The drift of the maximum of the kinetic energy distribution of CO+ is less than 10 mV over a week.
2.2.2. Electron energy scale calibration
To calibrate the electron energy scale for the appearance potential measurements of C+, the first ionization potential of CO+(X 2Σ+) at 14.013 eV, as determined by spectroscopy from limits of Rydberg series [1], is chosen as a reference. The ionization efficiency curve of CO+ has been recorded twice a day to take into account all possible drifts due to contact potentials. For the measurements of appearance energy of O+ the first threshold of C+, calculated to be 22.369 eV, is used as a reference and has been recorded twice a day. The linearity of the electron energy scale has periodically been checked with respect to the first ionization potential of CO+ at 14.013 eV.
2.2.3. Data handling and significant figures
The kinetic energy distribution spectra have been recorded as a function of the electron energy. Fifty measurements have been performed between the threshold of C+ and 40 eV. Near threshold the storage time is 48 to 72 h. The position of the maxima is the arithmetic mean of the measured data, and the quoted error represents the standard deviation σ. Being less than 0.1 σ the calibration error has been neglected. For the measurements (at least 10) performed in the case of C+ as well as of O+ at higher electron energies, the error mentioned above represents the average deviation from the arithmetic mean.
As far as ionization efficiency curves are concerned, averaged during 8 h at least, the threshold is measured at the intercept of the linear extrapolation of the highest slope of the one time differentiated ionization efficiency curve and the electron energy axis [16,18]. All threshold energies have been measured independently five times. The scattering of the data points for each measurement will be given by the average deviation δ, the magnitude of which is given by the error bars in figs. 6 and 8. The calibration error is found to be negligible with respect to δ.
Fig. 1. First derivative of the retarding potential curve of C+/ CO recorded for 100 eV electrons.
Fig. 2. First derivative of the retarding potential curves of C+/CO recorded near the appearance threshold of (1) CO+→ C++O and (2) CO→C++O-.
3. Results
3.1. Kinetic energy measurements
3.1.1. Dissociation channel CO →e− C+ + O- and C+ + O
Fig. 1 shows a typical translational energy distribution of C+ produced by 100 eV electrons on CO. This distribution exhibits a thermal or nearly thermal peak, a shoulder at around 0.3 eV and a broad structure around 2.5 eV. Köllmann [12] mentions a group of ions peaking at 0.5 eV and a broad distribution having its maximum at about 3.0 eV. Between the latter and the present work an unexplained large discrepancy is observed for the relative intensity characterizing each structure. Smyth et al. [14] observed a peak at 0.5 eV and a shoulder around 2.5 eV in the high-Rydberg atoms translational energy spectrum. The careful calibration of the kinetic energy scale with respect to the peak maximum of the CO+ distribution allowed us to observe an energy shift of the thermal peak. At 22 eV electron energy the C+ thermal peak is observed at (0 ± 3) meV. In the range of 24-40 eV this peak shifts to (12 ± 4) meV (see fig. 2). At 60 and 100 eV electron energy, the lowest energy peak maximum is measured at (45 ± 10) meV and at (70 ± 15) meV, respectively (see fig. 2 in ref. [15] ).
At electron energies near threshold, i.e. in the range of 21—30 eV, the C+ ion energy spectrum shows a fine structure between 0.0—0.7 eV translational energy (fig. 2). In table 1 are listed the position of the maxima in terms of the total energy, i.e. 28/16 times the measured values, which are directly comparable to spectroscopic data.
3.1.2. Dissociation channel CO →e− O+
+ C- and O+ + C
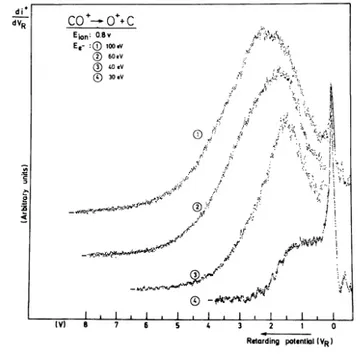
The kinetic energy distribution of the O+ ions produced by dissociative ionization by electron impact on CO only shows a narrow and nearly thermal peak followed by a broad bell-shaped curve. Typical distributions are reproduced in fig. 3 as observed at different electron energies. The nearly thermal peak is characterized by a maximum measured at (17 ± 3) meV (see fig. 4) for 25 eV electrons. The maximum of the high energy peak shifts from 0.8 eV at 30 eV electron energy, up to 2.0 eV at 100 eV. The fwhm increases with the impinging electron energy. These observations are in good agreement with Köllmann's experimental results [12]. The existence of a thermal peak near 0 eV kinetic energy has been confirmed by the most recent experiments of this author [12] as well as by appearance potential measurements (see section 4.2). No particular feature has been observed at low ion energies for electron energies near the appearance threshold of O+. However, between 30 and 40 eV electron energy, the sudden change in shape of the high energy peak as well as its sudden and important shift of 0.6 eV to lower ion energies for decreasing electron energies are noteworthy. In the range of 40—100 eV electron energy a shift of only 0.5 eV is observed.
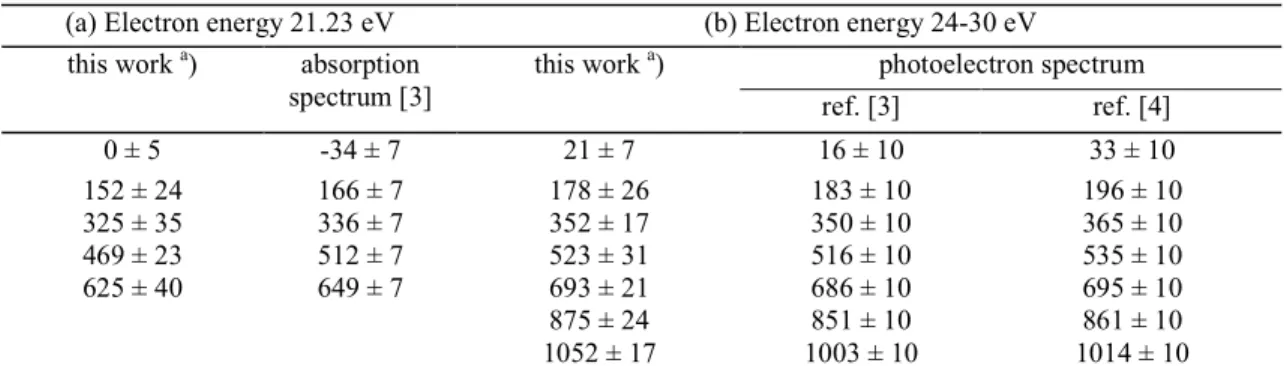
Table 1. Position (in meV) of the submaxima observed in the first derivative of the ion retarding curve of C+ from CO. The values obtained from the absorption spectrum and the photoelectron spectra [3,4] are calculated with respect to the dissociation limits D(C+—O-) = 20.904 eV and D(C+—O) = 22.369 eV. The energy conversion factor used is 1 eV = 8065.73 cm-1. The quoted error is the standard deviation σ
(a) Electron energy 21.23 eV (b) Electron energy 24-30 eV
photoelectron spectrum this work a) absorption
spectrum [3] this work a) ref. [3] ref. [4] 0 ± 5 -34 ± 7 21 ± 7 16 ± 10 33 ± 10 152 ± 24 166 ± 7 178 ± 26 183 ± 10 196 ± 10 325 ± 35 336 ± 7 352 ± 17 350 ± 10 365 ± 10 469 ± 23 512 ± 7 523 ± 31 516 ± 10 535 ± 10 625 ± 40 649 ± 7 693 ± 21 686 ± 10 695 ± 10 875 ± 24 851 ± 10 861 ± 10 1052 ± 17 1003 ± 10 1014 ± 10 a
Fig. 3. First derivative of the retarding potential curves of O+/CO recorded for 30, 40, 60 and 100 eV electrons.
3.2. Appearance potential measurements
3.2.1. Dissociation channel CO→e− C+ + O- and C+ + O
A set of first derivatives of C+ ionization efficiency curves recorded as a function of the retarding potential is shown in fig. 5. The critical energies, determined by the method described in section 2.2 are indicated by an arrow. Between 0.0 and 1.0 eV retarding potential, ionization efficiency curves have been recorded at intervals of 0.1 V; at higher energies these intervals are 0.2 and 0.5 V. The result of these measurements is presented in a kinetic energy-versus-electron energy plot as shown in fig. 6.
Straight lines, drawn through the experimental points with a slope of 16/28 result from the relation t(A+) = mBT/(mA+mB),
where t(A+) and T are the fragment ion energy and the total energy, respectively; mA and mB are the masses of A +
and B, respectively. For convenience in the discussion (section 4) the calculated position of the dissociation limits are listed in table 2 together with the corresponding dissociation products.
3.2.2. Dissociation channel CO →e− O+ + C- and 0+ + C
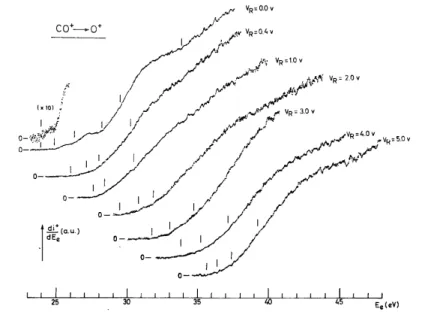
Fig. 7 shows first derivatives of ionization efficiency curves for O+ ions produced by dissociative
electroionization of CO, as recorded for the indicated retarding potential values. This latter parameter has been increased by steps of 0.2 V between 0.0 and 2.0 V. For the high ion energy range, an interval of 0.5 V has been chosen. The measured threshold energies of O+ have been plotted in a kinetic energy-versus-electron energy diagram shown in fig. 8. The experimental data fit fairly well the theoretical slope given by mC+/mCO = 12/28.
For clarity in the following discussion the calculated position of the dissociation limits are listed in table 3 together with the corresponding dissociation products.
3.2.3. The ionization efficiency curve of CO+
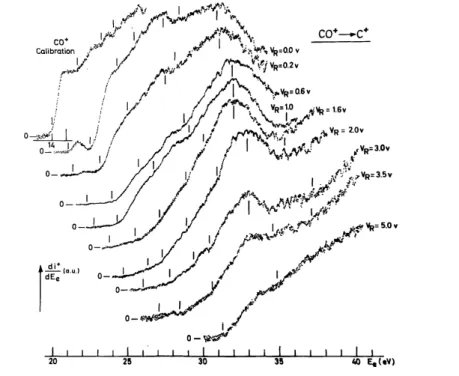
In fig. 5 the first derivative of the CO+ ionization efficiency curve has been reproduced as a reference for the electron energy scale calibration. Beneath the first steeply rising step corresponding to the first ionization energy of CO, features are observed at higher electron energies. The critical energies, listed in table 4 do not
correspond to known higher ionization limits of CO. Recently Carbonneau and Marmet [5] measured the electroionization efficiency curve of carbon monoxide and the fine structure detected between 15 and 18.5 eV has been ascribed to auto-ionization. The position of the structures observed in the present work, though incompletely resolved (the fwhm of the electron energy distribution is 400 meV instead of 80 meV in ref. [5] ) corresponds fairly well to the first and most intense members of neutral autoionizing states of CO. This is summarized in table 4.
Fig. 4. First derivative of the retarding potential curves of CO+(l) and O+(2) from CO recorded at 25 eV electron energy.
Fig. 5. First derivative of the C+ ionization efficiency curves recorded at indicated retarding potential VR. The
arrows show the position of the critical energies. The differentiated ionization efficiency curve of CO+is used for electron energy scale calibration.
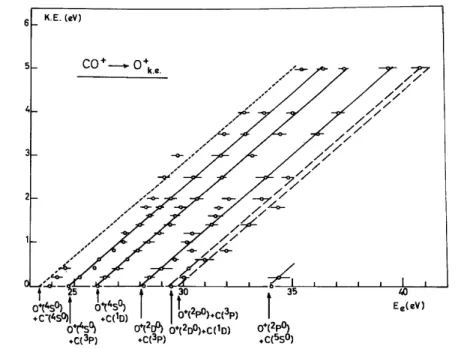
Fig. 6. Kinetic energy-versus-appearance energy plot for the dissociative ionization of CO leading to C++ O (or O-). For the explanation of arrows 1-7 see text.
Table 2. Dissociation limits and products for CO+→ C++ O calculated using D00(CO) = 11.109 eV [20], IP(CI)
= 11.260 eV [19] and EA(O) = 1.465 eV [24]. The energy levels of C+ and O are taken from ref. [25] (1 eV = 8065.73 cm-1)
Dissociation products Energy (eV) CO →C+(2P0) + O-(2P) (1) 20.904 CO+→C+(2P0) + O(3P) (2) 22.369 C+(2P0) + O(1D) (3) 24.337 C+(2P0) + O(1S) (4) 26.560 C+(4P) + O(3P) (5) 27.700 C+(4P) + O(1D) (6) 29.668 C+(2P0) + O(5S0) (7) 31.515 C+(2D) + O(3P) (8) 31.659 C+(2P0) + O(3S0) (9) 31.890 C+(4P) + O(1S) (10) 31.891 C+(2P0) + O(5P) (11) 33.109 4. Discussion
For the sake of clarity the two dissociation channels as well as the successively observed dissociation limits will be discussed separately in the following section.
Except those belonging to the X2Σ+, A2Πi and B 2
Σ+ states of CO+, the potential energy curves presented in this section are Morse potential curves. The parameters De, ω0 and re are tentatively evaluated from optical
and from photo-electron spectroscopic data. The potential energy curves drawn with dashed lines are proposed on the basis of the following discussion. As a consequence their significance is strictly qualitative.
4.1. Dissociation channel CO →e− C+ + O- at (20.91 ± 0.04) eV
As shown in fig. 5 the first threshold measured at (20.91 ± 0.04) eV belongs to the well defined peak in the first derivative of the C+ ionization efficiency curve, corresponding to an ion pair formation through
(1)
This process has been studied in detail earlier [18]. The examination of the C+ ion energy distribution near threshold (see fig. 3) allowed to describe process (1) in terms of a predissociation where the predissociated state CO* should be the 3dσ or 3pσ Rydberg state [5] (see table 1a). This is schematically represented in fig. 9.
The first straight line in fig. 6 starting at 20.91 eV and rising up to 3.5 eV kinetic energy carried away by C+ suggests that beneath the thermal peak, ion pairs with increasing translational energy are formed. This is in agreement with our previous experiments on O- produced by electron impact on CO [18] and with the O- kinetic
energy distribution obtained by Köllmann [12]. It is also evident from the ionization efficiency curve of ()- that several CO* states are involved in the ion pair formation over the range of 21—26 eV electron energy [18]. 4.2. Dissociation channel CO+→e− C+ + O
4.2.1. Dissociation limit at (22.35 ± 0.05) eV
As shown in fig. 6, a straight line with a slope of mO+/mCO =
16/28 starts at 22.35 eV and extends over 5 eV. The threshold measured at KE = 0 eV is in good agreement with the calculated value of 22.369 eV for the dissociation channel 2 listed in table 2. The ion energy range covered by this process is in good agreement with the experimental results of Kollmann [12] and Smyth et al. [14]. It has to be pointed out that the present experiment has been limited on the high energy side of the kinetic energy scale for signal intensity reasons. Because of this limitation, the first derivatives of the ionization efficiency curves at 4.0, 4.5 and 5.0 eV minimum kinetic energy had to be stored during 72 h in order to obtain a satisfactory signal-to-noise ratio.
As discussed earlier [15] the low energy portion of the straight line starting at 22.35 eV can be interpreted by the predissociation of the D2Π state of CO+. This interpretation is supported by the existence of a fine structure in the ion energy spectrum of C+ recorded near threshold (fig. 2). The position of the peak maxima (see table lb) agrees fairly well with the vibrational spacings of the D2Π state of CO+ observed by photo-electron spectroscopy [3,4]. This situation is represented schematically in fig. 9.
To interpret the medium and high ion energy portion of the straight line extrapolated to 22.35 eV, doublet and quartet Σ+, Σ-[2], Π [2] and ∆ states, arising from the 2P0—3P combination, could be involved. The interpretation is uneasy owing to lack of spectroscopic data and theoretically predicted potential energy curves. Fig. 7. First derivative of the O+ ionization efficiency curves recorded at different retarding potential values. The arrows locate the critical energies.
Fig. 8. Kinetic energy-versus-appearance energy plot for the dissociative ionization of CO leading to O+ + C (or C-).
Table 3. Dissociation limits and products for CO+ →C + O+ calculated using D0 0
(CO) = 11.109 eV [20], IP(OI) = 13.618 eV [19] and EA(C) = 1.268 eV [24]. The energy levels of C and O+ are taken from ref. [25] (1 eV = 8065.73 cm-1)
Dissociation products Energy (eV)
CO → C-(4S) + O+(4S0) (1) 23.459 CO+→ C(3P) + O+(4S0) (2) 24.727 C(1D) + O+(4S0) (3) 25.991 C(1S) + O+(4S0) (4) 27.411 C(3P) + O+(2D0) (5) 28.052 C(5S0) + O+(4S0) (6) 28.909 C(1D) + O+(2D0) (7) 29.317 C(3P) + O+(2P0) (8) 29.746 C(1S) + O+(2D0) (9) 30.736 C(1D) + O+(2P0) (10) 31.011 C(5P0) + O+(4S0) (11) 32.207 C(5S0) + O+(2D0) (12) 32.234 C(1S) + O+(2P0) (13) 32.430 C(5S0) + O+(2P0) (14) 33.928 C(5P0) + O+(2D0) (15) 35.532 C(2P0) + O+(4S0) (16) 35.987 C(5P0) + O+(2P0) (17) 37.226 C(3P) + O+(4P) (18) 39.584
However, Σ-← Σ+ transitions have to be excluded as being forbidden by Dunn's selection rules [13]. Furthermore, if not involved in the predissociation of the D2Π state [15], the transition to the 2∆r state of CO+
could be considered at least in the medium ion energy range. This state is mainly repulsive in the Franck— Condon region (see fig. 10). The angular distribution has to be anisotropic and has to show a maximum at an angle θ = 90° between electron and ion beams. Köllmann [12] showed recently that the angular distribution for C+ at 40 eV electron energy and 2.2, 3.2 and 4.2 eV ion energy exhibits an isotropic component, ascribed to Σ+ ← Σ+ transitions and an anisotropic component characterized by a minimum in the forward—backward
Table 4. Structure observed in the first derivative of the CO+ ionization efficiency curve. Critical energies are given in eV. The quoted error is the standard deviation σ
Energy State Parent
state ref. [5] a) this work
4dσ, υ = 0 A2Π 15.63
4dσ, υ = 1 15.80 15.75 ± 0.14
3pπ, υ = 0 B2Σ+ 17.28 17.41 ± 0.08 4sσ, υ = 0 B2Σ+ 18.20 18.24 ± 0.09
a) Mentioned error = ± 0.0125 eV.
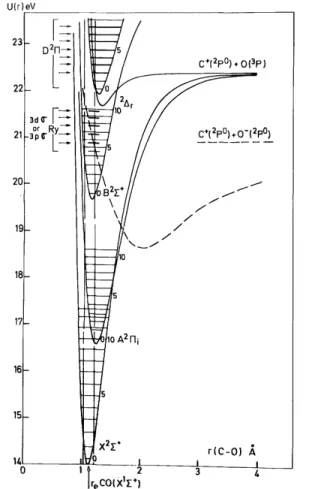
Fig. 9. Morse potential energy curves of CO+ in the energy range where the dissociative ionization processes CO → C+(2P0) + 0-(2P0) and CO+→ C+(2P0) + O(3P) are observed. The arrows show the position of the maxima observed in the C+ energy distribution.
direction. This observation made Π←Σ+ and ∆ ← Σ+ transitions unallowed [13]. At 40 eV electron energy, a large number of transitions are involved (see table 2 and fig. 6) and thus the angular distributions observed have to be ascribed to the superposition of different types of transitions. As a result a contribution of a ∆ ← Σ+ transition to these distributions cannot be ruled out.
Beneath the dissociative ionization via a possible transition to the 2∆ state, medium and highly energetic C+ ions can be produced by transitions to repulsive quartet states converging to the dissociation limit at 22.35 eV.
4.2.2. Dissociation limit at (24.23 ± 0.03) eV
curve is in fairly good agreement with the calculated dissociation limit at 24.337 eV for process 3 in table 2. This process has been observed by Smyth et al. [14] by means of high-Rydberg C-atom detection and has not been observed by Köllmann [12].
In charge transfer experiments involving CO and He+, for which the recombination energy is 24.587 eV [19], Derrick and Szabo [21] observed C+ ions, mainly as primary ions. Using He+ in a charge exchange reaction with CO the intensity of the metastable peak corresponding to CO+(metast.) → C+ + O in the first field free region of the double focussing mass spectrometer AEI-MS9 remains unchanged [11]. Furthermore at low ion energies no evidence is found for additional structure due to a predissociation to this limit. Consequently the dissociative ionization observed at 24.23 eV is the result of a direct transition to the dissociative part of a stable CO+ electronic state.
Concerning the symmetry of the molecular ion state(s) involved over the whole ion energy range (0—3 eV) no answer could be found in the angular distribution experiments. The photoelectron spectrum of CO [4] provides no evidence for the existence of direct dissociative ionization in the range of 24—30 eV electron binding energy. In this energy range only the E2Σ+ and the F2Σ+ states of CO+ have been observed.
4.2.3. Dissociation limit at 26.6 eV
No direct dissociative ionization is observed at this limit. The energy of 26.6 eV obtained by linear extrapolation corresponds to process 4 in table 2
CO+ → C+(2P0) + O(1S)
and C+ ions are formed with a minimum kinetic energy of (1.1 ± 0.1) eV. The threshold for this process is (28.36 ± 0.08) eV as averaged over the 0—1.2 eV ion energy range (arrow 2 in fig. 6). Above this energy the straight line extends up to 5 eV kinetic energy. These results are in very good agreement with those obtained by Smyth et al. [14] by means of dissociative excitation of CO by electron impact.
The combination of 2P0 and 1S terms gives rise to one 2Σ+ and one 2Π state only. The relatively intense process observed at 28.36 eV could be ascribed to a 2Σ+ ← X1Σ+ transition and could at least partially account for the results obtained by Köllmann [12] at 40 eV electron energy.
The 2Σ+ state involved in this process should be characterized by a large equilibrium internuclear distance. This is the case when the 2Σ+ state correlated with 2P0 + 1S and the C2Σ+ correlated with 2P0 + lD, give rise to an avoided crossing. For the latter, the particularly large xeωe value has to be ascribed to an anomalous
potential curve [3]. This situation is schematically drawn in fig. 10.
The position of the first maximum observed in the first derivative of the C+ ionization efficiency curve at low ion energies, i.e. in the range of 0.0—0.3 eV, has been investigated as a function of the retarding potential. The result is indicated by arrow 1 in fig. 6. This process at 27.4 eV corresponds to dissociative autoionization as observed previously in N+ from N2 [17]. The most probable mechanism is
where the CO state involved could be the 2Π state correlated with the dissociation limit at 26.6 eV. 4.2.4. Dissociations in the energy range of 31-33 eV
The critical energy measurements plotted in this ion energy range correspond to the maximum of the second peak observed in the first derivative of the C+ ionization efficiency curve (arrows 3—6 in fig. 6). This peak has to be ascribed to autoionization and no direct dissociative ionization is observed. Furthermore the measured critical energies do not fit a straight line extrapolated to a CO+ dissociation limit. The transition between arrow 3, corresponding to an energy of (31.0 ± 0.2) eV, and arrow 4 at an energy of (31.5 ± 0.1) eV, is stepwise. Although less clearly, the same stepwise feature is observed between 32.4 eV (arrow 5) and 33.0 eV (arrow 6).
Fig. 10. Morse potential energy curves of CO+ leading to the dissociation C+ + O (full lines). Potential energy curves drawn by dashed lines are inferred from the present work. Shaded area noted by CO1*-CO6*,
corresponding to arrows 1-6 in fig. 6 are the energy ranges where dissociative autoionization is observed.
One of the most probable interpretations of this result is the dissociative autoionization, i.e.
If the autoionizing CO* state is characterized by an equilibrium internuclear distance re nearly equal to that of
the CO ground state, mainly the υ = 0 level of the former state is populated. This vibronic CO* state can autoionize via a transition to the dissociation continuum of a molecular ion state lying slightly outside the Franck—Condon region. This mechanism could be invoked to explain the critical energies at 31.0 and 32.4 eV. It seems also reasonable to suggest that autoionization and subsequent dissociation lead to the nearest lower lying dissociation limit, i.e. 29.668 eV. However, at 33 eV it seems (see fig. 6) that the dissociation should take place at the 27.8 eV limit corresponding to CO+ → C+(4P) + O(3P).
In the energy range of 31.5 to 32.4 eV the measured critical energies might fit a straight line having the expected 16/28 slope. This process may be ascribed to the population of an increasing number of vibrational levels of an autoionizing state giving rise to a broad ion energy distribution.
4.2.5. Dissociation limits in the energy range of 31.5-31.9 eV
The first threshold concerning the dissociative ionization at these limits is meausred for 0.9 eV kinetic energy. Below this energy the new dissociative ionization channel is obscured by the lower lying and intense dissociative autoionization phenomena. Furthermore, as seen from fig. 6, a large error is made in the critical energy measurement due to the slow increase of the first derivative and the associated high noise level.
Because of the scattering of the data and the exis-tense of four closely lying dissociation limits in this energy range, it is not possible to ascribe unambiguously this dissociation process to one of the mechanisms 7 to 10 mentioned in table 2.
4.3. Dissociation channel CO →e− C- + 0+ at (23.9 ± 0.2) eV
In the conditions of high signal-to-noise ratio for the first derivative of the ionization efficiency curve of O+ from CO, a very weak signal could be detected below the first well defined threshold (see fig. 7). Its intensity, being at least one order of magnitude lower than the signal corresponding to the ion pair formation CO → C+ + O-, enables a threshold energy to be measured only in a few favourable cases.
This signal rising up at (23.9 ± 0.2) eV can only be ascribed to process 1 mentioned in table 3 and for which the threshold is calculated at 23.459 eV. Hierl and Franklin [8] measured an appearance energy at (23.2 ± 0.05) eV. When the threshold energy is measured as a function of the retarding potential, the experimental points fit fairly well a straight line with the expected slope of 12/28 drawn by a dashed line in fig. 8. This observation also supports the interpretation that the weak signal observed around 23.9 eV for O+ is necessarily produced by dissociative ionization of CO only.
4.4. Dissociation channel CO+ →e− C + 0+ 4.4.1. Dissociation limit at (24.75 ± 0.09) eV
The first steeply rising process detected in the first derivative of the ionization efficiency curve, recorded at VR = 0.0 V, has its threshold at (24.75 ± 0.09) eV. This energy is in good agreement with that
calculated for process 2 in table 3 and with previous measurements [8,12]. This process has not been observed by Smyth et al. [14] by means of translational spectroscopy of long lived high-Rydberg oxygen atoms. A straight line of slope 12/28 starting at 24.75 eV extends over the whole ion energy range investigated.
In the kinetic energy distribution of O+, the maximum of the nearly thermal peak is measured at (17 ± 4) meV for 25 eV electrons, corresponding to (39 ± 9) meV in terms of total kinetic energy (see fig. 4). At higher energies a broad and structurless peak is observed the shape and position of which drastically change between 35—30 eV.
Wankenne and Momigny [11] detected a very weak "metastable transition" at m/e = 9.14 corresponding to the spontaneous decomposition CO+ → O+ + C in the first field free region of a double focussing mass spectrometer. In this transition a small amount of kinetic energy is involved and a threshold energy has been measured at (25 ± 1) eV. When He is used in a charge exchange reaction with CO, a significant increase in intensity is observed for both the metastable transition and the normal O+ peak. These results are interpreted [11] by the formation of O+ through the predissociation of a CO+ vibronic state.
The peak observed at 39 meV and the observation of a predissociation have to be interpreted by the process
combining 3P and 4S0 terms, doublet, quartet and sextet Σ+ and Π states are obtained. By estimation of its dissociation energy, the D2Π state could converge to the 24.727 eV limit at large internuclear distances. Dissociation of CO+ by a direct transition to the continuum of this state is unlikely. In the energy range of interest the E2Σ+ state of CO+ is also known by photoelectron spectroscopy [4]. Since allowed by Dunn's selection rules [13], this electronic state could be involved in a E 2Σ+ ← X1Σ+ transition and predissociated via a repulsive CO+ electronic state converging to 24.727 eV. The first observed vibrational level of the E2Σ+ state has
been measured at 24.770 eV [4]. If this level is predissociated, the total excess energy involved in process 2 in table 3 is 43 meV which has to be compared with the total kinetic energy of (39 ± 9) meV measured for the first peak observed in the kinetic energy distribution of O+.
has been described in terms of the predissociation of the C2 Σu+ state via accidental predissociation involving a 4
Πu bound state of N2 +
[22] or a homogeneous predissociation due to B2Σ+—C2Σu +
interaction [23]. For the dissociative ionization channel of CO+ at 24.72 eV
both mechanisms could account for the experimental data. At least a predissociation 4Π—E2Σ+ could be invoked (see fig. 11).
About the production of more energetic 0+ ions, i.e. in the range of 1.0—3.0 eV, by dissociative ionization at 24.727 eV, valuable information is obtained from the kinetic energy distribution recorded with 30 eV electrons as well as from the angular distribution for 3 eV ions at 32 eV electron energy [12].
The kinetic energy distribution shows one energetic process peaking at 0.8 eV and extending up to about 2.7 eV. The same peak shifts to 1.4 eV at 35 eV electron energy. The angular distribution of 0+ [12] clearly shows minima at θ = 60° and 120° and as a result Σ+,Π←Σ+ transitions have to be considered. Comparing CO+ with the isoelectronic N2+ molecule, the final state which gives rise to O+ carrying a large amount of kinetic
energy could be the 4Σ+ electronic state of CO+ (see fig. 11).
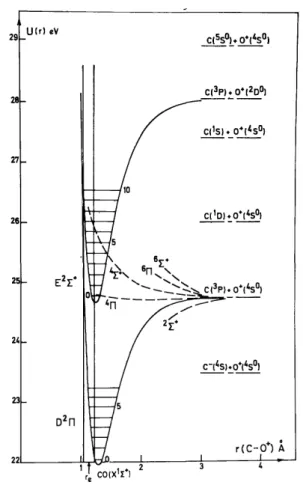
Fig. 11. Morse potential curves of CO+ dissociating into O++ C in the energy range close to the first threshold of the O+ ion.
4.4.2. Dissociation limit at (26.07 ± 0.19) eV
The second well defined step is characterized by a threshold energy of (26.07 ± 0.19) eV, starting point of a straight line of slope 12/28 extending from 0 to 5 eV kinetic energy. This measurement is in good agreement with the appearance energy measured for process 3 in table 3
calculated at 25.991 eV. This process has previously been observed by Hierl and Franklin [8] and Köllmann [12]. Again Smyth et al. [14] do not observe this process through high-Rydberg atom translational spectroscopy.
Although in this energy range the scarcity of the data does not allow us to discuss the process in detail, some information can be obtained about the symmetry of the states involved.
4
S0 and 1D terms could only give rise to quartet Σ-, Π and ∆ states of CO+. Taking into account (i) Dunn's selection rules according to which Σ- ← Σ+ transitions are forbidden and (ii) the angular distribution of O+ which shows a dominant contribution of Σ+, Π←Σ+ transitions, only a Π←Σ+ transition is allowed. However, ∆←Σ+ transitions cannot be ruled out and both Π, ∆←Σ+ transitions have to be considered in the whole ion energy range.
4.4.3. Dissociation limit at (28.21 ± 0.13) eV
The unambiguous interpretation of the well resolved threshold energy at (28.21 ± 0.13) eV is process 5 in table 3 for which an energy of 28.052 eV is calculated. This process has been observed earlier by Hierl and Franklin [8] and Köllmann [12]. The first dissociative excitation process giving rise to oxygen high-Rydberg atoms [14] would have an energy of 27.4 eV by extrapolation to 0 eV released kinetic energy. In the R.P.D. ionization efficiency curve of O+[8] a "break" is located at 27.4 eV. This could not be confirmed in the present experiment. From an examination of fig. 7 the absence of any dissociative ionization process at 27.4 eV can unambiguously be inferred.
The number of possible molecular ion states involved in this (these) dissociative ionization process(es) leading to the limit at 28.2 eV together with the total lack of data about CO+ electronic states in this energy range, do not allow a more detailed discussion of the present data.
4.4.4. Dissociation limits ranging 29.3-29.7 eV and at (34.06 ±0.12) eV
The electron energy spread present in this experiment is not sufficient to resolve two processes 0.4 eV apart. At 0 eV kinetic energy a threshold is measured at (29.45 ± 0.24) eV. For higher values of the kinetic energy the diagram ion energy-versus-appearance energy follows roughly a straight line of slope 12/28. It is not possible, however, to decide whether one or both processes 7 and 8 in table 3 are involved or not. Hierl and Franklin [8] and Köllmann [12] do not observed any "break" in the ionization efficiency curve of O+ in the energy range of 29-30 eV. Smyth et al. [14] do not mention dissociative excitation processes in this energy range, the second process being mentioned by these authors is at about 32.5 eV at 0 eV released kinetic energy.
As shown in fig. 7, below 40 eV electron energy, the first derivative of the O+ ionization efficiency curve exhibits a slow rise at (34.06 ± 0.12) eV. The threshold energy of this process, being fairly easy to measure for zero eV retarding potential, could not be measured for higher retarding potentials due to a rapid lowering of the slope. As shown in fig. 8, at 0.2 eV retarding potential the scattering of 5 measurements is 0.5 eV.
Only process 14 in table 3, for which a threshold of 33.928 eV is calculated, could reasonably be invoked to interpret the process whose threshold is measured at 34.06 eV.
A more detailed interpretation of the high energetic process giving rise to O+ is not possible without further information both from theory as well as from experiment.
5. Conclusions
In the present work on dissociative ionization in CO by electron impact the two exit channels, leading to either C+ or O+ for dissociation of the CO+ molecular ion, have been studied in detail.
After the dissociative ionization study of N2 [16] and O2 [17], the following concluding remarks have to
be extended to the dissociative ionization of CO. Even if the main limitation in the discussion of the experimental results is due to the total absence of theoretical work devoted to the CO molecule, this investigation clearly shows the major importance of two phenomena, i.e. predissociation and autoionization. While the former is necessarily present to produce both C+ + O and C + O+, all species being in their ground level, the latter seems to dominate at least for higher energies in the dissociation channel CO+ → C+ + O.
kinetic energy analysis and the use of the first derivative of the electroionization efficiency curves to evidence the above-mentioned phenomena.
Finally it is noteworthy to point out that, although the data from dissociative excitation producing C high-Rydberg atoms agree with those from dissociative ionization forming C ions, both methods give different results for the second dissociation channel. No explanation has been found for this discrepancy.
Acknowledgement
The author gratefully thanks Professor J. Momigny and Dr. P. Natalis for stimulating discussions and useful suggestions. The Fonds de la Recherche Fondamentale Collective is acknowledged for financial support. References
[1] P.H. Krupenie, The Band Spectrum of Carbon Monoxide, NSRDS-NBS-5 (1966). [2] J. Marchand, J. D'Incan and J. Janin, Spectrochim. Acta 25A (1969) 605.
[3] K. Codling and A.W. Potts, J. Phys. B 7 (1974) 163.
[4] L. Åsbrink, C. Fridh, E. Lindholm and K. Codling, Phys-ica Scripta 10 (1974) 183. [5] R. Carbonneau and P. Marmet, Can. J. Phys. 51 (1973) 2202.
[6] H. Lefebvre-Brion and CM. Moser, J. Mol. Spectry. 13 (1964) 418. [7] F. Guerin, Theoret. Chim. Acta 17 (1970) 97.
[8] P.M. Hierl and J.L. Franklin, J. Chem. Phys. 47 (1967) 3154. [9] H.D. Hagstrum, Rev. Mod. Phys. 23 (1951) 185.
[10] H.E. Stanton and J.E. Monahan, J. Chem. Phys. 41 (1974) 3694. [11] H. Wankenne and J. Momigny, Chem. Phys. Letters 4 (1969) 132.
[12] K. Köllmann, Intern. J. Mass Spectrom. Ion Phys. 17 (1975) 261 ; J. Chem. Phys. 63 (1975) 1314; private communication.
[13] G.H. Dunn, Phys. Rev. Letters 8 (1962) 62.
[14] K.C. Smyth, J.A. Schiavone and R.S. Freund, J. Chem. Phys. 60 (1974) 1358. [15] R. Locht and J.M. Durrer, Chem. Phys. Letters 34 (1975) 508.
[16] R. Locht and J. Schopman, Intern. J. Mass Spectrom. Ion Phys. 15 (1974) 361.
[17] R. Locht, J. Schopman, H. Wankenne and J. Momigny, Chem. Phys. 7 (1975) 393, and references therein. [18] R. Locht and J. Momigny, Intern. J. Mass Spectrom. Ion Phys. 7(1971) 121.
[19] C.E. Moore, Ionization Potentials and Ionization Limits Derived from the Analysis of Optical Spectra, NSRDS-NBS 34 (1970).
[20] B. de B. Darwent, Bond Dissociation Energies in Simple Molecules, NSRDS-NBS 31 (1970). [21] P.J. Derrick and I. Szabo, Intern. J. Mass Spectrom. Ion Phys. 7(1971) 71.
[23] J. Tellinghuisen and D.L. Albritton, Chem. Phys. Letters 31 (1975) 91. [24] H. Hotop and W.C. Lineberger, J. Phys. Chem. Ref. Data 4 (1975) 539. [25] C.E. Moore, Atomic Energy Levels, vol. 1, NBS Circ. 467 (1949).