SHORT NOTES
An ecophysiological discussion of trace element bioaccumulation
in cultured Mytilus galloprovincialis
Jonathan Richir
1,2,*& Sylvie Gobert
21 STARESO SAS, Pointe Revellata, BP 33, F-20260 Calvi, France.
2 Laboratory of Oceanology, MARE Centre, University of LiEgE, B6c, 4000 LiEgE, Sart Tilman, Belgium. * Corresponding author:jonathan.richir@alumni.ulg.ac.be
KEY WORDS: mussel, trace element, bioaccumu-lation, ecophysiology.
Monitoring programs conducted by the French Research institute for the Exploitation of the Sea iFREMER have been using the mussel watch approach introduced by goldberg [1] since 1974, initially on wild and cultured bivalve mollusks [2], leading to long time data series for several trace elements (TEs: Ag, Cd, Cr, Cu, Hg, Ni, Pb, V and Zn; http://envlit.ifremer.fr/). Since 1996, transplanted caged Mytilus galloprovincialis Lamarck, 1819 have been used to characterize
the chemical contamination of Mediterranean coastal waters even in locations where no native wild mussels were available. This project succeeded in assessing the natural background and the extent of the chemical contamination first at the scale of the French Mediterranean littoral [3,4], and more recently at the scale of the whole western Mediterranean Sea [5,6]. However, these programs have focussed on a limited number of metals. Nowadays, the development of very sensitive equipment allows the measurement of some TEs found at very low environmental levels. in parallel, recent technological developments have led to an increase in the extraction and industrial refinement of TEs previously of little concern. Therefore, the environmental monitoring of less studied, potentially toxic TEs of emerging environmental concern is relevant [7].
From data previously published by richir &
Gobert [7], the first objective of this short note
was to discuss the bioaccumulation profile of 19 TEs that have been either broadly (Cr, Ni, Cu, Zn, Cd, Pb, As, Ag and V) or little monitored (Be, Al, Fe, Mn, Co, Se, Mo, Sn, Sb and Bi) in the Mediterranean mussel M. galloprovincialis. The second objective was to test the relevance of the Trace Element Pollution index of richir
& Gobert [8] when modelling the effect of
the shell length and flesh dry weight on the overall accumulation of these 19 TEs in rope-grown mussels. Because of the importance of gametogenesis in the physiological cycle of M. galloprovincialis, the third objective was to briefly discuss the deterministic effect of the sex and the reproductive status on the overall TE bioaccumulation and the TE-specific compartmentalization in that species.
Briefly, to realise these three objectives,
M. galloprovincialis were purchased from the
shellfish farm of the Diane pond on the eastern coast of Corsica, France (42°07’45.00’’N,
9◦31’01.00’’E), in March 2010 (after mussel
spawning) and February 2011 (before mussel spawning). Seventy four mussels sampled in February 2011 were used to investigate the bioaccumulation of the 19 TEs listed above. These 74 mussels were further segregated according to their sex to study differences between male and female TE bioaccumulation prior to spawning. Forty supplementary large-size (70-80 mm shell length) mussels purchased in March 2010
(n = 20) and February 2011 (n = 20) were used for the analysis of body compartmentalization after and before spawning, respectively, at one-year interval. Body compartments were sorted as follows: gills, hepatopancreas, mantle and remaining soft tissues. TE levels were determined by iCP-MS (iCP-MS ELAN DRC ii, PerkinElmer®) after mineralization in a
closed microwave digestion labstation (Ethos D, Milstone inc.), using HNO3 and H2O2 as reagents (Suprapur grade, Merck). Analytical accuracy was checked by analysing Certified Reference Materials: BCR 278, NiST 1566b and NiST 2976. The global mean recovery, all elements together, was 95 ± 9 %. For each TE, the analytical detection limit (LD) was calculated according to currie [9] or Grinzaid et al. [10].
The Trace Element Pollution index (TEPi) of richir & Gobert [8], which synthetizes the
accumulated levels (concentrations or contents) of all the studied TEs into a single index value, was calculated for each of the 74 mussels sampled in February 2011 as follows: TEPi = (Cf1 * Cf2 … Cfn)1/n, where Cf
n is the mean
normalized concentration or content of the TE n of a given mussel [11,12]. The log-transformed power function: log10Y = log10a + blog10X, and the linear regression: Y = bX + a, were tested to model the relationships between the 74 mussel flesh dry weight (X; from 0.17 to 3.36 g) or shell length (X; from 43.40 to 86.41 mm) and TEPi values (Y) [13,14,15]. b is the slope of linear functions; log10a and a are the Y-intercepts.
To select the most adequate model that best described these relationships, the second order Akaike information criterion (AiCc) was used [16]. Statistical analyses were performed with STATiSTiCA 10 (Stat-Soft inc.) and graphPad Prism 5 (graphPad Software inc.) software.
Results showed that rope-grown M.
gallopro-vincialis from the Diane pond efficiently
bioaccumulated the 10 little monitored TEs (Be, Al, Fe, Mn, Co, Se, Mo, Sn, Sb, Bi) in addition to the 9 TEs classically monitored (Cr, Ni, Cu, Zn, Cd, Pb, As, Ag and V) in that species (Table 1). Comparative graphs ordering TEs either broadly
or little monitored in M. galloprovincialis by decreasing order of concentrations are given in Fig. 1. Concentrations ranged from 10-3 µg g
DW -1 for Bi to 102 µg g
DW-1 for Al and Fe (Table 1;
Fig. 1). Essential TEs classically monitored such as Zn, Cu, Ni and Cr appeared to be preferentially accumulated unlike non-essential toxic TEs such as Cd, Pb and Ag (Fig. 1a) [17]. With regard to As, this TE was reported to be naturally more bioaccumulated in M.
galloprovincialis [3], mostly as organicated
non-toxic species [18,19]. The mean V concentration was relatively high compared to data reported by the iFREMER (http://envlit.ifremer.fr/) for the Diane pond and could thus reflect a temporary moderate contamination of the pond by that specific element [7]. Bioaccumulation of TEs little monitored in M. galloprovincialis showed a similar graphic profile (Fig. 1b) to the previous one. Environmentally abundant and/or essential TEs such Fe, Al, Mo, Mn, Se and Co were bioaccumulated in a more important way, while concentrations of non-essential and potentially toxic Sn, Be, Sb and Bi remained low to very low [17]. The Diane pond has previously been considered little contaminated by TEs [7]; Fig. 1 thus presents the natural aptitude of rope-grown
M. galloprovincialis to bioaccumulate TEs
in clean environmental conditions. Although essential TEs appeared to be preferentially accumulated, unlike non-essential toxic ones, there is currently little physiological evidence about this preferential accumulation of essential versus other elements [20,21].
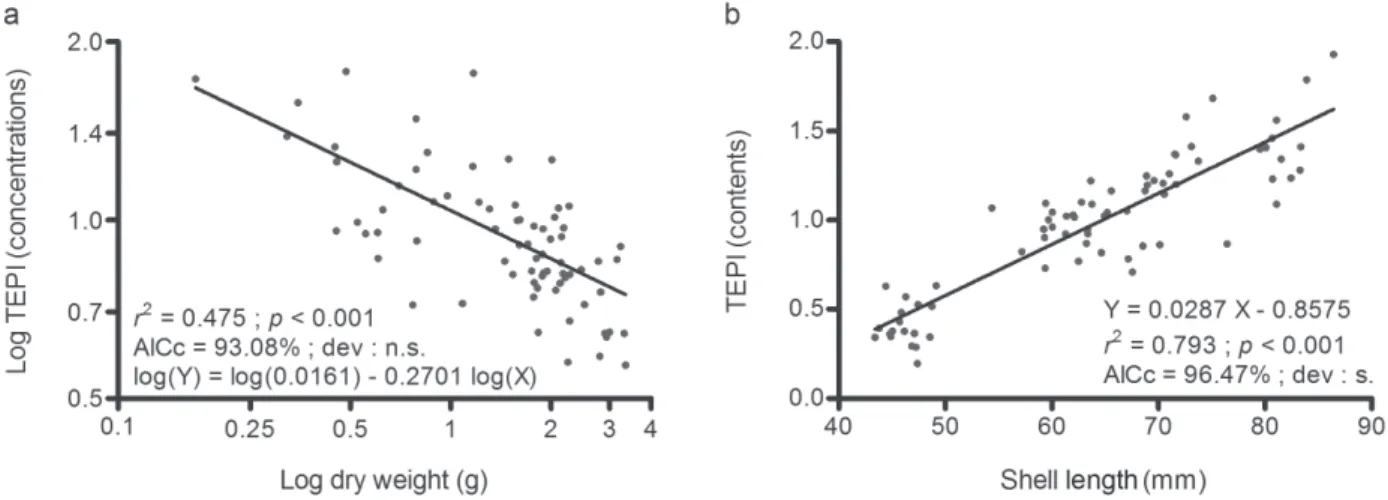
The overall concentration of the 19 studied TEs in mussel flesh, synthetized as TEPI values, decreased when the mussel flesh dry weight increased (Fig. 2a); their overall flesh content increased when the mussel shell length increased (Fig. 2b). According to AiCc values, the relationships between the overall TE concentration of the 74 mussels, without size restriction, and their body dry weight, or between the overall TE content and the mussel shell length, were better modelled by the power function (Fig. 2a; Table 2a; AiCc value of 93.08%) or the linear regression (Fig. 2b; Table 2b; AiCc
value of 96.47%), respectively. in contrast, the relationship between the overall TE content and the mussel shell length was properly modelled by both the linear regression and the power function when only individuals larger than 55 mm were considered (Table 2b; AiCc values of 47.90% and 52.10%). Small-size mussels (< 55 mm) thus had an antagonistic effect on the modelling of the overall TE bioaccumulation in rope-grown M.
galloprovincialis: they led us to elect the linear
Fig. 1 – Concentration profiles (mean ± SD, in µg gDW-1; logarithmic scale) of trace elements (TEs) either (a) broadly or (b) little monitored in Mytilus galloprovincialis (n = 74).
Fig. 2 – (a) Log transformed power function modelling the relationship between Mytilus galloprovincialis (n = 74) soft tissue dry weight and Trace Element Pollution index (TEPi) values (no unit), calculated from mean normalized concentrations of the 19 studied trace elements (TEs), and (b) linear regression modelling the relationship between mussel shell length and TEPi values (no unit), calculated from mean normalized contents of the 19 studied TEs. Linear equations and their corresponding fitting parameters (r2; p-value; deviation (dev.) from the model: s = significant, n.s. = non-significant; AICc) are reported on graphs.
regression to model the relationship between the mussel size and their overall TE content (AiCc value rising from 47.90% to 96.47%), but sensibly diminished the significance of the power function modelling the relationship between the mussel flesh dry weight and their overall TE concentration (AiCc value decreasing from 98.83% to 93.08%). These results corroborate the observations of richir & Gobert [7] made
TABLE 1 T race element (TE) concentr ations (mean ± SD, in µg g DW -1) in rope-grown Mytilus gallopr ovincialis purchased before they spawned, and T race Element Pollution index (TEP i) values (no unit) calculated from mean normalized concentrations of the 19 studied TEs. TE concentrations and TEP i values are given for all mussels together , independ ently of their size or sex, for mussels sorted by size-class (cl. 1 to cl. 4) and for mussels sorted by sex. Numbers between brackets are numbers of mussels. Letters represent significant dif ferences (p < 0.05) between size-classes; * represent significant dif ferences (p < 0.05) between sexes.
Concentration data used to calculate
TEP
i values are from
r ichir & G ober t [7]. All mussels (74)
Mussels sorted by size-class
Mussels sorted by sex
cl. 1: 43-54 mm (19) cl. 2: 55-64 mm (21) cl. 3: 65-74 mm (20) cl. 4: 75-87 mm (14) Females (29) Males (45) Al 200 ± 150 a 323 ± 223 ab 162 ± 63 b 150 ± 95 ab 160 ± 88 204 ± 143 197 ± 156 V 5.35 ± 2.02 ab 5.80 ± 2.50 a 5.67 ± 1.84 ab 5.43 ± 1.67 b 4.1 1 ± 1.68 * 6.55 ± 2.40 * 4.57 ± 1.24 Fe 177 ± 97 a 255 ± 146 ab 156 ± 43 b 148 ± 63 b 146 ± 55 186 ± 89 172 ± 102 Cr 0.554 ± 0.320 0.803 ± 0.489 0.477 ± 0.146 0.462 ± 0.197 0.465 ± 0.181 0.581 ± 0.288 0.537 ± 0.341 Mn 9.86 ± 3.87 a 12.89 ± 4.03 b 9.84 ± 2.84 b 9.07 ± 3.62 b 6.88 ± 2.51 * 12.18 ± 3.48 * 8.36 ± 3.37 Co 0.634 ± 0.205 0.688 ± 0.255 0.605 ± 0.135 0.626 ± 0.235 0.616 ± 0.173 * 0.707 ± 0.215 * 0.587 ± 0.185 Ni 1.41 ± 0.54 a 1.81 ± 0.66 b 1.30 ± 0.37 b 1.34 ± 0.50 b 1.16 ± 0.34 * 1.68 ± 0.59 * 1.24 ± 0.43 Cu 4.82 ± 1.50 a 5.55 ± 1.40 a 4.86 ± 1.47 a 4.98 ± 1.55 b 3.56 ± 0.69 * 6.50 ± 0.67 * 3.74 ± 0.61 Zn 72.6 ± 33.6 79.7 ± 37.8 66.2 ± 22.2 75.7 ± 43.8 67.9 ± 25.2 * 86.3 ± 36.4 * 63.7 ± 28.8 Se 2.70 ± 0.78 a 3.24 ± 0.66 ab 2.64 ± 0.76 b 2.64 ± 0.81 b 2.17 ± 0.48 * 3.48 ± 0.34 * 2.21 ± 0.54 Ag 0.0123 ± 0.0054 a 0.0157 ± 0.0068 a 0.0124 ± 0.0040 ab 0.01 16 ± 0.0048 b 0.0083 ± 0.0027 * 0.0151 ± 0.0064 * 0.0104 ± 0.0038 Cd 0.374 ± 0.131 0.390 ± 0.200 0.389 ± 0.100 0.357 ± 0.089 0.352 ± 0.1 11 * 0.397 ± 0.106 * 0.358 ± 0.144 Sn 0.0318 ± 0.0167 0.0413 ± 0.0222 0.0282 ± 0.01 17 0.0312 ± 0.0170 0.0248 ± 0.0073 0.0323 ± 0.0160 0.0314 ± 0.0174 Sb 0.0126 ± 0.0042 0.0152 ± 0.0052 0.01 19 ± 0.0028 0.01 19 ± 0.0040 0.01 13 ± 0.0038 * 0.0140 ± 0.0048 * 0.01 18 ± 0.0036 As 31.2 ± 6.1 a 32.7 ± 6.8 ab 31.7 ± 5.5 ab 32.3 ± 5.9 b 26.9 ± 4.5 * 36.3 ± 4.3 * 27.8 ± 4.6 Mo 17.1 ± 5.8 ab 16.3 ± 6.0 a 19.5 ± 4.9 a 18.8 ± 5.6 b 12.3 ± 4.2 * 20.7 ± 5.8 * 14.8 ± 4.5 Be 0.0135 ± 0.0056 0.0169 ± 0.0085 0.0122 ± 0.0030 0.0121 ± 0.0042 0.0128 ± 0.0040 0.0127 ± 0.0056 0.0140 ± 0.0057 Pb 0.336 ± 0.192 0.400 ± 0.253 0.268 ± 0.138 0.324 ± 0.185 0.369 ± 0.154 0.378 ± 0.21 1 0.309 ± 0.175 Bi 0.0087 ± 0.0032 0.0100 ± 0.0039 0.0089 ± 0.0032 0.0082 ± 0.0026 0.0073 ± 0.0021 * 0.0097 ± 0.0034 * 0.0080 ± 0.0028 TEP i 0.959 ± 0.269 a 1.137 ± 0.307 ab 0.932 ± 0.198 b 0.920 ± 0.270 b 0.813 ± 0.190 * 1.094 ± 0.274 * 0.872 ± 0.229
the relevance of the TEPi to model, in a reduced number of synthesis equations, the relationships between the overall levels of bioaccumulated contaminants and the physiology of organisms.
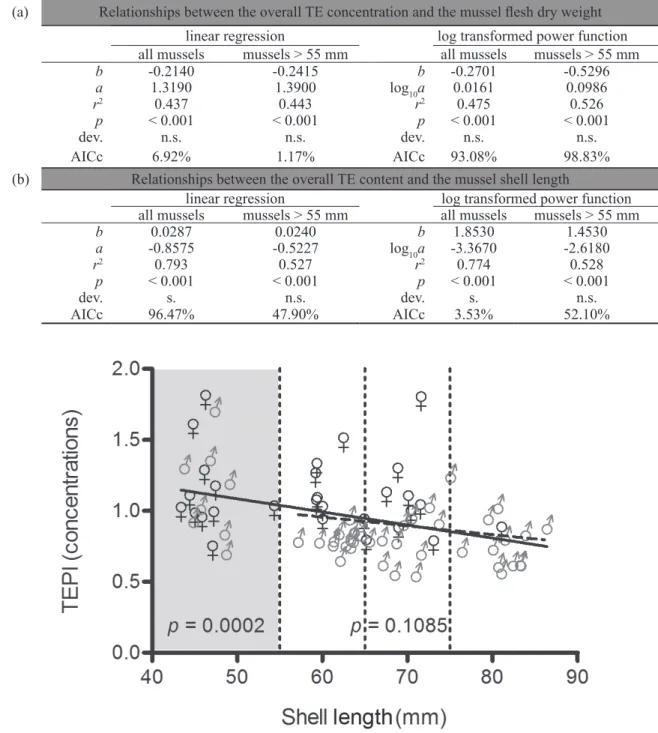
The same was concluded when modelling the relationship between the shell length and the overall TE concentration of the 19 studied TEs in mussel flesh. Thus, the overall TE concentration in mussel flesh was linearly correlated (p = 0.0002) with the shell length when considering all the 74 mussels, without size restriction (Fig. 3). This significant relationship was to be attributed mainly to small-size mussels (43– 54 mm) whose TE-specific and overall mean concentrations were always higher than for the mid-size individuals (55-64 mm and 65-74 mm), except for Mo, As and Cd (Table 1). Small-size mussels further showed a high inter-individual variability of their TE concentrations. These observations reflected unfavourable physical conditions of growth of small-size mussels found inside the rope [7]. When the linear regression model was run again for mussels larger than 55 mm only, the overall TE concentration in mussel flesh was no longer correlated (p = 0.1085) with the shell length (Fig. 3). For mid- to large-size
M. galloprovincialis grown on ropes, the size did
not significantly influence flesh concentrations of most TEs, although they were slightly lower on average in individuals larger than 75 mm (Table 1). As their culture begins synchronically, all mussels on a rope have the same age, but may differ in size according to individual growing conditions [14]. Thus, when sorting mussels for monitoring purposes, care should be taken to use neither small- (restrained growth and concen-tration effect) nor large-size (rapid growth and dilution effect) mussels, these individuals being not representative of the rope population [7].
Female and male mussels accumulated TEs unevenly during gametogenesis. As a result, mean TE concentrations in mussel dry flesh sampled prior to spawning differed significantly (p < 0.05) between sexes and were higher in females (from 3% for Al up to 74% for Cu, except for Be), for an overall difference (i.e. TEPi values)
of 25% (Table 1). This different accumulation between individuals of opposite sexes resulted in the linear regression with slope still close to the significance threshold level of 0.05 when modelling the relationship between the shell length of mussels larger than 55 mm and their overall TE concentration (p = 0.1085; Fig. 3). The sex-related bioaccumulation of TEs during gametogenesis could depend on a functional role played by metallothioneins (MTs), as already suggested by Latouche & mix [22] in the
early 80s and supported by several subsequent experimental and field studies [23, 24, 25].
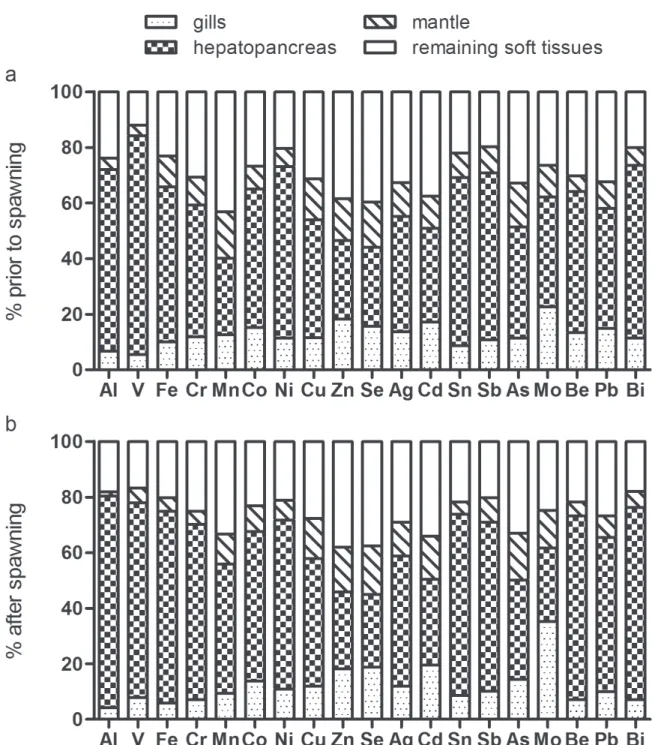
in M. galloprovincialis, up to 45 % of soft tissue weight can be lost during spawning [8]. Despite the importance of gametogenesis in the physiological cycle of M. galloprovincialis, the proportional distribution of TEs between main body compartments analysed respectively a few days before or after spawning, at one-year interval, remained the same: the 19 studied TEs were more accumulated in the hepatopancreas compared to the mantle and the gills (except for Mo in mussel having spawned), and only Zn, Se, Cd (at both reproductive states) and Mn (in mussels close to spawning) showed higher contents in the remaining soft tissues of mussels (Fig. 4). This very conservative character of TE compartmentalization (physiological and temporal constancy) is an argument in favour of some internal regulation of TE redistribution processes between organs [20,21], in addition to passive diffusion processes according to concentration gradients and tissue affinities.
To conclude, little monitored TEs as well as broadly monitored ones were efficiently bioaccumulated in rope-grown M.
galloprovin-cialis, with a preferential accumulation for
essen-tial and abundant ones. The relevant use of the TEPi to model, in a reduced number of synthesis equations, the relationships between the overall levels of bioaccumulated contaminants and the physiology of organisms was described. The significant effect of the size of cultured mussels whose growth was above or below average on the accumulation of TEs in their flesh was pointed
Fig. 3 – Linear regressions modelling the relationship between Mytilus galloprovincialis shell length and Trace Element Pollution index (TEPi) values (no unit), calculated from mean normalized concentrations of the 19 studied trace elements (TEs), all mussels together (n = 74, shaded area included; full regression line) or restricted to mussels larger than 55 mm (n = 55, shaded area excluded; dashed regression line). Mussels were purchased before they spawned. ♀ and ♂ symbolize females and males, respectively. The dotted vertical lines separate mussels into 4 equivalent size-classes of about 10 mm. Model p-values (significant for all mussels together only) are given on the graph.
TABLE 2
Comparison of linear regressions and log transformed power functions modelling (a) relationships between Mytilus galloprovincialis soft tissue dry weight and Trace Element Pollution index (TEPi) values, calculated from mean normalized concentrations of the 19 studied trace elements (TEs), and (b) relationships between mussel shell length and TEPi values, calculated from mean normalized contents of the 19 studied TEs. Modelling was applied for all mussels together (n = 74) or for individuals large than 55 mm only (n = 55). b is the slope of linear functions; a and log10a are the Y-intercepts. Fitting parameters are also indicated (r2; p-value; deviation (dev.) from the model: s. = significant, n.s. = non-significant; AICc).
(a) Relationships between the overall TE concentration and the mussel flesh dry weight linear regression log transformed power function all mussels mussels > 55 mm all mussels mussels > 55 mm
b -0.2140 -0.2415 b -0.2701 -0.5296 a 1.3190 1.3900 log10a 0.0161 0.0986 r2 0.437 0.443 r2 0.475 0.526 p < 0.001 < 0.001 p < 0.001 < 0.001 dev. n.s. n.s. dev. n.s. n.s. AiCc 6.92% 1.17% AiCc 93.08% 98.83%
(b) Relationships between the overall TE content and the mussel shell length
linear regression log transformed power function all mussels mussels > 55 mm all mussels mussels > 55 mm
b 0.0287 0.0240 b 1.8530 1.4530 a -0.8575 -0.5227 log10a -3.3670 -2.6180 r2 0.793 0.527 r2 0.774 0.528 p < 0.001 < 0.001 p < 0.001 < 0.001 dev. s. n.s. dev. s. n.s. AiCc 96.47% 47.90% AiCc 3.53% 52.10%
out, as was the effect of the sex of mussels close to spawning. Finally, the conservative character of TE compartmentalization regardless of the physiological status of sampled mussels, and their proportional redistribution between tissues, were suggested to rely on some internal regulatory processes that require further investigations.
AckNOwlEdGEMENTS
Funding was provided by the FRS-FNRS (FRFC 2.4.502.08) and by the French Community of Belgium (ARC Race 05/10-333). This study is part of the STARECAPMED project funded by the Territorial Collectivity of Corsica and by
Fig. 4 – Proportional distribution of trace elements between main body compartments (gills, hepatopancreas, mantle and remaining soft tissues; in % of total contents) of Mytilus galloprovincialis. Mussels were purchased (a) a few days before they spawned (n = 20) and (b) a few days after they spawned (n = 20), at one-year interval.
The French Water Agency (PACA-Corsica). The authors are grateful to Mr. B. Pantalacci, manager of the shellfish farm SARL Etang de Diane, and his employees who furnished mussel ropes, to M. Fassin and A. Deraikem who processed the samples and to R. Biondo who performed iCP-MS analyses. This publication has the MARE publication number MARE307.
REfERENcES
[1] GoLdberG ED (1975). The mussel watch. A first step in global marine monitoring. Mar. Pollut. Bull., 6(7): 111-113.
[2] GuéGuen m, amiard J-c, arnich n, badot P-m, cLaisse d et al. (2011). Shellfish and Residual Chemical Contaminants: Hazards, Monitoring, and Health Risk Assessment Along French Coasts, in: Whitacre, D. M. (Ed.), Reviews of Environmental Contamination and Toxicology Volume 213. Springer New York, 55-111.
[3] andraL b, stanisiere JY, sauzade d,
damier e, thebauLt h et al. (2004).
Monitoring chemical contamination levels in the Mediterranean based on the use of mussel caging. Mar. Pollut. Bull., 49(9-10): 704-712. [4] andraL b & tomasino C (2010). Réseaux
intégrateurs Biologiques. RiNBiO 2009. Evaluation de la qualité des eaux basée sur l’utilisation de stations artificielles de moules en Méditerranée: résultats de la campagne 2009. ifremer.
[5] andraL b, GaLGani F, tomasino c,
bouchoucha m, bLottiere C et al. (2011).
Chemical contamination baseline in the Western basin of the Mediterranean sea based on transplanted mussels. Arch. Environ. Contam. Toxicol., 61(2): 261-271.
[6] benedicto J, andraL b, martínez-Gómez
c, Guitart c, deudero S et al. (2011). A large
scale survey of trace metal levels in coastal waters of the Western Mediterranean basin using caged mussels (Mytilus galloprovincialis). J. Environ. Monit., 13(5): 1495-1505.
[7] richir J & Gobert S (2014). The effect of size, weight, body compartment, sex and reproductive status on the bioaccumulation of 19 trace elements in rope-grown Mytilus
galloprovincialis. Ecol. indicators, 36: 33–47. [8] richir J & Gobert S (2014). A reassessment
of the use of Posidonia oceanica and Mytilus galloprovincialis to biomonitor the coastal pollution in trace elements: New tools and tips. Mar. Pollut. Bull., 89: 390-406.
[9] currie LA (1999). Nomenclature in evaluation of analytical methods including detection and quantification capabilities (IUPAC Recommendations 1995). Anal. Chim. Acta, 391(2): 105-126.
[10] Grinzaid eL, ziL’bershtein ki, nadezhina Ls & YuFa BY (1977). Terms and methods of estimating detection limits in various analytical methods. J. Anal. Chem. USSR, 32: 1678-1684. [11] LobeL Pb, beLkhode sP, baJdik c, Jackson se & LonGerich HP (1992). general charac-teristics of the frequency distributions of element concentrations and of interelemental correlations in aquatic organisms. Mar. Environ. Res., 33(2): 111-126.
[12] usero J, GonzáLez-reGaLado e & Gracia i (1996). Trace metals in the bivalve mollusc Chamelea gallina from the Atlantic coast of southern Spain. Mar. Pollut. Bull., 32(3): 305-310.
[13] cossa d, bourGet e, PouLiot d, Piuze J &
chanut JP (1980). geographical and seasonal
variations in the relationships between trace metal content and body weight in Mytilus edulis. Mar. Biol., 58: 7-14.
[14] saavedra Y, GonzaLez a, Fernandez P & bLanco J (2004). The effect of size on trace metal levels in raft cultivated mussels (Mytilus galloprovincialis). Sci. Total Environ., 318(1-3): 115-124.
[15] mubiana vk, vercauteren k & bLust R (2006). The influence of body size, condition index and tidal exposure on the variability in metal bioaccumulation in Mytilus edulis. Environ. Pollut., 144(1): 272-279.
[16] burnham kP & anderson DR (2002). Model selection and multimodel inference: A practical information-theoretic approach. Springer, New York.
[17] kaPustka La, cLements Wh, ziccardi L, Paquin Pr, sPrenGer M et al. (2004). issue paper on the ecological effects of metals. U.S. Environmental Protection Agency, Lexington, MA.
[18] Fattorini d, notti a, di mento r, cicero am, GabeLLini m et al. (2008). Seasonal, spatial and inter-annual variations of trace metals in mussels from the Adriatic sea: A regional gradient for arsenic and implications for monitoring the impact of off-shore activities. Chemosphere, 72(10): 1524-1533.
[19] Fattorini d, notti a & reGoLi F (2006). Characterization of arsenic content in marine organisms from temperate, tropical, and polar environments. Chem. Ecol., 22(5): 405-414. [20] amiard-triquet c, berthet b, metaYer
c & amiard JC (1986). Contribution to the ecotoxicological study of cadmium, copper and zinc in the mussel Mytilus edulis. ii. Experimental study. Mar. Biol., 92(1): 7-13. [21] martincic d, kWokaL z, Peharec z, marGus
d & branica M (1992). Distribution of Zn, Pb, Cd and Cu between seawater and transplanted mussels (Mytilus galloprovincialis). Sci. Total Environ., 119: 211-230.
[22] Latouche Yd & mix MC (1981). Seasonal variation in soft tissue weights and trace metal burdens in the bay mussel, Mytilus edulis. Bull. Environ. Contam. Toxicol., 27(1): 821-828.
[23] akberaLi hb, earnshaW mJ & marriott KRM (1985). The action of heavy metals on the gametes of the marine mussel, Mytilus edulis (L.) - ii. Uptake of copper and zinc and their effect on respiration in the sperm and unfertilized egg. Mar. Environ. Res., 16(1): 37-59.
[24 FitzPatrick JL, nadeLLa s, buckinG c,
baLshine s & Wood CM (2008). The relative
sensitivity of sperm, eggs and embryos to copper in the blue mussel (Mytilus trossulus). Comp. Biochem. Phys. C., 147(4): 441-449. [25] meistertzheim aL, LeJart m, Le Goïc n &
thébauLt MT (2009). Sex-, gametogenesis,
and tidal height-related differences in levels of HSP70 and metallothioneins in the Pacific oyster Crassostrea gigas. Comp. Biochem. Physiol. A., 152(2): 234-239.
Received: January 23rd, 2015 Accepted: August 31st, 2015 Branch editor: Marleen de Troch