THÈSE
En vue de l’obtention du
DOCTORAT DE L’UNIVERSITÉ DE TOULOUSE
Délivré par l'Université Toulouse 3 - Paul Sabatier
Présentée et soutenue par
Gustavo ROSTIROLLA
Le 25 novembre 2019
Ordonnancement dans un centre de calculs alimenté par des
sources d'énergie renouvelables sans connexion au réseau avec
une charge de travail mixte basée sur des phases
Ecole doctorale : EDMITT - Ecole Doctorale Mathématiques, Informatique et Télécommunications de Toulouse
Spécialité : Informatique et Télécommunications Unité de recherche :
IRIT : Institut de Recherche en Informatique de Toulouse Thèse dirigée par
Patricia STOLF et Stéphane CAUX Jury
Mme Ivona Brandic, Rapporteure M. Laurent George, Rapporteur Mme Anne-Cécile Orgerie, Examinatrice
M. Benjamin Depardon, Examinateur M. Paul Renaud-Goud, Examinateur
M. Pierre Lopez, Examinateur Mme Patricia STOLF, Directrice de thèse M. Stéphane Caux, Co-directeur de thèse
Abstract
Due to the increase of cloud, web-services and high performance computing demands all over the world, datacenters are now known to be one of the biggest actors when talking about energy consumption. In 2006 alone, datacenters were responsible for consuming 61.4 billion kWh in the United States. When looking at the global scenario, datacenters are currently consuming more energy than the entire United Kingdom, representing about 1.3% of world’s electricity consumption, and being even called the factories of the digital age.
Supplying datacenters with clean-to-use renewable energy is therefore es-sential to help mitigate climate change. The vast majority of cloud provider companies that claim to use green energy supply on their datacenters consider the classical grid, and deploy the solar panels/wind turbines somewhere else and sell the energy to electricity companies, which incurs in energy losses when the electricity travels throughout the grid. Even though several efforts have been conducted at the computing level in datacenters partially powered by renewable energy sources, the scheduling considering on site renewable energy sources and its variations, without connection to the grid can still be widely explored.
Since energy efficiency in datacenters is directly related to the resource consumption of the computing nodes, performance optimization and an efficient load scheduling are essential for energy saving. Today, we observe the use of cloud computing as the basis of datacenters, either in a public or private fashion. The main particularity of our approach is that we consider a power envelope composed only by renewable energy as a constraint, hence with a variable amount of power available at each moment. The scheduling under this kind of constraint becomes more complex: without further checks, we are not ensured that a running task will run until completion.
We start by addressing the IT load scheduling of batch tasks, which are characterized by their release time, due date and resource demand, in a cloud datacenter while respecting the aforementioned power envelope. The data utilized for the batch tasks comes from datacenter traces, containing CPU, memory and network values. The power envelopes considered, represent an
estimation which would be provided by a power decision module and is the expected power production based on weather forecasts. The aim is to maximize the Quality of Service with a variable constraint on electrical power.
Furthermore, we explore a workload composed by batch and services, where the resources consumption varies over time. The traces utilized for the service tasks originate from business critical datacenter. In this case we rely on the concept of phases, where each significant resource change in the resources consumption constitutes a new phase of the given task. In this task model phases could also receive less resources than requested. The reduction of resources can impact the QoS and consequently the datacenter profit. In this approach we also include the concept of cross-correlation to evaluate where to place a task under a power curve, and what is the best node to place tasks together (i.e. sharing resources).
Finally, considering the previous workload of batch tasks and services, we present an approach towards handling unexpected events in the datacenter. More specifically we focus on IT related events such as tasks arriving at any given time, demanding more or less resources than expected, or having a different finish time than what was initially expected. We adapt the proposed algorithms to take actions depending on which event occurs, e.g. task degradation to reduce the impact on the datacenter profit.
Résumé
Les centres de données sont reconnus pour être l’un des principaux acteurs en matière de consommation d’énergie du fait de l’augmentation de l’utilisation du cloud, des services web et des applications de calcul haute performance dans le monde entier. En 2006, les centres de données ont consommé 61,4 milliards de kWh aux états-Unis. Au niveau mondial, les centres de données consomment actuellement plus d’énergie que l’ensemble du Royaume-Uni, c’est-à-dire environ 1,3% de la consommation électrique mondiale, et ils sont de fait appelés les usines de l’ère numérique.
Un des moyens d’atténuer le changement climatique est d’alimenter les cen-tres de données en énergie renouvelable (énergie propre). La grande majorité des fournisseurs de cloud computing qui prétendent alimenter leurs centres de données en énergie verte sont en fait connectés au réseau classique et déploient des panneaux solaires et des éoliennes ailleurs puis vendent l’électricité produite aux compagnies d’électricité. Cette approche entraîne des pertes d’énergie lorsque l’électricité traverse le réseau. Même si différents efforts ont été réalisés au niveau informatique dans les centres de données partiellement alimentés par des énergies renouvelables, des améliorations sont encore possibles notamment concernant l’ordonnancement prenant en compte les sources d’énergie renouve-lables sur site sans connexion au réseau et leur intermittence. C’est le but du projet ANR DataZERO, dans le cadre duquel cette thèse a été réalisée.
L’efficacité énergétique dans les centres de données étant directement liée à la consommation de ressources d’un nœud de calcul, l’optimisation des performances et un ordonnancement efficace des calculs sont essentiels pour économiser l’énergie. La spécificité principale de notre approche est de placer le centre de données sous une contrainte de puissance, provenant entièrement d’énergies renouvelables : la puissance disponible peut ainsi varier au cours du temps. L’ordonnancement de tâches sous ce genre de contrainte rend le problème plus difficile, puisqu’on doit notamment s’assurer qu’une tâche qui commence aura assez d’énergie pour aller jusqu’à son terme.
Dans cette thèse, nous commençons par proposer une planification de tâches de type "batch" qui se caractérisent par leur instant d’arrivée, leur date
d’échéance et leurs demandes de ressources tout en respectant une contrainte de puissance. Les données utilisées pour les tâches de type batch viennent de traces de centres de données et contiennent des mesures de consommation CPU, mémoire et réseau. Quant aux enveloppes de puissance considérées, elles représentent ce que pourrait fournir un module de décision électrique, c’est-à-dire la production d’énergie prévue (énergie renouvelable seulement) basée sur les prévisions météorologiques. L’objectif est de maximiser la Qualité de Service avec une contrainte sur la puissance électrique.
Par la suite, nous examinons une charge de travail composée de tâches de type "batch" et de services, où la consommation des ressources varie au cours du temps. Les tracecs utilisées pour les services proviennent d’une centre de données à "business critique". Dans ce cadre, nous envisageons le concpet de phases, dans lequel les changements significatifs de consommation de resources à l’intérieur d’une même tâche marquent le début d’une nouvelle phase. Nous considérons également un modèle de tâches pouvant recevoir moins de ressources que demandées. Nous étudions l’impact de ce modèle sur le profit du centre de donnèes pour chaque type de tâche. Nous intégrons aussi le concept de "corrélation croisée" pour évaluer où placer une tâche selon une courbe de puissance afin de trouver le meilleur nœud pour placer plusieurs tâches (c.-à-d. Partager les ressources).
Enfin, nous présentons une approche pour faire face à des événements inattendus tels que des tâches exigeant plus ou moins de ressources que prévu, ou ayant une date de fin différente, et étudions les actions possibles, compte tenu de la dégradation des tâches et de l’impact sur le profit du centre de données.
Acknowledgments
First I would like to express my deepest gratitude to my advisors Patricia Stolf and Stéphane Caux for their excellent guidance and patience, creating a great atmosphere to pursue my scientific goals. I am also very grateful to Paul Renaud-Goud, who also guided me from the early stages of this research. I could not have imagined having better advisors and mentors for my Ph.D studies.
I would also like to thank the remainder of the thesis committee: Anne-Cécile Orgerie, Benjamin Depardon, Ivona Brandic, Laurent George and Pierre Lopez for their valuable time reviewing this dissertation and the questions that will incentive me to widen my research from various perspectives.
This research has been carried out with the support of the DataZERO project as well as Laplace and IRIT laboratories. I would like to thank all the members of the project for the valuable discussions during the group meetings. I would also like to express my gratitude for the SEPIA team, specially Jean-Marc Pierson, Georges da Costa and Amal Sayah.
For my co-workers and the frequent office visitors Guo Chaopeng, Léo Grange, Tanissia Djemai, Zong Yi Liu, Minh-Thuyen Thi, Berk Celik, Malik Irain, Tristan Salord, Ophélie Fraisier, Bilal Fakih, Morgan Seguela, Florent Dubois, Meryem Zaid and the brazilian friends. Thank you for all the coffees and beers shared, and specially the discussions that broadened my point of view in several subjects. I’m also thankful to Pedro Velho and Rodrigo da Rosa Righi who influenced me to pursue the scientific path through their enthusiasm and love for teaching.
Finally, I would like to thank my family, who taught me the value of life and always encouraged me to move forward, while providing me a safe place to call home.
When we least expect it, life sets us a challenge to test our courage and willingness to change; at such a moment, there is no point in pretending that nothing has happened or in saying that we are not yet ready. The challenge will not wait. Life does not look back.
— Paulo Coelho.
Contents
1 Introduction 1 1.1 Context . . . 1 1.2 Motivation . . . 2 1.3 Problem Statement . . . 4 1.4 Research Goals . . . 61.5 Approach to Manage the Problem . . . 6
1.6 Summary of Contributions . . . 7
1.7 Publications and Communication . . . 7
1.8 Dissertation Outline . . . 9
2 Related Work and Context 11 2.1 Cloud Computing . . . 11
2.1.1 Definition of Cloud Computing . . . 11
2.1.2 Cloud Computing Deployment Type . . . 12
2.1.3 Service Models Provided by Cloud Computing . . . 13
2.1.4 How Applications are Deployed in Cloud Environment . 14 2.2 Type of Tasks in Cloud Data Centers . . . 14
2.3 Energy Consumption in Cloud Data Centers . . . 15
2.4 Renewable Energy in Cloud Data Centers . . . 18
2.5 DataZERO Project Context . . . 19
2.6 Optimization Strategies for Task Scheduling in Cloud Computing - ITDM . . . 22
2.7 Literature Review of Task Scheduling in Cloud Data Centers With Renewable Energies . . . 25
2.7.1 Batch Task Scheduling . . . 25 vii
2.7.2 Services Task Scheduling . . . 28
2.7.3 Mixed Workload Scheduling . . . 31
2.7.4 Discussion of Literature and Classification . . . 32
2.8 Conclusion . . . 37
3 Modelling, Data and Simulation 39 3.1 IT Infrastructure Modeling . . . 39
3.1.1 Power Model . . . 40
3.2 Task Model . . . 41
3.2.1 Single Phase Batch Tasks . . . 41
3.2.2 Multiple Phases Tasks . . . 42
3.2.3 Phases Resource Change Impact . . . 45
3.3 Workload Generation . . . 47
3.3.1 Single Phase Batch Tasks . . . 48
3.3.2 Multi Phase Batch Tasks . . . 48
3.3.3 Multi Phase Services . . . 49
3.4 Data center Simulator . . . 50
3.5 Power Production Data Source . . . 50
3.6 Cost Metric for Cloud Computing . . . 51
3.6.1 Type of Computing Services . . . 51
3.6.2 Compensation and Resources Guarantee . . . 52
3.6.3 How is the performance of the machines presented . . . . 53
3.6.4 How to Calculate Profit . . . 53
3.6.5 Price Calculation Based on Amazon EC2 . . . 54
3.6.6 Price Calculation Based on Microsoft Azure . . . 55
3.6.7 Network Price . . . 57
3.7 Conclusion . . . 57
4 Single Phases Scheduling Approach 59 4.1 Introduction . . . 59
4.2 Problem Statement . . . 60
4.3 Proposed Approach . . . 61
4.4 Homogeneous Data Center Evaluation . . . 69
4.4.1 Results Evaluation . . . 71
4.5 Heterogeneous Data Center Evaluation . . . 74
4.5.1 Results Evaluation . . . 75
4.6 Comparison Homogeneous vs Heterogeneous Performance . . . . 79
4.7 Conclusion . . . 79
5 Multi Phases Scheduling Approach 81 5.1 Introduction . . . 81
5.2 Optimization Objectives . . . 82
5.3 Problem Formulation . . . 85
5.4 Proposed Approach . . . 85
5.4.1 Slots Aggregation . . . 86
5.4.2 Start Time Search Approaches . . . 87
5.4.3 Phases Degradation . . . 94
5.4.4 Resources Assignment Algorithms . . . 96
5.5 Evaluation Methodology . . . 106
5.6 Results Evaluation . . . 109
5.6.1 Workload With Balanced Profit . . . 109
5.6.2 Multiple Workloads With Unbalanced Profit . . . 122
5.6.3 Unbalanced Workload Variation and Degradation Impact Evaluation . . . 134
5.7 Towards Slots Removal . . . 150
5.7.1 Preliminary Results . . . 151
5.8 Conclusion . . . 152
6 Towards a Multi Phases Mixed Workload Online Scheduling 153 6.1 Introduction . . . 153 6.2 Problem Statement . . . 154 6.3 Optimization Objective . . . 155 6.4 Proposed Approach . . . 156 6.5 Evaluation Methodology . . . 157 6.6 Results . . . 159
6.6.1 Online Task Arrival . . . 159
6.6.2 Tasks Have Shorter or Longer Duration . . . 167
6.6.3 Tasks Request Less or More Resources . . . 172
6.7 Conclusion . . . 172
7 Conclusions and Perspectives 177 7.1 Conclusions . . . 177
7.2 Perspectives . . . 178
Appendices 181 A Workload Format Description 183 A.1 Single Phase Batch Tasks . . . 183
A.2 Multi Phase Batch Tasks . . . 184
A.3 Multi Phase Services . . . 187
B Cloud Price List 191
B.1 Amazon EC2 . . . 191 B.2 Azure . . . 191
List of Figures
1.1 Task power consumption and renewable energy production in a data center powered only by renewable energy. . . 5 2.1 Virtualization layers of computing resources in cloud data centers. 15 2.2 Taxonomy of techniques for improving energy efficiency in
large-scale distributed systems from [97]. . . 16 2.3 Switch on, off, idle and dynamic power consumption illustration. 17 2.4 Data center electrical infrastructure connected to renewable
energy sources. . . 18 2.5 Classical data center architecture with 2N . . . 19 2.6 Breakthrough architecture with 2N redundancy (Green + Green). 20 2.7 DataZERO interaction overview. . . 21 2.8 Tasks scheduling in node considering resources constraint. . . . 22 2.9 Task power consumption and renewable energy production after
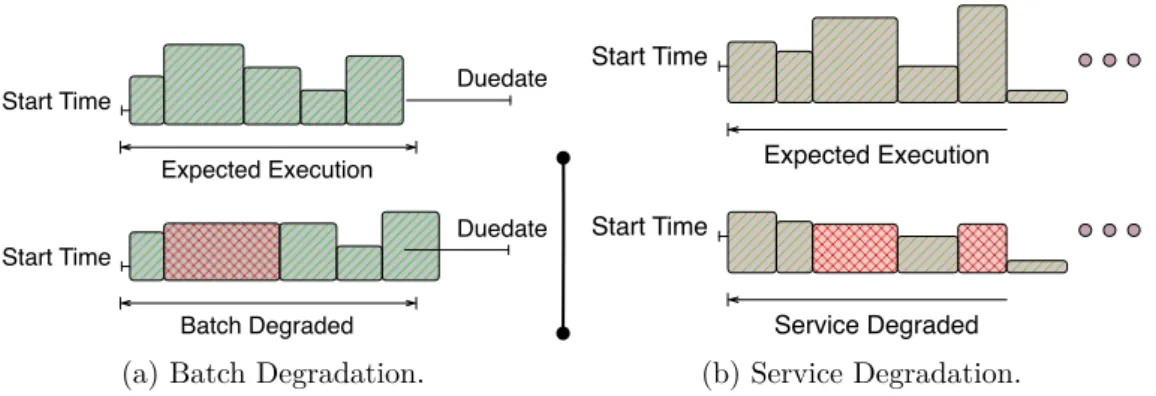
optimization in a data center powered only by renewable energy. 23 3.1 Illustration of a single phase batch task. . . 42 3.2 Illustration of a phases based batch task. . . 44 3.3 Illustration of a phases based cloud service. . . 45 3.4 Graphical representation of a phase degradation in batch (a)
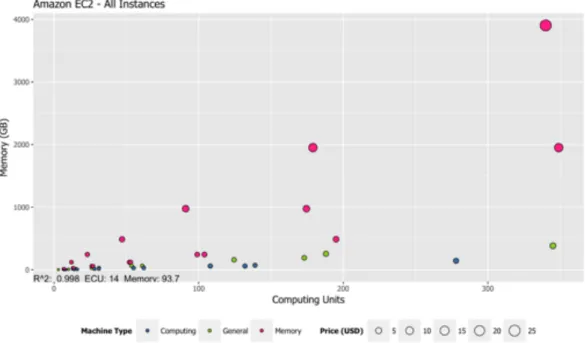
and service (b) with and without time increase. . . 48 3.5 Price variation according to traces of vCPU and Memory for all
instances of Amazon EC2. . . 54 3.6 Price variation according to traces of ECU and Memory for all
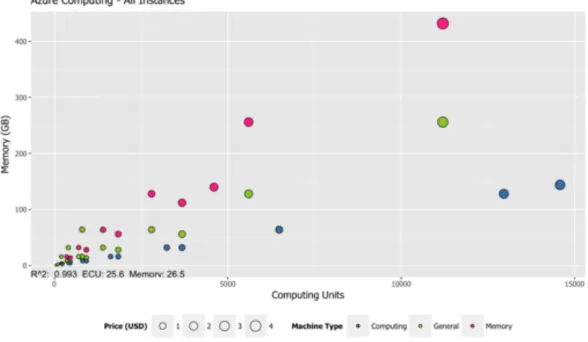
instances of Amazon EC2. . . 55 3.7 Price variation according to traces of vCPU and Memory for all
instances of Azure. . . 56 3.8 Price variation according to traces of vCPU and Memory for all
instances of Azure. . . 56 4.1 Genetic algorithm chromosome representation and crossover
example. . . 63 4.2 Genetic algorithm greedy assignment of processor and frequency. 63
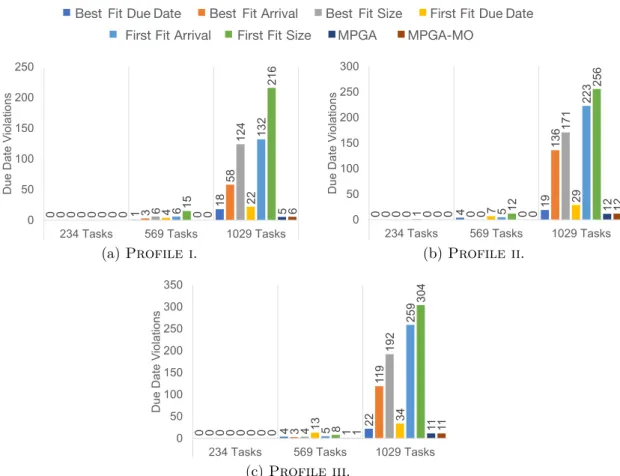
4.3 Tasks allocation inside a node with two processing elements using greedy scheduling inside GA (a), and DVFS adjustment where (b) is before DVFS and (c) after DVFS adjustment. . . . 65 4.4 Graphical representation of the three power profiles. . . 70 4.5 Due date violations of all power profiles and workload variations
in homogeneous infrastructure. . . 71 4.6 Energy consumption of all power profiles and workload variations
in homogeneous infrastructure. . . 72 4.7 Energy available and consumed in the power profiles using
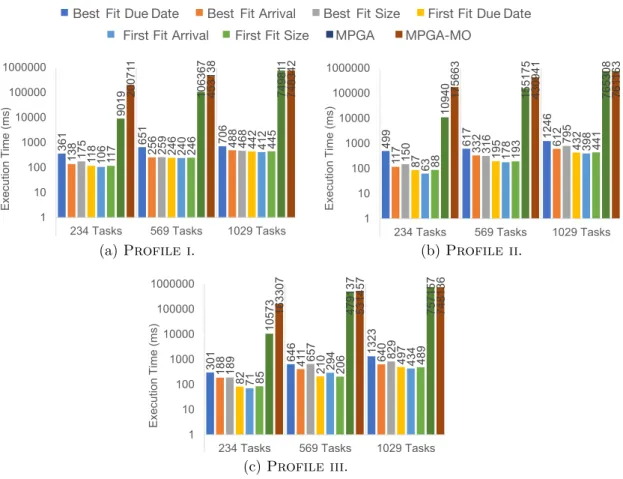
MPGA-MO based scheduling plan. . . 73 4.8 Execution time of the different algorithms with different number
of tasks with all profile variations and homogeneous infrastructure. 74 4.9 Due date violations of all power profiles and workload variations
in heterogeneous infrastructure. . . 76 4.10 Energy consumption of all power profiles and workload variations
in heterogeneous infrastructure. . . 77 4.11 Power available and consumed in the power Profile i
consid-ering two different algorithms and 1029 tasks. . . 78 4.12 Execution time of the different algorithms with different number
of tasks with all profile variations and heterogeneous infrastructure. 78 5.1 Example of a service mapped into slots, where we consider the
maximum of resources used on each core for each slot. . . 86 5.2 Slots representation in an infrastructure with 1 node and 2
cores with different task phases and the maximum of resources considered. . . 87 5.3 Scheduling time selection "First" available place. . . 88 5.4 Scheduling time selection "MaxE" available place. . . 88 5.5 Cross-Correlation with lag example of sinusoidal time series. . . 91 5.6 Cross-Correlation with lag example of two tasks with the same
resource consumption represented as time series. . . 92 5.7 Scheduling time selection “MaxCCPC” available place. . . 93 5.8 List of tasks utilized in the examples. . . 98 5.9 Scheduling illustration of a list of tasks utilizing FF algorithm
under a power constraint. . . 98 5.10 Scheduling illustration of a list of tasks utilizing AMaxE
algo-rithm under a power constraint. . . 100 5.11 Scheduling illustration of a list of tasks utilizing BFirstMaxE
algorithm under a power constraint. . . 101 5.12 Scheduling illustration of a list of tasks utilizing cross-correlation
between two PEs. . . 102 xii
5.13 Power production of renewable energy (wind and solar) utilized in the experiments. . . 107 5.14 Profit of workload with balanced profit for Batch and Service
for all algorithms utilizing power profile 1. . . 110 5.15 QoS of workload with balanced profit for Batch and Service for
all algorithms utilizing power profile 1. . . 111 5.16 Profit of workload with balanced profit for Batch and Service
for all algorithms utilizing profile 2. . . 112 5.17 QoS of workload with balanced profit for Batch and Service for
all algorithms utilizing power profile 2. . . 113 5.18 Profit of workload with balanced profit for Batch and Service
for all algorithms utilizing power profile 3. . . 114 5.19 QoS of workload with balanced profit for Batch and Service for
all algorithms utilizing power profile 3. . . 115 5.20 Profit of workload with balanced profit for Batch and Service
for all algorithms utilizing power profile 4. . . 116 5.21 QoS of workload with balanced profit for Batch and Service for
all algorithms utilizing power profile 4. . . 117 5.22 Power constraint and power consumption of workload with
bal-anced profit for Batch and Service for FF and BFirstMaxE. . . 118 5.23 Power constraint and power consumption of workload with
bal-anced profit for Batch and Service for MinCCFirst and MinCC-MaxCCPC. . . 119 5.24 Power constraint and power consumption of workload with
bal-anced profit for Batch and Service for LTPPN and SPT. . . 120 5.25 Execution time of the different algorithms evaluated. . . 121 5.26 Highest total profit comparison with cross-correlation algorithm
with power profile 1 for all workload variations. . . 123 5.27 Highest total profit comparison with cross-correlation algorithm
with power profile 2 for all workload variations. . . 124 5.28 Highest total profit comparison with cross-correlation algorithm
with power profile 3 for all workload variations. . . 125 5.29 Highest total profit comparison with cross-correlation algorithm
with power profile 4 for all workload variations. . . 126 5.30 QoS distance of different algorithms for both batch and services
over all workload variations with power profile 4. . . 127 5.30 QoS distance of different algorithms for both batch and services
over all workload variations with power profile 4. . . 128 5.30 QoS distance of different algorithms for both batch and services
over all workload variations with power profile 4. . . 129 xiii
5.31 QoS distance of different algorithms for both batch and services over all workload variations with power profile 4. . . 130 5.32 QoS for batch and services, profit and execution time of all power
profiles and the maximum workload (55 services and 211 batch tasks), with worst in center and best at exterior. . . 131 5.33 Power production and consumption with power profile 4 and the
point where tasks where violated using MinCCMaxCCPC. . . . 132 5.34 Percentage of profit distance between MinCCMaxE algorithm
and the worst performing of power profile 1 for all workload variations. . . 132 5.35 Percentage of profit distance between MinCCMaxE algorithm
and the worst performing of power profile 2 for all workload variations. . . 132 5.36 Percentage of profit distance between MinCCMaxE algorithm
and the worst performing of power profile 3 for all workload variations. . . 133 5.37 Percentage of profit distance between MinCCMaxE algorithm
and the worst performing of power profile 4 for all workload variations. . . 133 5.38 Total profit of different algorithms for over all workload variations
with power profile 1. . . 135 5.39 Total profit of different algorithms for over all workload variations
with power profile 2. . . 136 5.40 Total profit of different algorithms for over all workload variations
with power profile 3. . . 137 5.41 Total profit of different algorithms for over all workload variations
with power profile 4. . . 138 5.42 Profit distance of different algorithms for both batch and services
with power profile 1 for 49 and 55 services workload. . . 139 5.43 Profit impact of degradation removal considering power profile 1
and algorithm MinCCMaxCCPC. . . 140 5.44 Profit impact of degradation removal considering power profile 4
and algorithm MinCCMaxCCPC. . . 141 5.45 Profit impact of degradation removal considering power profile 1
and algorithm SFirstMaxE. . . 142 5.46 Profit impact of degradation removal considering power profile 4
and algorithm SFirstMaxE. . . 143 5.47 Profit impact of degradation removal considering power profile 1
and algorithm FF. . . 144 xiv
5.48 Profit impact of degradation removal considering power profile 4 and algorithm FF. . . 145 5.49 Profit impact of degradation removal considering power profile 1
and algorithm BFirstMaxE. . . 146 5.50 Profit impact of degradation removal considering power profile 4
and algorithm BFirstMaxE. . . 147 5.51 Profit impact of degradation removal considering power profile 1
and algorithm SPT. . . 148 5.52 Profit impact of degradation removal considering power profile 4
and algorithm SPT. . . 149 5.53 Illustration of the tree search proposition for the power constraint.150 5.54 Execution time of the scheduling with and without tree search. . 151 6.1 Comparison between Offline experiments methodology and Online.158 6.2 Percentage of profit reduction of workload with balanced profit
for Batch and Service for all online algorithms considering online task arrival utilizing power profile 4. . . 160 6.3 Profit of workload with balanced profit for Batch and Service
for all online algorithms considering online task arrival utilizing power profile 1. . . 161 6.4 QoS of workload with balanced profit for Batch and Service
for all online algorithms considering online task arrival utilizing power profile 1. . . 162 6.5 Profit of workload with balanced profit for Batch and Service
for all online algorithms considering online task arrival utilizing power profile 2. . . 163 6.6 Profit of workload with balanced profit for Batch and Service
for all online algorithms considering online task arrival utilizing power profile 3. . . 164 6.7 Profit of workload with balanced profit for Batch and Service
for all online algorithms considering online task arrival utilizing power profile 4. . . 165 6.8 QoS of workload with balanced profit for Batch and Service
for all online algorithms considering online task arrival utilizing power profile 4. . . 166 6.9 Profit of workload with balanced profit for Batch and Service for
all algorithms considering less time event utilizing power profile 1.168 6.10 Profit of workload with balanced profit for Batch and Service for
all algorithms considering less time event utilizing power profile 4.169 xv
6.11 Profit of workload with balanced profit for Batch and Service for all algorithms considering more time event utilizing power profile 1. . . 170 6.12 Profit of workload with balanced profit for Batch and Service
for all algorithms considering more time event utilizing power profile 4. . . 171 6.13 Profit of workload with balanced profit for Batch and Service
for all algorithms considering less resources event utilizing power profile 1. . . 173 6.14 Profit of workload with balanced profit for Batch and Service
for all algorithms considering less resources event utilizing power profile 4. . . 174 6.15 Profit of workload with balanced profit for Batch and Service for
all algorithms considering more resources event utilizing power profile 1. . . 175 6.16 Profit of workload with balanced profit for Batch and Service for
all algorithms considering more resources event utilizing power profile 4. . . 176
List of Tables
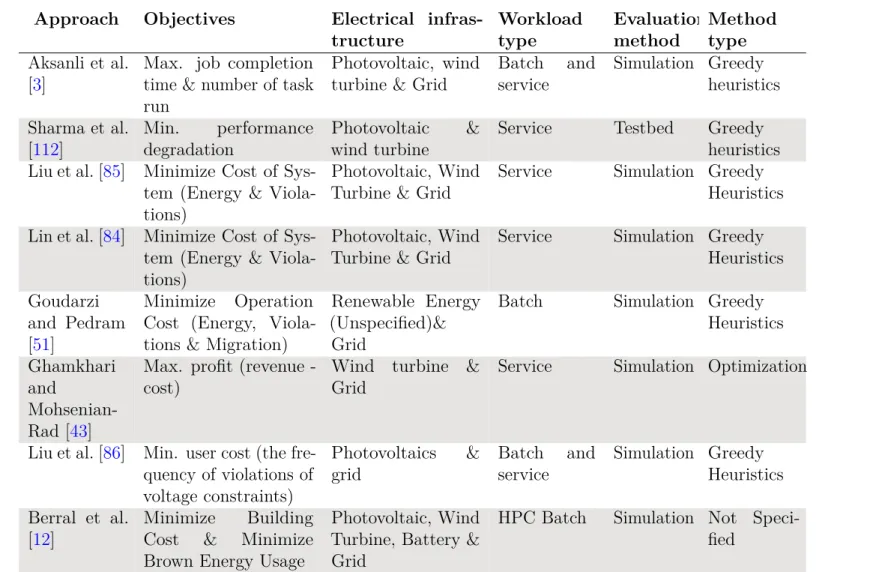
2.1 Summary of characteristics for existing renewable data center
scheduling works. . . 33
3.1 Variables notation of IT infrastructure. . . 40
3.2 Variables notation for single phase batch tasks. . . 41
3.3 Variables notation of phase based tasks. . . 43
3.4 Data movement price in Amazon EC2. . . 57
4.1 Power values for each frequency of the considered nodes. . . 69
4.2 Power values for each frequency of the considered nodes. . . 75
5.1 Violation compensation for batch tasks. . . 84
5.2 Violation compensation for services. . . 85
5.3 Summary of proposed algorithms characteristics. . . 108
B.1 Resouces and price of On-Demand Amazon EC2 instances eval-uated. . . 192
B.2 Resouces and price of Pay-as-you-go Azure Cloud instances evaluated. . . 193
Chapter 1
Introduction
1.1 Context
Nowadays, data centers are one of the most energy consuming facilities, being even called the factories of the digital age. Data centers are large computing facilities where several devices work to meet users demand. Due to the increase of data processing needs and the significant growth [42] of platforms such as Google, Amazon and Facebook to cite a few, data centers have to continue increasing in size and processing capability.
The majority of data centers rely in the cloud computing model [42] due to its advantages. Among these advantages we can cite the main ones (i) virtualization of computing resources and (ii) the pay-as-you-go billing model [60]. These features reduce of entry cost for smaller business trying to perform compute-intensive activities where an almost immediate access to hardware resources can be achieved without upfront capital. Also, the cloud model makes easier for enterprises to scale their services as the resources requirement grow. This computing model enables the access to computing resources in a transparent way for several applications and users, occasioning a significant growth on the cloud data centers. In 2006 the energy consumption of data centers reached 61.4 billion kWh only in the United States [78], and estimations of being in charge of consuming about 1.3% of world’s electricity [72]. In 2019 90% of companies have some process going through cloud computing and by 2021 cloud data centers are expected to process 94% of the computing workload [96]. These high values lead to several researches such as the ones presented in Kong and Liu [71], Orgerie et al. [97] and Mastelic et al. [89] to cite a few, where the aim is to improve the energy efficiency of data centers, in some of cases considering the integration of renewable energy sources.
Large size cloud data centers such as Amazon EC2 [6] (47.8% of the market 1
Chapter 1. Introduction
share [42]) are already taking steps to improve the energy efficiency of its data centers, with other providers going in the same direction. The final goal is to have efficient data centers and increase the part of the energy that comes from renewable energy sources [54]. Nevertheless, because of the intermittency of renewable energy sources, all the typical approaches consider that the cloud data center is always connected to the power grid, and the usage of renewable energies come with several challenges and constraints.
To tackle some of the challenges, funds have been allocated to projects such as DataZERO, where the aim is to investigate the possible solutions to design and operate a datacenter powered only by renewable energy. Moreover the project focuses on a distributed approach where a negotiation occurs among the different actors (data center and energy supplier) in order to find an agreement. In addition to the design of an efficient negotiation process, the objectives also include to efficiently control the power coming from different sources of energy. On the IT side, the main problem is the scheduling of tasks on the IT servers under the constraint of the power production over time. In this thesis we focus on the latter problem, concerning the IT scheduling. The goal is to design and prove the efficiency of a novel approach on how to schedule a mix of applications in cloud data centers without any connection to the grid, while respecting this variable energy production during time.
1.2 Motivation
Manufacture and powering of Information and Communication Technologies (ICT) devices was estimated to consume over 7% of global electricity in 2012 [54].
Projections anticipate that in 2030 data centers electricity demand alone can reach 13% of global electricity consumption [113]. This increase is in its biggest part due to the fact that cloud data centers are a fundamental part of ubiquitous [126] and pervasive [110] computing, where the access to information anytime and everywhere is an indispensable feature of everyday lives. More recent reports [25, 31] show that globally, devices and connections are growing faster (10% Compound Annual Growth Rate - CAGR) than the population. The same report also presents a growing number of M2M (Machine-to-Machine) applications, such as smart meters, video surveillance, healthcare monitoring, transportation, and package or asset tracking all of which rely on services running in a cloud data center.
This significant increase in the energy consumption of cloud data centers leads to a number of works that aim to improve the energy efficiency in these systems [3, 11, 45, 47] through leverages such as DVFS (Dynamic Voltage and Frequency Scaling), Software and Hardware improvements and workload
Chapter 1. Introduction consolidation. While the improvements in efficiency are promising, they are yet to catch up with the growth in data traffic and consumption of cloud services [103].
In the power production side, we observe an increase in the global total capacity of renewable power of 9% between the years of 2015 and 2016 [107] with continuous additions points towards greener data centers approaches. The regular infrastructure of a cloud data center, from the power point of view, consists in 2 circuits [118] capable of supplying power to the data center alone. With the additions in renewable energy sources, some approaches summarized in Kong and Liu [71] change one of these energy supply circuits for a renewable one. Nevertheless, all the works evaluated by the authors still consider the grid (brown energy) as a backup when not enough renewable energy is produced.
This absence of this brown energy as backup brings new challenges from the IT perspective in how to handle the intermittent nature of the renewable energy sources. Some directions on how to manage the workload when these facilities are powered only with renewable energy and no connection to the grid were presented in Sharma et al. [112], the only work outside of DataZERO project that evaluates such a scenario. In this case, the authors focus mainly on deactivating server when there is no energy. The key point is that this type of action is not realistic for the vast majority of applications running in cloud platforms, since the authors assume that all the applications would instantaneously stop and resume their execution when energy is available. The authors also state that application modifications are necessary to adapt traditional server-based applications for “blinking”, since these applications implicitly assume always-on or mostly-on servers. Overall, the reliability deterioration when utilizing up to 100% of renewable energy sources need further studies [40,74].
In our case none of the power supply branches will be connected to the grid, since DataZERO proposes a “Breakthrough” data center architecture [101]. Instead of a regular UPS we have a green energy sources only connection, which comes in line with the new goals for greener data center [54]. The complete removal of the connection to the power grid imposes several new challenges, such as the dimensioning of the renewable energy sources and storage to provide enough energy to the data center, specially in the hours of peak operation. Another challenge is the adaptation of the IT workload to fit under the amount of energy that is produced.
In this thesis we focus mainly on the IT challengers, where the power available for a given time interval (hours/days/weeks) would come as an input. In other words, contrary to the works previously evaluated, and the ones that will be further presented, we focus on adapting the workload to the power
Chapter 1. Introduction
available and not the contrary. Additionally, the power would come strictly from renewable energy sources, and the idea is to provide feasible scheduling solutions with reductions in applications performance if necessary, associated with a price (profit to the data center) and quality of service metric.
1.3 Problem Statement
Recently, there have been a number of works that investigate the management of data center power consumption. As examples we can cite job scheduling, virtual machine migration, service rate allocation, software controlling, shifting demand in time, resources consolidation and DVFS. Such approaches have mainly been explored in a context where the data center is connected to the power grid [71], and removing this connection can impose several challenges [101] specially on how to handle the servers and applications on the data center side.
A first challenge is the classical problem of applications placement. The cloud provider needs to decide in which one of the cloud resources the application will be executed and when. One of the applications (here also called tasks) considered in this thesis can be defined by a start time and expected finish time between which an amount of computation needs to be done. In our case we also consider that this amount of computation have variations over time and that it can be executed according to what the user specified or with a smaller performance. In the case of smaller performance an increase in the execution time would occur risking a violation of the expected finish time. We call this specific type of application batch tasks.
The other type of applications considered are services where there is only a defined start time and there is no knowledge of when the application ends. For this type of applications a reduction in the expected computational resources translates into users not being served, though implying a reduction in the Quality of Service (QoS).
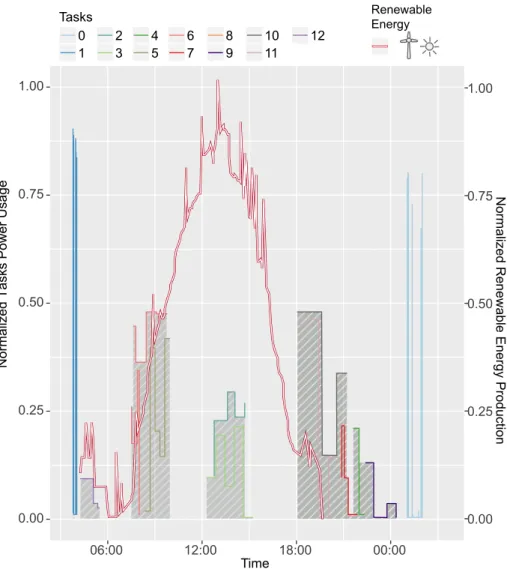
A scenario where the tasks would need to receive less computing resources or change their execution time is presented in Figure 1.1. In the presented case we can see a set of 12 tasks and their corresponding power consumption. As an illustrative example we consider a 1:1 ratio between computing resources requested and power consumption. The red line on top represents the total power ◊ time that is expected to be produced in that day. In this case, if we try to place with the requested amount of computing resources and in the moment that the users submit each task, the energy produced by the renewable energy sources would not be enough. As we can see in the figure the renewable energy production can be intermittent due to its source (solar or wind turbines) an a high variability can occur.
Chapter 1. Introduction 0.00 0.25 0.50 0.75 1.00 12:00 Time 18:00 00:00 06:00 0.00 0.25 0.50 0.75 1.00
Normalized Renewable Energy Production
Normalized Tasks Power Usage
Tasks 0 1 2 3 4 5 6 7 8 9 10 11 12 Renewable Energy
Figure 1.1: Task power consumption and renewable energy production in a data center powered only by renewable energy.
In this scenario, we can highlight the second challenge imposed by this intermittent nature: how to handle the moments where there is not enough energy to execute a given application, and what are the possible leverages that can be utilized in order to not compromise the application’s QoS? Here QoS can be reduced if the task finishes after the expected finish time in case of batch, or if the resources allocated to services are reduced. Also, in case of performance degradation, i.e. service receiving less resources or batch finishing after the expected time, what tasks should be degraded. Finally, another point is if all the users should get financial compensations as done today by the traditional cloud data centers disregarding their flexibility (time between task submission
Chapter 1. Introduction and finish time)?
1.4 Research Goals
In this thesis we limit our scope to single data centers only with renewable energy. We focus mainly on the IT part where we decide where to place each task among the several computing resources in the data center, choose the amount of resources delivered, as well as the time where the tasks start executing. The energy management is considered as an input of the system according to the DataZERO project. Considering the challenges previously highlighted, the research question that we aim to answer is: “How to schedule a mix of batch and services in a cloud data center with a power envelope as constraint?”.
1.5 Approach to Manage the Problem
We utilized an incremental approach for the highlighted problems. We start by studying the task scheduling of simplified batch tasks (constant resource consumption) with a power envelope as constraint in Chapter 4. The evaluated tasks originate from traces of Google datacenters and to schedule them we focus on the extension of classical literature algorithms, also utilizing leverages such as DVFS and switch nodes on/off when unused. To evaluate the approach we consider the number of tasks that are violated (exceed the expected finish time) as a QoS metric.
Later, in Chapter 5 we include a detailed workload model with a mix of batch and service tasks also based on real cloud data centers. We also considered resources variations during the execution time and algorithms that explore these variations. In this same approach we include a financial profit metric, detailed in Section 3.6 that considers the impact when resources cannot be delivered to the users in case of services and violations in the expected finish time in case of batch tasks. Several algorithms are proposed to handle the scheduling of these tasks, including variations that utilize cross-correlation to find a better placement. Finally, we explore an online variation of the previous approach in Chapter 6 and how the system behaves when the behavior of the tasks is not equal to the expected one (tasks having a longer duration or consuming more resources for instance).
Chapter 1. Introduction
1.6 Summary of Contributions
In this thesis we proposed 5 contributions, where the primary contributions are the efficient scheduling heuristics and meta heuristics for cloud data centers powered exclusively by renewable energy sources discussed in Chapter 4, the detailed mixed workload approach presented in Chapter 5 and an online adap-tation is presented in Chapter 6. The secondary contributions is the extensive evaluation process that each of those approaches had to undergo to be validated and their specificities. We highlight that each one of the approaches takes in consideration the DataZERO scenario detailed in Section 2.5. We organize these contributions as follows:
1 Single Phase Batch Scheduling [21, 22] (Chapter 4): Set of heuristic and meta heuristic approaches to schedule single phases batch tasks under a power envelope maximizing the performance;
2 Multi Phases Mixed Workload Scheduling (Chapter 5): Set of heuristic approaches to schedule multi phases batch and services under a power envelope maximizing the profit;
3 Phases Based Applications with Degradation [24] (Chapter 5): An exten-sion of phases based applications [38] including the degradation factor and what is the impact of it in the proposed scheduling algorithms; 4 Cloud Based Profit with Flexibility [24] (Section 3.6): An extension of
traditional compensation mechanism in case of violation in cloud based data centers to fairly compensate users that are willing to give more time flexibility to execute a given application (which goes in line with better utilization of renewable energies);
5 Multi Phases Mixed Workload Online Scheduling with Uncertainty (Chap-ter 6): An adaptation of the offline multi phases approach in order to consider scenarios where tasks arrive at any time and have a different resources consumption and execution time than the one expected.
1.7 Publications and Communication
Submitted Journals:• Gustavo Rostirolla, Leo Grange, Minh-Thuyen Thi, Patricia Stolf, Jean-Marc Pierson, Georges da Costa, Gwilherm Baudic, Marwa Haddad,
Chapter 1. Introduction
Ayham Kassab, Jean-Marc Nicod, Laurent Philippe, Veronika Rehn-Sonigo, Robin Roche, Berk Celik, Stephane Caux, Jerome Lecuivre. Sizing and Management of Energy Sources for Green Datacenters with Renewable Energy. Renewable & Sustainable Energy Reviews.
• Minh-Thuyen Thi, Jean-Marc Pierson, Georges Da Costa, Patricia Stolf,Jean-Marc Nicod,Gustavo Rostirolla, Marwa Haddad. Negotiation Game for Joint IT and Energy Management in Green Datacenters. Future Genera-tion Computer Systems.
Accepted Journals:
• Jean-Marc Pierson, Gwilherm Baudic, Stéphane Caux, Berk Celik, Georges Da Costa, Leo Grange, Marwa Haddad, Jerome Lecuivre, Jean-Marc Nicod, Laurent Philippe, Veronika Rehn-Sonigo, Robin Roche, Gustavo Rostirolla, Amal Sayah, Patricia Stolf, Minh-Thuyen Thi and Cristophe Varnier. "DATAZERO: Datacenter With Zero Emission and Robust Management Using Renewable Energy," in IEEE Access, vol. 7, pp. 103209-103230, 2019.
Accepted Peer Reviewed Conferences:
• Stephane Caux, Paul Renaud-Goud, Gustavo Rostirolla, Patricia Stolf. IT Optimization for Datacenters Under Renewable Power Constraint. Euro-Par 2018: Parallel Processing. Euro-Par 2018.
• Stephane Caux, Gustavo Rostirolla, Patricia Stolf. Smart Datacenter Electrical Load Model for Renewable Sources Management. International Conference on Renewable Energies and Power Quality (ICREPQ 2018), Salamanca, Spain. Vol. 16, European Association for the Development of Renewable Energies, Environment and Power Quality, p. 127-132, April 2018.
• Berk Celik, Gustavo Rostirolla, Stephane Caux, Paul Renaud-Goud, Patricia Stolf. Analysis of demand response for datacenter energy man-agement using GA and time-of-use prices. IEEE PES Innovative Smart Grid Technologies Europe (ISGT-Europe) 2019.
• Stephane Caux, Paul Renaud-Goud, Gustavo Rostirolla, Patricia Stolf. Phase-Based Tasks Scheduling in Data Centers Powered Exclusively by Renewable Energy. Symposium on Computer Architecture and High Performance Computing (SBAC-PAD) 2019.
Others Disseminations:
Chapter 1. Introduction • Talk: Optimisation IT sous contrainte de puissance provenant de sources
renouvelables, GreenDays@Toulouse, July 2018
• Poster: Challenges and Solutions for Data Center Powered by on Site Renewable Energy Only. Gustavo Rostirolla, Leo Grange, Patricia Stolf, Stephane Caux, Georges da Costa, Jean-Marc Pierson. European Science Open Forum (ESOF 2018), Toulouse 9-14 July 2018.
• Talk: Tasks Scheduling in Cloud Datacenters Under Renewable Power Constraint, Journées Cloud 2018, Troyes, September 2018
• Talk: Phase-based tasks scheduling in data centers powered exclusively by renewable energy. Workshop on Renewable Energy-Powered Datacenters. October 14-16, 2019, in Besancon, France.
1.8 Dissertation Outline
The remaining portion of the dissertation is organized as follows:
Chapter 2 - Related Work and Context: In this chapter we focus
on presenting the fundamentals that will help the reader to understand the remainder of the work. We start by presenting concepts such as cloud computing, what are tasks, the main components when talking about energy consumption in cloud data centers and how is renewable energy inserted in this context. Then, we present the DataZERO project context where this work is inserted, how tasks can be placed and what are the problems involved. After we present a comprehensive list of works that approach the energy consumption optimization in cloud data centers powered by renewable energies and conclude by discussing the gaps in studied approaches.
Chapter 3 - Model: In this chapter we focus mainly in the model
abstractions that will be utilized in the remainder of this work. We first present the IT infrastructure model, followed by the power consumption model and the distinctions that will be made between the two different approaches (single phases and multi phases based). We then introduce the tasks model for each approach and their particularities, followed by the data sources for the workload generators and how these generators can be utilized for future approaches. Finally, we present the power production data sources for wind turbines and solar panels considered in this work and how all the aforementioned features are combined in the chosen simulator.
Chapter 4 - Single Phase Batch Scheduling: In this chapter we
propose to optimize the IT scheduling of batch tasks to execute tasks within a given power envelope of only renewable energy as a constraint. We utilize
Chapter 1. Introduction
greedy heuristics as well as meta-heuristics to perform the task placement, with aim at minimizing the due date violations. The results presented are related to the publications in [22] and [21].
Chapter 5 - Multi Phases Mixed Workload Scheduling: In this
Chapter we improve the application model from the previous chapter and added a cost model for the task placement. We utilize greedy heuristics, as in the previous chapter, and adapt them to handle the new task and cost models. We also introduce the usage of cross-correlation in the algorithms and the reduction of the delivered resources (degradation). The results presented are related to the publication in [24] and [23].
Chapter 6 - Towards a Multi Phases Mixed Workload Online Scheduling: In this Chapter we consider the same application and cost
model from the previous one. We introduce online events such as task arrival, and resources consumption changes that could occur during the application execution. These variations are handled by reactive actions, utilizing an adaptation of some of the algorithms previously presented.
Chapter 7 - Conclusions and Perspectives: Finally, in this chapter
we make the overall conclusions and summarize the contributions of this work, along with the discussion of future works.
Chapter 2
Related Work and Context
In this chapter we focus on presenting the fundamentals that will help the reader to understand the remainder of the work. We start by presenting concepts such as cloud computing, what are tasks, the main components when talking about energy consumption in cloud data centers and how is renewable energy inserted in this context. Then, we present the DataZERO project context where this work is inserted, how tasks can be placed and what are the problems involved. After we present a comprehensive list of works that approach the energy consumption optimization in cloud data centers powered by renewable energies and conclude by discussing the gaps in studied approaches.
2.1 Cloud Computing
The term cloud computing was coined by Compaq in 1996 [32]. The model appeared commercially in early 2000s through which customers could access computing services over the Internet and pay for what they use (Pay-as-you-go). Its popularization started in late 2000s led by enterprises such as Amazon and Microsoft. This new paradox changed the way companies managed their computing infrastructures. In this section, we discuss in more details the main characteristics of Cloud Computing and what are the forms of deployment.
2.1.1 Definition of Cloud Computing
By the definition of [60], cloud computing is a model for allowing ubiquitous, convenient and on-demand access to a shared set of configurable computing resources that can be quickly allocated and released with minimal management effort. With the introduction of cloud computing, tasks that were previously executed locally are now placed on servers of unknown location over the Internet.
Chapter 2. Related Work and Context
The two key actors in Cloud Computing are: (i) Cloud computing service providers and (ii) customers (here also called clients/users). A Cloud comput-ing service provider (or cloud provider) is the entity, person or organization responsible for making a service available to the cloud customers. The cloud provider is also responsible for managing the necessary infrastructure to deliver its services to the cloud service customers according to the established contract.
In the year of 2018 for instance, we can cite as the main cloud providers [42]: Amazon EC2 [6] with 47.8% of the market share, Microsoft Azure [92] with 15.5%, Alibaba Cloud [4] with 7.7%, Google Cloud [50] with 4.0% and IBM Cloud [63] with 1.8%.
A cloud service customer is the person or organization that maintains a business contract and utilizes the service of cloud providers. In this case, cloud computing services are served on-demand and accessed through the Internet. This means that customers can request computing resources from the cloud providers at any time.
Cloud provider and customer are linked by a contract. This contract, as defined by the National Institute of Standards and Technology (NIST), is called Service Level Agreement (SLA) [9]. It establishes prices, time to recover from operational failures and Quality of Services (QoS) [111] that should be respected. Here we follow the NIST definition of QoS [111] which is the measurable end-to-end performance properties of a network service, as to satisfy specific customer application requirements. The properties can include throughput, transit delay, error rates, security, packet loss, resources violation, execution time violation and so on. We detail after on each of our approaches what was the specific QoS on each case.
2.1.2 Cloud Computing Deployment Type
Regarding the deployment, cloud infrastructures can be maintained in the following ways: (i) Private Cloud; (ii) Public Cloud; (iii) Community Cloud; and (iv) Hybrid Cloud [104]. Below we detail these deployment models, according to the definitions of [90] and [104]:
1. Private Cloud: The cloud infrastructure is provisioned for the sole use of a single organization. It may be owned, managed and operated by the organization, a third party, or some combination of both, and may or may not be physically located at the organization. As example we can cite Amazon VPC, Rackspace Private Cloud and VMware Private Cloud; 2. Public Cloud: The cloud infrastructure is provisioned to be utilized by the general public and this infrastructure is shared among multiple users.
Chapter 2. Related Work and Context It can be owned, managed, and operated by a company, university, or government organization. It is located in the cloud provider. As example we have Amazon E2C, Google Cloud and Microsoft Azure;
3. Community Cloud: The cloud infrastructure is provisioned for exclusive use by a specific community that has common concerns. It may be owned, managed and operated by one or more community organizations or a third party, and may or may not physically exist at the site. The most common examples are governmental clouds for regulated healthcare such as e-SUS;
4. Hybrid Cloud: The cloud infrastructure is a composition of two or more cloud infrastructures (private, community or public) that remain single entities but are joined by standardized or proprietary technology.
2.1.3 Service Models Provided by Cloud Computing
In a cloud the offered computing resources can range from the physical resources (hardware like CPU and memory), as well as software resources. These different options are called service templates, and offered by a cloud provider according to the type of resources that are available [104]. Each of the available service models is detailed below, according to the definitions of [90] and [104]:
1. SaaS - Software as a Service: The capacity provided to the user is limited to applications running on a cloud infrastructure. Applications are accessible from multiple client devices and the consumer does not manage or control the infrastructure where the software is hosted, this is the responsibility of the service provider.
2. PaaS - Platform as a Service: The capacity provided to the user in this case is located one level below SaaS where applications can be deployed to a given cloud infrastructure where programming languages, libraries, services, and support tools are available. The consumer does not manage or control cloud infrastructures such as network, servers, operating systems or storage, but has control over deployed applications and configurations.
3. IaaS - Infrastructure as a Service: In this model, the user is offered fundamental computing resources such as processing (CPU), memory, storage and networking allowing the user to deploy arbitrary software. Through an hypervisor the virtualization of the computational resources is made available to the user in form of virtual machines (VMs). Resource
Chapter 2. Related Work and Context
virtualization is the key feature of this model allowing the user to run their own operating system, which are running on top of the infrastructure offered.
2.1.4 How Applications are Deployed in Cloud
Environ-ment
Since in this work we will focus on IaaS, a better explanation of what are VMs, and how cloud providers manage them, is necessary. VMs, illustrated in Figure 2.1 are hosted in physical machines with the help of a hypervisor. There can be several VMs running at the same time in the same physical machine, however, one VM is not aware of the existence of the others. Several VMs can be running in the same machine without the user knowledge. VMs have access to virtualized resources which can be CPU, Memory, Disk and so on, where these resources have the same functionality as the physical hardware, and the hypervisor is the responsible for managing them. The user applications are then deployed on the selected VMs.
Each cloud provider dispose of a catalog with multiple VMs configurations and a given price for it. This aspect will be further discussed when we present Section 3.6 where we discuss the cost model. The key aspect is that the customer is the one that should identify the most adapted VM types for his application, which in many cases might lead to over-provisioned resources. To benefit from this aspect, cloud providers use something called overcommitment of resources, which means that a given resource might be shared among several users in values bigger than the ones available (i.e. 4GB of memory might be shared among 5 VMs each requesting 1 GB). Overcommitment is possible and profitable for cloud providers due to the fact that the majority of cloud users does not exceeds 80% the utilization of resources reserved [109].
2.2 Type of Tasks in Cloud Data Centers
Tasks in cloud data centers are considered here as an application of a given type that the user submitted to be executed. We consider that each task is isolated in a virtual machine and can be directly deployed on the requested hardware. We classify our applications in two different types:
• Batch jobs [34, 105]: This type of task does not run interactively. It is rather submitted to a batch scheduler that can thus delay it in time, assign it to different hosts or control the voltage and frequency of its processor to limit the power it consumes. A batch job is characterized
Chapter 2. Related Work and Context VM 1 Infrastructure Host OS Hypervisor OS 1 App 1 VM 2 OS 2 App 2 VM k OS i App j
Figure 2.1: Virtualization layers of computing resources in cloud data centers. by its submission date and may have a due date or a deadline indicating when it must be finished. A due date can be violated but then generates a quality of service penalty. A deadline can not be violated, if the job has not finished before it is canceled.
• Services [114]: Is an application that handles requests issued by interactive clients. A service is characterized by a service rate, number of handled requests per second and consequent consumed resources to process these requests. Power consumption limitation can be achieved by decreasing the service rate. A service may only run in a virtual machine. In that case, limiting the resources allocated to the virtual machine may decrease the service energy consumption and migrating virtual machines to group them may be a way to power down some servers.
The usage of both task models aim to represent the different type of tasks found in datacenters as demonstrated by Jia et al. [66]. These task models will be utilized later to classify the works from the literature. A more detailed model of the tasks considered in this work is presented in Section 3.2 as well as how each task execution is translated into a given power consumption in Subsection 3.1.1.
2.3 Energy Consumption in Cloud Data
Cen-ters
With the rapid growth in data centers energy consumption [69, 72, 78] the reduction of energy usage became a major concern. Several techniques are
Chapter 2. Related Work and Context
sented to save energy [97] in this context, and opportunities and challenges [36] that are still open. In this section we present what are the sources of energy consumption in data centers and some of these research initiatives.
When looking at large-scale distributed systems, several energy-saving techniques can be used, as presented in [97], illustrated in the taxonomy of Figure 2.2. In this Figure the author presents several leverages that can be utilized to improve the energy consumption in data centers. Another important factor that should be highlighted is cooling consumption, which can represent around 30% and 40% of the total energy consumption of a data center. Nevertheless, thermal management has been widely studied in the literature [27, 102,116] and we will not focus on it in this work. The thermal aspects can be explored lated as independent problems. Another way to improve this factor is to utilize more energy efficient hardware in the data center, as the technology evolves.
A Survey on Techniques for Improving the Energy Efficiency 47:3
Fig. 1. Overview of techniques to improve the efficiency of computing nodes.
equipment or components embedded in Power Distribution Units (PDUs) and temper-ature sensors, where the latter case often provides smaller measurement granularity. Deploying energy sensors or wattmeters can be costly if not done at the time the whole infrastructure (i.e., cluster or data center) is set up. An alternative and less expensive solution is to use energy models to estimate the consumption of components or an entire infrastructure, but good models should be lightweight and should not interfere in the energy consumption that they try to estimate.
Models can be built to estimate the energy consumed by racks, devices, processes, services, and so forth. For example, PowerTOP2 is a Linux software utility developed
by Intel and whose goal is to “find the software component(s) that make a laptop use more power than necessary while it is idle.” PowerTOP uses Advanced Configuration and Power Interface (ACPI)3 to estimate power usage. Microsoft’s Joulemeter is also
an example of software tool that estimates the power consumption of a computer by tracking information on several hardware components.
When considering computing resources, their processors are generally the villains and are among the most consuming components. The power P a processor consumes can be expressed as the sum of the static power Pstaticand the dynamic power Pdynamic.
Pdynamic is given by
Pdynamic= ACV2f,
where A is the percentage of active gates, C is the total capacitance load, V the supply voltage, and f is the frequency [Ge et al. 2005]. Several solutions have been proposed in the literature to evaluate at different levels the energy that processors consume [Castagnetti et al. 2010], including:
—Cycle-level estimation, where the power that each processor unit consumes is esti-mated at each clock cycle
—Instruction-level power analysis, in which the power consumption of processor in-structions are summed to estimate the energy that a program consumes
—Power analysis at the functional level, based on analyzing the processor architecture
2PowerTOP: https://01.org/powertop/.
3ACPI is a standard developed by Hewlett-Packard, Intel, Microsoft, Phoenix Technologies, and Toshiba. Its goals are to reduce a computer’s power consumption by switching off its components, whereas the operating system manages the power supply of each component.
ACM Computing Surveys, Vol. 46, No. 4, Article 47, Publication date: March 2014.
Figure 2.2: Taxonomy of techniques for improving energy efficiency in large-scale distributed systems from [97].
Considering the aforementioned taxonomy, in this work we profit from the utilization of cloud computing and virtualization, previously detailed, where the energy saving comes from resources sharing and overcommitment to reduce the wasted energy on over-provisioned VMs. We also utilize Dynamic Voltage and Frequency Scaling (DVFS), which consists in reducing the frequency of a given processor, consequently reducing its voltage and energy consumption. Another technique explored is the optimization of task scheduling, which will be detailed in Section 2.6. Finally, another technique that is utilized is switch on/off the computing servers, here also called computing nodes.
Furthermore, regarding the energy consumption of a node we can separate 16
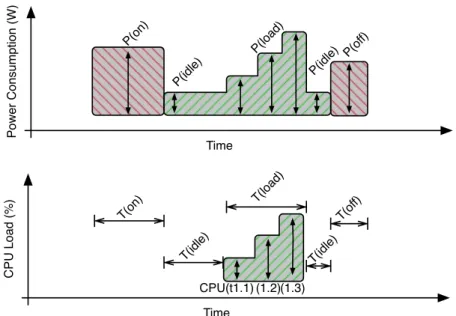
Chapter 2. Related Work and Context it in two parts named statics and dynamic where the total power consumption is the sum of these two factors. In the static part we have what would be the power consumption of a node that has been switched on and is in a steady state, without any workload. This static power comes from components such as motherboard, fans, idle disks and so on. The other part (dynamic) comes from the actual usage/processing of a given load and increases according to the usage of CPU and memory for instance. In Figure 2.3 in the green block, we present an illustration of how this power consumption works. On the top, in green, we have the power consumption due to the execution of each one of the 3 phases of the load presented in the bottom, this allows the visualization of the two different factors. Furthermore we have some part P(idle) that is consumed without processing any task. The power model utilized is presented in details in Section 3.1.1. P(o ff) P(o n) Time Po w e r C o n su mp ti o n (W ) Time C PU L o a d (% ) T(o n) T(o ff) T(idl e) T(loa d) T(idl e) P(idl e) P(loa d) P(idl e) CPU(t1.1) (1.2)(1.3)
Figure 2.3: Switch on, off, idle and dynamic power consumption illustration.
Other than the energy that is consumed by the task execution and idle, we also have the energy consumed by switching on (P (on) ◊ T(on)) and off a node (P (off ) ◊ T(off )). This is represented in Figure 2.3 in the two red blocks, where we have a power peak to switch on and off the node.
Chapter 2. Related Work and Context
2.4 Renewable Energy in Cloud Data Centers
Other than trying to reduce the use of the overall energy in cloud data centers, one can also utilize local renewable resources (on-site generation) and/or re-newable energy available on the grid (off-site generation) [106]. The selected approach depends on the availability of these energy sources (solar irradiance and wind speed for instance) and the cost to deploy the intermittent infrastruc-ture. Studies can be found on what are the alternatives that are more adapted for each region [108] and the cost to deploy it [94].
Using green energy in data center also implies to change the data center outside electrical infrastructure. Regarding this aspect, we present in Figure 2.4 an illustration on how renewable energy could be linked in a 2N infrastructure (2 power supply circuits), as utilized in [53]. In this case, more than the connection between the Power Distribution Unit (PDU) to the Uninterruptible power supply (UPS) which is finally connected to the grid and power generators, we have another branch in which the UPS is connected to renewable energy sources (on or off site). We also have an ATS (Automatic Transfer Switch), which means that the systems can hot swap between each other in case of failure.
Cloud Computing Data Center
Computational Resources Node 0 Node n Processors Interconnection Network P0 P1 Pj P0 P1 Pk ATS PDU UPS Generator Grid A Renewable Energy Sources
Figure 2.4: Data center electrical infrastructure connected to renewable energy sources.
Nevertheless, most of the IT companies that have large scale distributed systems and advertise them as 100% renewable, such as Google1 since 2017,
gen-erate the energy off-site. This means that several other transmission (electrical grid might not able to support) and distribution costs are involved, as well as losses that occur in the transmission [128]. If the cloud provider desires greater control on energy supply, the most recommended approach is on-site generation. In this case the provider avoids the incurred transmission and distribution costs,
1https://sustainability.google/projects/announcement-100/
Chapter 2. Related Work and Context also reducing the system losses [128]. The main drawback is that this type of installation requires large financial investment, which might not be possible for some small IT companies [94]. Despite of the chosen method, one of the electrical branches is normally connected to a reliable (not intermittent) energy source[118].
In Section 2.5 we present how the infrastructure considered in this work is structured and in Section 3.5 how we abstract it to focus on the IT optimization.
2.5 DataZERO Project Context
The DataZERO project [101] investigates ways to operate a data center with renewable energy sources on site. As these sources are intermittent [1], there is a need to optimize the IT load to the energy availability. Also contrarily, it is necessary to optimize the energy production to the incoming IT load.
From the electrical point of view, redundancy is a main feature for data centers. Most of them rely in the classical 2N [98] and variations such as N+1 or 2N+1, since data centers have to guarantee QoS to the clients in order to not give money/credit back. N+1 systems have 1 additional UPS module to handle an adequate supply of power. This system however is not fully redundant and can still fail, since it runs on a common circuit. The 2N approach however consists in connecting the data center to two distinct power systems, each containing N components (i.e. double the whole electrical infrastructure with no single points of failure). Additional variations such as 2N+1 can also be found, consisting in two distinct power systems (2N) and one additional UPS (+1).
Cloud Computing Data Center
Computational Resources Node 0 Node n Processors Interconnection Network P0 P1 Pj P0 P1 Pk ATS PDU UPS Generator Grid A Grid B
Figure 2.5: Classical data center architecture with 2N
In Figure 2.5 we illustrate a classical 2N infrastructure where we have the machines connected to an ATS, which means that the system can hot swap between each other in case of failure. Next we see the PDU connected to the UPS which is finally connected to the grid and power generators.