HAL Id: hal-01716116
https://hal.archives-ouvertes.fr/hal-01716116
Submitted on 4 Dec 2019
HAL is a multi-disciplinary open access
archive for the deposit and dissemination of
sci-entific research documents, whether they are
pub-lished or not. The documents may come from
teaching and research institutions in France or
abroad, or from public or private research centers.
L’archive ouverte pluridisciplinaire HAL, est
destinée au dépôt et à la diffusion de documents
scientifiques de niveau recherche, publiés ou non,
émanant des établissements d’enseignement et de
recherche français ou étrangers, des laboratoires
publics ou privés.
Quantitative TEM study of the precipitation
microstructure in aluminium alloy Al(MgSiCu) 6056 T6
F Delmas, Marie-José Casanove, Philippe Lours, Alain Couret, Armand
Coujou
To cite this version:
F Delmas, Marie-José Casanove, Philippe Lours, Alain Couret, Armand Coujou. Quantitative TEM
study of the precipitation microstructure in aluminium alloy Al(MgSiCu) 6056 T6. Materials Science
and Engineering: A, Elsevier, 2004, 373 (1-2), pp.80-89. �10.1016/j.msea.2003.12.068�. �hal-01716116�
Quantitative TEM study of the precipitation microstructure in
aluminium alloy Al(MgSiCu) 6056 T6
F. Delmas
a,∗, M.J. Casanove
a, P. Lours
b, A. Couret
a, A. Coujou
aaCEMES/CNRS, 29 rue Jeanne Marvig, B.P. 4347, 31055 Toulouse Cedex, France bCROMEP, Ecole des Mines d’Albi-Carmaux, Campus Jarlard, 81013 Albi Cedex 09, France
Abstract
The precipitate microstructure in the last-generation aluminium alloy 6056 T6 [AlMgSiCu] is investigated using three complementary techniques of transmission electron microscopy (TEM) with a special focus on the density and volume fraction of strengthening particles. High-resolution TEM allows the identification of the precipitates and the measurement of the precipitate sizes to be performed. Conventional TEM is used to evaluate the number of precipitates in the investigated area as well as their distribution in the matrix. In situ TEM straining, via the analysis of the dislocation slip traces, permits to determine precisely the thickness and the volume of the foil in the region where the precipitates are analysed. Taking into account the shape and the dimensions of precipitates with respect to the foil thickness, a novel methodology for measuring the volume density and the volume fraction of precipitates is proposed.
Keywords: Aluminium alloys; Precipitation hardening; Density and volume fraction; In situ straining experiments
1. Introduction
The improvement of the performances of aluminium alloys used in aeronautics, in relation to increasingly de-manding specifications, is based on a thorough control of the alloys microstructure. In the case of precipitation hard-ening alloys, the distribution, the morphology and the crys-tal structure of the strengthening particles strongly depend on the alloy composition and the thermal treatment. Alloy 6056 T6 (AlMgSi) of the last generation, with optimised composition and thermal treatment[1], shows a good com-promise in term of mechanical strength, weldability and corrosion resistance. As a consequence, this alloy is can-didate to substitute for standard 2024 alloy (AlCu) for the manufacturing of the fuselage skin of the forthcoming A380 Airbus.
In order to better understand the interaction between the precipitates and the dislocations responsible for the mechan-ical properties of the material, it is important to determine
∗Corresponding author. Tel.:+33-5-225-7870; fax: +33-5-225-7870.
E-mail address: [email protected] (F. Delmas).
parameters such as the precipitate crystal structure and chemical composition as well as the precipitate morpholo-gies. It is generally admitted that tempering results in the precipitation of intermetallic ternary or quaternary nano-metric second phase particles [2]. However, the strength-ening microstructure of AlMgSiCu alloys is still not well established crystallographically and remains matter of con-troversy, see for instance[3–6]. This is partly due to the dif-ficulties inherent to the study of the structure of such small particles. In the case of 6056 T6∗alloy corresponding to the first generation with slightly different composition and tem-pering condition than the alloy under investigation in this paper, SANS and transmission electron microscopy (TEM) studies report the precipitation of lath and needle shaped par-ticles lying along⟨1 0 0⟩ directions of the aluminium matrix
[2,7].
In this paper, focus is placed on the quantitative char-acterisation of the morphological parameters such as the precipitate mean size and the density and volume fraction of the finely distributed precipitated phase. For this, an original methodology based on various and complementary TEM techniques is developed. High resolution transmission electron microscopy (HRTEM) is used to determine the
type of the precipitated particles and the distribution of their length and cross-sections. TEM in situ straining technique coupled to conventional post-mortem microscopy allows estimating the density of precipitate. Finally, data issued from these three techniques are combined to calculate the volume fraction of precipitates.
In a next paper, this methodology is applied to study the influence of heat treatment on the microstructure of pre-cipitation and the micromechanisms of deformation in con-nection with macroscopic mechanical properties, resulting from tensile and relaxation tests.
It should be underlined that this work is a part of an industrial project which consists in analysing different ways for optimisation of 6056 alloys in term of mechanical strength and corrosion resistance.
2. Experimental details
Alloy 6056 T6 is produced by Pechiney Centre de Recherche de Voreppe in the shape of polycrystalline 6 mm thick sheets. The composition (wt.%) of the material is given in Table 1. First part of the alloy treatment consists in solutionizing at 550◦C, water quenching, and finally a tensile plastic stretching (2%). Strengthening of the alloy is then promoted by T6 temper consisting in maintaining the alloy at 190◦C during 4 h. The resultant average grain size is 30 !m.
Because of the limited achievable tilting angles of the sample holder, the analysis of precipitates by HRTEM re-quires the orientation of the investigated grain to be close to a⟨1 0 0⟩ crystal axis. To address the statistical distribution of grains and aid for choosing locations for specimen ex-traction, the crystal texture of specimens is investigated us-ing X-ray diffraction (XRD). XRD experiments reveal that the normal of the sheet shows a strong {2 0 0} preferen-tial orientation in the region close to the outer surface [8]. This texture gradually changes to{2 2 0} within the bulk of the sheet. Consequently, specimens are preferentially taken from regions close to the surface.
All MET and HRTEM photos, presented in this paper, were digitalised with Photoshop 6 software. Obtained im-ages have a mean resolution of 3 pixels/nm.
Table 1
Chemical composition (in wt.%) of aluminium alloy 6056
Mg 0.75 Si 0.93 Cu 0.60 Mn 0.63 Fe 0.10 Zn 0.15 Zr 0.03 Cr 0.03 Ti 0.04
3. Characterisation of the precipitation
3.1. Typology of precipitates
The [0 1 0] zone axis HRTEM image inFig. 1shows the precipitation microstructure in alloy 6056 T6. Only one type of precipitates is observed: they are elongated laths with long axis lying along the⟨1 0 0⟩ directions of the aluminium matrix. The precipitates are viewed “side-on” (respectively “edge-on”) when their long axis is parallel to either [1 0 0] or [0 0 1] (respectively, parallel to [0 1 0]). Note the presence of side-on precipitates (for instance C1, C2, C3) and edge-on
precipitates (for instance D1, D2, D3) inFig. 1.
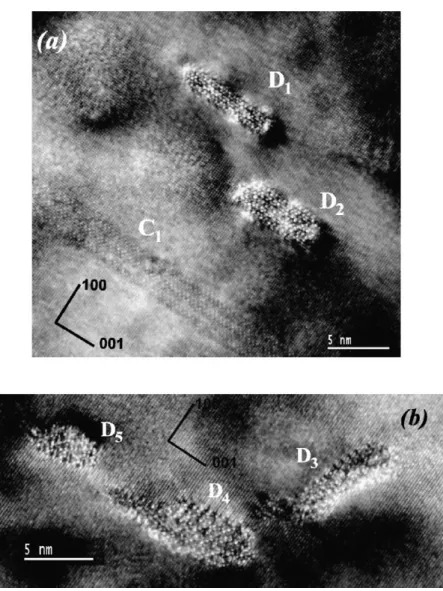
The transverse cross-sections of edge-on precipitates are shown inFig. 2. Cross-section of the laths D1 and D2are
closely rectangular with long edge perfectly straight and aligned in the [0 0 1] direction showing clear crystal pattern (Fig. 2(a)). Cross-sections of D1 and D2 are, respectively,
8.3 nm× 2 nm and 7.8 nm × 3 nm. Truncated side-on pre-cipitate C1, with long axis parallel to [0 0 1] and a thickness
of 3 nm, is also imaged in Fig. 2(a). In the [0 0 1] crystal direction, the precipitate show high coherency with the alu-minium matrix.
In Fig. 2(b), the precipitates cross-sections show much more irregular shape (D3, D4, D5) and do not exhibit clear
crystallographic pattern. This second type of precipitates represents only about 5% of the whole population and their contribution for the measurement of volume fraction can be neglected.
3.2. Spatial distribution
Fig. 3is a [1 0 0] dark-field image done by selecting, in the diffraction pattern, the superstructure diffuse lines due to the precipitated phase[2,7,9]. The low magnification of the image allows to investigate a larger volume of material and to confirm the presence of both edge-on and side-on precip-itates. The distribution of precipitates is quite homogeneous except in areas marked with dashed rectangles where there are many strings of precipitates. They have probably nucle-ated during heat treatment on residual dislocations. Typically in this material, this kind of heterogeneous precipitation re-sults in some misorientation of the precipitate cross-sections with respect to the⟨1 0 0⟩ directions of the matrix.
3.3. Precipitate cross-sections
Features of HRTEM images such as Figs. 1 and 2 are processed using Optimas software to derive the dimensional characteristics of each precipitate. Cross-sections s, major axis b and minor axis a (a < b) are measured for 300 indi-vidual edge-on particles either resulting from homogeneous or heterogeneous precipitation (values corresponding to het-erogeneous precipitation are given in brackets). Statistical data, derived from the distribution histograms of those pa-rameters, are given inTable 2. Note that the mean values
Fig. 1. [0 1 0] zone axis HRTEM image of the precipitation microstructure of 6056 T6 alloy.
of a, b and s for both distributions of precipitates are very close. As a consequence, the two types of precipitation will not be differentiated in the following. The variation of a ver-sus b plotted inFig. 4(a)shows that there is no significant correlation between the two parameters indicating that the growth mechanisms in the two directions are not interde-pendent. This is confirmed by the widely spread histogram of the distribution of a/b values inFig. 4(b): the mean value is 0.5 and the standard variance is of the order of magnitude of the spectral width.
3.4. Side-on precipitates
The observation of side-on precipitates by HRTEM im-ages such asFig. 1allows the measurement of the precipi-tate lengths L and widths l. The distribution histograms of the lengths, ranging from 10 to 193 nm with a mean value of 63 nm, and the width of the side-on precipitates are, re-spectively, given inFig. 5(a) and (b).
Table 2
Cross-sections, lengths of the major and minor axis of the precipitates seen edge on (homogeneous precipitation)
Mean value Variance Standard error Minimum value Maximum value Cross-section s (nm2) 19.6 (21.6) 14.4 (12.7) 0.8 (1.2) 0.9 (1.6) 75.5 (62.3)
Length of the major axis b (nm) 6.8 (7.2) 3.2 (2.7) 0.2 (0.3) 1.1 (1.8) 16.8 (17.8) Length of the minor axis a (nm) 3.0 (3.1) 1.2 (1.2) 0.1 (0.1) 1.0 (1.0) 7.1 (6.7) Values between brackets correspond to the precipitate strings (heterogeneous precipitation).
4. Volume density and volume fraction of precipitates
4.1. Measurement of the foil thickness
The absence of through-thickness defects such as twin boundaries or stacking fault ribbons makes the foil thickness measurement by conventional TEM very difficult. In addi-tion, usual techniques such as convergent beam microscopy or Electron Energy Loss Spectroscopy failed to give reliable results. The first technique is not useful in this type of alloy because of the too high density of precipitates which pre-vents measurement of foil thickness in the matrix and the second gives only a mean value of the thickness for a too large region of the foil[8].
So, an original method based on the TEM in situ strain-ing technique, has been developed. Samples are strained in the MET to cause dislocation motions. The occurrence of slip traces at the surfaces of the specimen induced by the dislocation motions allows the accurate calculation of the
Fig. 2. (a) and (b) HRTEM images of the precipitation microstructure of 6056 T6 alloy.
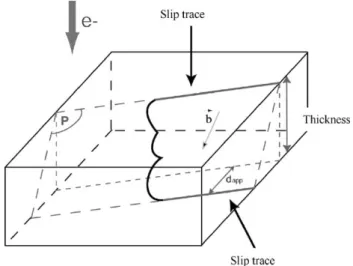
foil thickness. Indeed, by measuring the apparent distance between two slip traces on the images and taking into ac-count imaging conditions, thickness of the foil can be de-duced using simple trigonometric relationships as illustrated in Fig. 6. The relation between the apparent distance be-tween slip traces and the thickness is given by the following relation:
e= d∗app sin(α) cos(α− β)
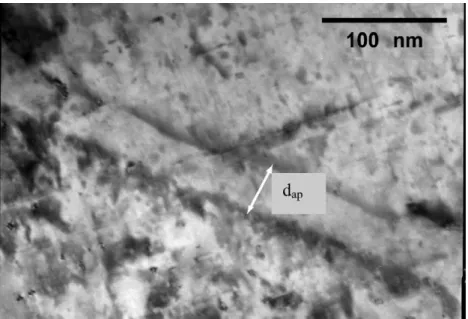
where α represents the angle between the slip plane and the sample plane and β is the tilting angle of the sample in the MET. A TEM image of an 6056 T6 sample is presented in
Fig. 7, showing an example of slip traces where a thickness measurement has been done.
The major interest of this method is that the [1 0 0] zone axis TEM images are taken for precipitates precisely located in the region where the thickness is accurately calculated. In the present paper, all measurements, precipitate counting and calculations are performed in a 50 nm thick region.
4.2. Visibility of side-on precipitates
The estimation of the volume density of precipitates requires to count the number of precipitates accurately. However, in all [0 1 0] zone axis images analysed, the num-ber of side-on precipitates is well lower than the numnum-ber of edge-on precipitates. Indeed, for a given orientation of side-on precipitates, either lying along [1 0 0] or [0 0 1], the ratio between the number of side-on and edge-on precip-itates nS/nE is always equal to 0.08. As the probability of
nucleation and early growth of precipitates is the same in the three⟨1 0 0⟩ directions, the ratio should be 1. This result indicates that not all side-on precipitates are visible in the TEM images. The discrepancy between the experimental value of nS/nEand 1 may be understood considering
visibil-ity criteria of precipitates. The visibilvisibil-ity is directly related to the dimensions of the precipitates with respect to the foil thickness through two distinct parameters:
• The precipitate thickness #e crossed by the electrons which must be high enough relatively to the foil thickness
Fig. 3. [0 1 0] zone axis dark field image of the precipitation microstructure of 6056 T6 alloy.
to result in significant beam diffraction and consequently to an image formation (relative thickness).
• The volume V′ that must be considered to count the edge-on precipitates (volume of counting) which is greater than the foil volume truly observed in TEM.
Fig. 8 is the histogram of the minor axis of the cross-sections of edge-on precipitates derived from the parameters measured and presented in Section 3.4. This distribution compared to that of the widths of side-on pre-cipitates (Fig. 5(b)) allow the determination of the minimum relative thickness of a precipitate to be visible.
Fig. 9 shows the two possible orientations of the cross-section (a × b) of side-on precipitates with either major (configuration 1) or minor (configuration 2) axis parallel to the electron beam. These two configurations are equi-probable and consequently, the width distribution of side-on precipitates should correspond, in term of mean values, extreme values and variance to the distribution of cross-section axis plotted without distinguishing a and b. This former distribution, which corresponds to the sum of lines 2 and 3 ofTable 2, ranges from 1 to 17 nm with a mean value of 5 nm very different from the statistical parameters of the width distribution (Fig. 5b). On the contrary, the distribution of width l of side-on precipitates (Fig. 5b) is statistically very close to the single distribution of the minor axis a of the edge-on precipitates (Fig. 8). This suggests that almost all side-on precipitates currently imaged in the TEM
micrographs are in configuration 1, configuration 2 being invisible.
As a consequence, the histogram of side-on precipitates width allows the determination of a visibility criterion. Indeed, only precipitates in configuration 1 with their cross-section major axis b greater than #e = 7.1 nm, cor-responding to the highest value of a measured, are visible (Table 2). For the e = 50 nm thick investigated region, this visibility criterion corresponds to a minimum relative precipitate thickness #e/e of 15%.
Over the whole measured edge-on precipitates, only 40% have a cross-section major axis greater than 7.5 nm. In ad-dition, configuration 1 being equi-probable to configuration 2, only 20% of precipitates are visible side-on for a given ⟨1 0 0⟩ orientation of precipitates.
Fig. 10 presents various situations for edge-on precip-itates within a foil with surface S and thickness e, and corresponding visibility criterion #e. Precipitates, assumed to have all the same length L, are located in the foil using their centre of gravity. Precipitates A and B with length included in the foil greater than #e are both visible in TEM though B has its centre of gravity out of the foil. Precipitates C, intercepting the foil over a length smaller than #e is invisible as well as D corresponding to the limit case where the particle loses contact with the foil. According to these considerations, visible edge-on precipitates are included in a volume V′ = Se′ where e′ = e + 2(L/2) − 2#e greater than the volume truly observed V = Se. With the
experi-Fig. 4. (a) Plot of minor axis a vs. major axis b of cross-sections of precipitates and (b) histogram of the ration a/b.
mental values e= 50 nm, #e = 0.15e and L = 63 nm, one obtains e′ = 98 nm. The volume of counting for edge-on precipitates V′= Se′is about two times larger than the
vol-ume of counting V = Se for side-on precipitates resulting in a number of side-on precipitates two times lower.
The combination of the effect of #e and V′ shows that the visible side-on precipitates of a given⟨1 0 0⟩ orientation represent only 10% of the total number of edge-on precip-itates in fairly good agreement with the experimental value of 8%.
4.3. Volume density
The volume density is estimated from TEM micrographs such asFig. 3. The volume of counting V′is derived from the measurement of the foil thickness and the dimensions of the precipitates as indicated in the previous section. In
Fig. 3, both edge-on and side-on precipitates lying along the⟨1 0 0⟩ directions of the matrix are present. According to the definition of the volume of counting, only the edge-on precipitates must be considered to calculate the volume den-sity. Assuming an isotropic distribution of particles along
Fig. 5. Histograms of distribution of lengths (a) and widths (b) of pre-cipitates.
the three⟨0 0 1⟩ directions, the total number of precipitates
N is consequently three times the number of edge-on
precip-itates. The volume density of precipitates N/V′, calculated from several TEM images, is about 2.8× 1016cm−3.
Fig. 6. Schematic showing the methodology of samples thickness mea-surement.
Fig. 7. Example of dark field image of slip traces allowing measurement of foil thickness.
Fig. 8. Histogram of the minor axis of the cross-sections of edge-on precipitates.
Fig. 9. Two possible orientations of the cross-section of side-on precipitates with either major (configuration 1) or minor (configuration 2) axis parallel to the electron beam.
4.4. Volume fraction
The calculation of the volume fraction of precipitates re-quires the knowledge of the volume of precipitates. Unfor-tunately, TEM does not permit to image simultaneously the section and the length of a precipitate. However, those tech-niques allow the determination of the histograms of sections of edge-on precipitates and lengths and width of side-on precipitates independently and with a good accuracy. From these data, statistical approaches can serve to the calculation of the volume fraction.
A first method (method 1) consists in estimating a mean volume using the mean values of the section ¯S and the length ¯L ¯V1= ¯S ¯L = 1 nSnL nS ! n=1 Si nL ! n=1 Li
with nS and nL the number of precipitates for which the
section or the length has been measured, respectively. A second way to calculate the volume fraction is the sta-tistical “boustrap” method [10] (method 2). Amongst the experimental values reported in the histograms, a section
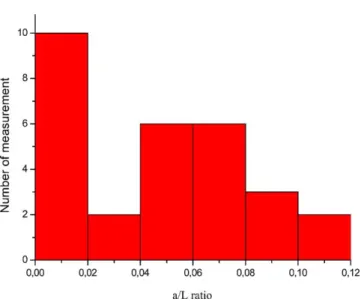
Fig. 11. Histogram of a/L.
Si and a length Li are selected at random with a
proba-bility dependent on the shape of the histogram. However, this method does not take into account the relationship be-tween the length a of the minor axis of the section and the length L of the precipitates. As discussed in Section 4.2, the width of side-on precipitates l corresponds to the minor axis of edge-on precipitates a. Consequently, the histogram of a/L may be plotted from the measurement of the widths and lengths of side-on precipitates (Fig. 11). The histogram shows that a is between 1 and 11% of the length L. As a consequence, the method has been refined to force the com-puter program used for the calculation to select only couples (Si, Li) that do occur experimentally. For a given Si,
asso-ciated to a certain ai, a value Lidis derived at random from
the histogram of the aspect ratio a/L. The mean volume ob-tained by this method is defined by:
¯V2= 1 N N ! j=1 Vj with ¯Vj= 1n n ! i=1 SiLid
Vjis the mean volume for n couples (Si, Li) of a given draw
and V2is the mean values for all N draws. The calculation
was performed for n = 200. For the boustrap method, a satisfactory convergence is obtained for N > 5000. Results of mean volumes (V1 and V2) and volume fractions Fvare
given inTable 3.
The two methods lead to very similar results. However, method 2 is beneficial as it allows the calculation of the volume of each precipitate, data that cannot be straightfor-wardly measured experimentally.
Table 3
Mean volumes and volume fractions (see text for details)
Method Mean volume Fv (%)
1 ¯V1= 1323 nm3 3.7
2 ¯V2= 1423 nm3 4.0
5. Discussion
In the present paper, the precipitation microstructure in aluminium alloy 6056 T6 of the last generation has been studied. In particular, a new method for the quantitative analysis of the precipitation microstructure based on the combined use of three electron microscopy techniques pro-viding complementary information, has been developed. In the first section of this part, the method of precipitates counting will be discussed with a special attention to its originalities and to the associated experimental uncertain-ties. In the two following sections, the question of the influence of thermal treatment on the precipitation and that of the correlation between microstructural precipitation and dislocation behaviour will be successively addressed.
5.1. Method of precipitates counting
Concerning the quantitative analysis of microstructural precipitation, similar methods have been developed for the case of Nickel-based superalloys containing spherical pre-cipitates [11–13]. In this former case, particular attention was paid to take into account both the precipitate diame-ters and the thickness of the thin foil. In the present work, improved measurement of the foil thickness using data de-rived from in situ straining experiments, more accurate at least for the case of aluminium alloys, has been carried out. Additional difficulties have raised from the lath shape of precipitates, whose length is of the order of magnitude of the thin foil thickness. This lath shape indeed yields to the impossibility of measuring all the precipitate dimensions by one technique alone applied to a single precipitate. Con-sequently, precipitates cross-sections and lengths are, re-spectively, measured on HREM micrographs and dark field images. Introducing statistical methods has cleared up this first difficulty with the aim to have an estimation of the pre-cipitate volumes. New corrective methods have been subse-quently introduced to take into account that the precipitate length is of the order of magnitude of the foil thickness.
The density and volume fraction of precipitates is fi-nally calculated, taking into account their morphology and visibility, which leads to more accurate results than those previously reported in the literature[2,7]. The experimental evaluation of the above parameters still suffers some un-certainties. The uncertainty on the measurement of the foil thickness, about 1%, is majored to 5% because of the thick-ness fluctuation in a given investigated zone. In any case, it remains lower than 10% estimated for EELS measurements by Myhr et al.[14]. The absolute uncertainty on the dimen-sion of a precipitate imaged in HRTEM is of the order of magnitude of the inter-atomic distance. Added to the effect of the binarization of the TEM images (3 pixels/nm), this leads to a relative uncertainty of 6 and 2%, respectively, for the widths and the lengths. Finally, the exhaustive count-ing of precipitates is also subject to some approximation, estimated to 8%, due to the difficulty to image and thus to
Table 4
Comparison of the microstructure features of 6056 T6∗and 6056 T6 alloys
Alloy Ageing Density (×1016cm−3) Length (nm) Shape Section (nm2) F v(%)
Duration (h) T (◦C) teq (×10−15h)
6056 T6∗ 8 175 5.5 5.1 66 Needles 7 2.5
Lath 6.5
6056 T6 4 190 8.5 2.8 63 Laths 21 3.7
number the most little edge-on particles. All together, the relative uncertainty on the volume density is about 15%.
5.2. Influence of thermal treatments on the microstructural precipitation
According to literature, the morphology of precipitates obviously depends on their structure [4]: needle or rod shaped particles correspond to a metastable ternary phase "′ or "′′ while laths correspond to the quaternary phase
Q′ (AlMgSiCu) precursor of the stable Q phase. Caron
[15–17] reports the presence of laths with either unclear or clear crystal patterns corresponding, respectively, to the hexagonal phases QP and QC, precursor of Q′ and stable Q phases. By analogy, the experimental observations in 6056T6 presented here suggest that the microstructure of precipitation is essentially quaternary and the population of precipitates is composed of QP, QC and Q′ particles.
Table 4 summarizes a comparison between the present results and those obtained previously in a 6056 T6∗ of the first generation [2,7,9]. The two alloys differ just by the temperature and the duration of the ageing, which is longer but performed at a lower temperature in the first generation of alloy. This difference is quantified by the equivalent time teqintroduced by Shercliff and Ashby[18]
teq=t exp
" −Q
RT
#
where t is the duration of the ageing, Q= 130 mJ/m2is the
self-diffusion energy and R is the ideal gas constant. In first generation 6056 T6∗ alloy, it has been observed as well these two types of precipitate with average lengths 60 nm and average cross-sections 7 nm2[2,7,9]. In the 6056 T6 alloy investigated here, only lath shaped precipitates are observed with similar length but higher cross-sections (20 nm2). This change can be explained by either the non-formation of needle precipitates at 190◦C, or by their dissolution during ageing. According to Cayron’s results in 6061 T6 alloy (175◦C per 8 h) [15–17], showing that no change in precipitate size occurs following 600 h long-term exposure at 175◦C, it is assumed that temperature plays the most important role in precipitate growth.
Concerning precipitate dimensions, the major difference is a strong increase of precipitate cross-section with the increase of the equivalent time whereas the length is not affected. This suggests that the growth processes are not
identical along the three⟨0 0 1⟩ directions of the aluminium matrix, probably because of different interface structures. Consistently with this growth mechanisms, the precipi-tate density decreases by a factor of 2 as the result of an Ostwald-like ripening process. Note also the increase of the volume fraction from 2.5 to 3.7%, indicating that additional atoms previously in solid solution and/or in Guinier-Preston zones are involved.
Also remarkable in the alloy is the occurrence of hetero-geneous precipitation on residual dislocations. The misori-entation of those precipitates with respect to ⟨1 0 0⟩ matrix directions is probably due to the effect of the strain field of the dislocation during precipitate nucleation. Nevertheless, the presence of dislocations does not infer on the precipitates growth kinetics as particles of the heterogeneous and homo-geneous distributions have similar dimensions. The forma-tion of dislocaforma-tions susceptible to initiate such precipitaforma-tion is generally achieved by room temperature final rolling of sheets (skin-pass).
5.3. A few consequences of the micostructural precipitation on the dislocation behaviour
In situ straining experiments performed on the same alloys have demonstrated that precipitates are by-passed owing to the activation of cross-slip[15]. For cross-slip, the formation of elongated precipitates will offer most efficient obstacles. By the same experimental approach, it has been shown that dislocations are strongly anchored at pinning lines contain-ing series of precipitates close to each others. This effect is probably correlated to the observation of heterogeneous strings of precipitates[20].
From the observation of moving dislocations under stress, the mean distance ⟨d⟩ between pinning points anchoring effectively the dislocations was measured[13–21]in the two T6 alloys described in the previous section. InTable 5,⟨d⟩ is compared with the mean distance d111between intercepts Table 5
Comparison of the distance between precipitates for the 6056 T6∗ and 6056 T6 alloys
⟨d⟩ d111 d111/⟨d⟩
T6∗ 30 15 0.5
T6 40 30 0.75
⟨d⟩ is the mean distance between obstacles anchoring really the disloca-tions. d111is the distance between intercepts of precipitates with a{1 1 1}
of precipitates within{1 1 1} plane. As these distances are not similar, the dislocations are assumed to be not anchored on all precipitates. Table 5indicates that the ratio d111/⟨d⟩
increases with the equivalent time, namely from T6∗alloy to T6 alloy. This ratio can be seen as the fraction of precipitates efficient for anchoring of dislocations. As a conclusion, the increase of equivalent time increases the fraction of efficient precipitates but lowers the number of precipitates anchoring the dislocations, as indicated by their mean distance.
6. Conclusion
A method using three complementary TEM techniques has been developed to address statistically the spatial dis-tribution and dimension of precipitates in aluminium alloy 6056 T6. This approach permits to derive relevant experi-mental parameters of the global microstructure of precipi-tation such as the volume density and the volume fraction of precipitated particles. Such characteristics, coupled to observations of straining micro-mechanisms, are useful to describe and understand the mechanical properties of the hardening precipitation alloy. Due to the accuracy of the results obtained, this methodology seems to be a useful tool to study hardening in alloys and is currently used to investigate the influence of the tempering treatment on the microstructure of precipitation as well as deformation mechanisms of the 6056 alloy.
Acknowledgements
The authors want to thank C. Roucau for convergent beam microscopy and Y. Khin for EELS experiments. C. Cayron is acknowledged for fruitful discussions.
References
[1] R. Dif, B. Bès, J.C. Ehrström, C. Sigli, T. Warner, P. Lassince, H. Ribes, Mater. Sci. Forum 331 (2000) 1613.
[2] P. Donnadieu, F. Carsughi, A. Redja¨ımia, C. Diot, G. Lapasset, J. Appl. Cryst. 31 (1998) 212.
[3] S.D. Dumolt, D.E. Laughlin, J.C. Williams, Scripta Metall. 18 (1984) 1347.
[4] L. Sagalowicz, G. Hug, D. Bechet, P. Sainfort, G. Lapasset, in: Pro-ceedings on the 4th International Conference of Aluminum Alloys, Atlanta, vol. 1, 1994, p. 636.
[5] L. Sagalowicz, G. Lapasset, G. Hug, Philos. Mag. Lett. 74 (1996) 57.
[6] D.J. Chakrabarti, B. Cheong, D.E. Laughlin, Automotive Alloys II, TMS Annual Meeting, vol. 27, 1998.
[7] M. Vivas, Thesis, Universite Paul Sabatier de Toulouse, France, 1997.
[8] F. Delmas, Thesis, Universite Paul Sabatier de Toulouse, France, 2002.
[9] M. Tanaka, T. Warner, Mater. Sci. Forum 331 (2000) 983. [10] B. Efron, R.J. Fibshirani, An Introduction to the Boostrap, Chapman
and Hall, New York, 1993.
[11] J.W. Cahn, J. Nutting, Trans. Met. Soc. AIME 215 (1959) 526.
[12] C. Schlesier, E. Nembach, Mater. Sci. Eng. A 119 (1989) 199. [13] J.E. Hilliard, Trans. Met. Soc. AIME 224 (1962) 906.
[14] O.R. Myhr, Ø. Grong, S.J. Andersen, Acta Mater. 49 (2001) 65. [15] C. Cayron, L. Sagalowicz, O. Beffort, P.A. Buffat, Philos. Mag. A
79 (1999) 2833.
[16] C. Cayron, Thesis Ecole Polytechnique deLausanne Suisse, 2000.
[17] C. Cayron, P.A. Buffat, Acta Mater. 48 (2000) 2639. [18] H.R. Shercliff, M.F. Ashby, Acta Mater. 38 (1989) 10.
[19] F. Delmas, M. Vivas, P. Lours, M.J. Casanove, A. Couret, A. Coujou, Mater. Sci. Eng. A-Struct. Mater. Prop. A 340 (2003) 286. [20] F. Delmas, A. Couret, M.J. Casanove, A. Coujou, in: Proceedings of
the 8th International Conference on Aluminum Alloys, Cambridge, vol. 2, 2002, p. 1109.
[21] M. Vivas, P. Lours, C. Levaillant, M.J. Casanove, A. Couret, A. Coujou, in: Proceedings of the 6th International Conference on Alu-minum Alloys, Toyohashi, Japan, vol. 2, 1998, p. 943.
![Fig. 1. [0 1 0] zone axis HRTEM image of the precipitation microstructure of 6056 T6 alloy.](https://thumb-eu.123doks.com/thumbv2/123doknet/2354765.37282/4.892.236.672.139.587/fig-zone-axis-hrtem-image-precipitation-microstructure-alloy.webp)
![Fig. 3. [0 1 0] zone axis dark field image of the precipitation microstructure of 6056 T6 alloy.](https://thumb-eu.123doks.com/thumbv2/123doknet/2354765.37282/6.892.232.677.137.562/fig-zone-axis-field-image-precipitation-microstructure-alloy.webp)
![Table 4 summarizes a comparison between the present results and those obtained previously in a 6056 T6 ∗ of the first generation [2,7,9]](https://thumb-eu.123doks.com/thumbv2/123doknet/2354765.37282/10.892.468.830.1032.1094/table-summarizes-comparison-present-results-obtained-previously-generation.webp)
