HAL Id: hal-00077534
https://hal-insu.archives-ouvertes.fr/hal-00077534
Submitted on 31 May 2006
HAL is a multi-disciplinary open access
archive for the deposit and dissemination of
sci-entific research documents, whether they are
pub-lished or not. The documents may come from
teaching and research institutions in France or
abroad, or from public or private research centers.
L’archive ouverte pluridisciplinaire HAL, est
destinée au dépôt et à la diffusion de documents
scientifiques de niveau recherche, publiés ou non,
émanant des établissements d’enseignement et de
recherche français ou étrangers, des laboratoires
publics ou privés.
The effect of temperature and bulk composition on the
solution mechanism of phosphorus in peraluminous
haplogranitic magma.
B. O. Mysen, François Holtz, Michel Pichavant, Jean-Michel Bény, J.M.
Montel
To cite this version:
B. O. Mysen, François Holtz, Michel Pichavant, Jean-Michel Bény, J.M. Montel. The effect of
temper-ature and bulk composition on the solution mechanism of phosphorus in peraluminous haplogranitic
magma.. American Mineralogist, Mineralogical Society of America, 1999, 84, pp.1336-1345.
�hal-00077534�
American Mineralogist, Volume 84, pages 1336–1345, 1999
0003-004X/99/0009–1336$05.00 1336
The effect of temperature and bulk composition on the solution mechanism of phosphorus
in peraluminous haplogranitic magma
B.O. M
YSEN,
1,* F. H
OLTZ,
2,† M. P
ICHAVANT,
2J.-M. B
ENY,
2ANDJ.-M. M
ONTEL31Geophysical Laboratory and Center for High Pressure Research, Carnegie Institution of Washington, 5251 Broad Branch Road, N.W., Washington, D.C. 20015, U.S.A.
2CRSCM-CNRS, 1a, rue de la Ferollerie, 45071 Orleans, France
3Department de Geologie, URA 10 du CNRS, Universite Blaise Pascal, 5 rue Kessler, 63038 Clermont-Ferrand, France
INTRODUCTION
Phosphorus in igneous rocks is important for at least two main reasons. First, in the concentration range in natural mag-mas (<2–3 wt% P2O5), phosphorus strongly modifies both
physical and chemical properties of the magmatic system. These properties include melt viscosity (Dingwell et al. 1993; Toplis et al. 1994), liquidus phase relations (Wyllie and Tuttle 1964; Kushiro 1975; Ryerson 1985; London et al. 1993), redox equi-libria of iron (e.g., Mysen 1992; Gwinn and Hess 1993; Toplis et al. 1994), and element partitioning (Watson 1976). Second, phosphate minerals (e.g., apatite and monazite) in some cases are abundant in highly evolved igneous systems (e.g., Pichavant et al. 1987; London 1987; London et al. 1990). Such minerals in equilibrium with a P-bearing magma can alter the trace-ele-ment patterns of the magma significantly without much im-pact on its major element composition (e.g., Watson 1980; Green and Watson 1982; Ghazot et al. 1996). Consequently, phosphorus solution mechanisms and their relations to satura-tion of phosphate minerals in aluminosilicate melts require characterization.
To characterize the behavior of P-bearing magmas and the crystallization behavior of phosphate minerals from such mag-mas, data on solubility and solubility mechanisms of P in the magmatic liquid are required. For subaluminous (A/CNK = 1) and peraluminous (A/CNK>1)glass, it has been suggested that the speciation of P is dominated by the presence of AlPO4-like
units (Mysen et al. 1981; Kosinski et al. 1988; Dupree et al.
ABSTRACT
Solution mechanisms of P in peraluminous glasses and melts in the system CaO-Na2O-K2O-Al2O3
-SiO2-P2O5 have been examined with in-situ microRaman spectroscopy from ambient temperature to
near 1200 °C. The principal aim was to examine the relative stabilities of phosphate complexes as functions of P content, peraluminosity, and temperature. Increasing peraluminosity was accomplished by increasing the proportions of Al3+ and Ca2+ of constant SiO
2 content. The molar ratio Al2O3/
(CaO+Na2O+K2O) (A/CNK) ranged from ~1 to ~1.3.
In all compositions, P5+ is bonded to Al3+ to form AlPO
4 complexes. In addition, there is evidence
for pyrophosphate complexing (P2O7). In melts with the highest (Ca+Na+K)/P, there is probably also
a small fraction of orthophosphate complexes present. The relative importance of AlPO4-like
com-plexes is correlated positively with peraluminosity (A/CNK), P2O5 content, and increasing
tempera-ture at temperatempera-tures above that of the glass transition. These structural relationships among phosphate complexes are coupled with decreasing polymerization of the aluminosilicate melts.
1989; Gan and Hess 1992; Toplis and Dingwell 1996; Mysen et al. 1997; Toplis and Schaller 1998). Complexing of P5+ with
Al3+ in peraluminous aluminosilicate melts would account for
the strong increase of apatite solubility with increasing A/CNK found experimentally (Pichavant et al. 1992; Wolf and London 1994). Formation of such Al-rich phosphate complexes in melts might also help explain the expansion of the quartz liquidus volume relative to that of feldspar in haplogranite systems (Lon-don et al. 1993).
These studies were, however, conducted on glasses at am-bient temperature. The application of these structural data to that of their melt relies on assumptions of structural similarity between a melt and its glass. Recent data on melts in the sys-tem Na2O-Al2O3-SiO2-P2O5 have demonstrated, however, that
phosphate and silicate speciation changes rapidly with increas-ing temperature across the glass transition (Mysen 1996, 1998a). Therefore, to provide structural data on melts obtained in-situ at magmatic temperatures, we present here Raman spec-troscopic data on the solution mechanisms of P2O5 in
peraluminous melts in the system SiO2-Al2O3-Na2O-K2
O-CaO-P2O5 from room temperature to those above their liquidii. Data
are reported for two series of melts, one with Ca/P = 5/3 (i.e., same as in apatite) and the other with Ca/P = 1, which enables us to test the possibility that P coordinates preferentially with Ca rather than with Al.
EXPERIMENTALMETHODS
Starting composition glasses (Table 1) were from the same batches as those for which Mysen et al. (1997) reported struc-tural information of H2O-free and H2O-bearing glasses at 25 °C.
Details of starting glass preparation and chemical analysis are *E-mail: [email protected]
†Now at: Institute of Mineralogie, University of Hannover, Welfengarten 1, D-30167 Hannover, Germany.
given in that paper and will not be repeated here. Composition-ally, the two series of glasses evolve with concurrent increases in A/CNK and P2O5 content from the P-free, near-metaluminous
compositions (sample nos. 244 and 248; Table 1) to the most P-rich and peraluminous compositions (sample nos. 247 and 251: Table 1) (see also Fig. 1a). Under the assumption that any Al3+ in excess over that electrically charge-balanced in
four-fold coordination acts as a network-modifier, increasing peraluminosity (increasing A/CNK and P2O5) would also
re-sult in increasing depolymerization of the glasses and melts (Fig. 1b).1
Raman spectra were recorded with a Dilor XY confocal microRaman spectrometer equipped with a cryogenic Wright Model CCD 05-11-0-202 charge-coupled detector (CCD). The excitation source was the 514 nm line of a Coherent Innova Model 90-5 Ar+ laser operating at several hundred milliwatts at
the sample. Integration times ranged from 60 to 300 s. A glass chip weighing ~1 mg was melted onto a micro-heater used for the high-temperature Raman spectroscopic experiments (Mysen and Frantz 1992, 1993). The temperature precision is ±4 °C, and the uncertainty 5–10 °C (Mysen and Frantz 1992; Richet et al. 1994). After an experiment, the glass was removed from the heater by placing the heater with the glass sample in HF. In this process, the glass is dissolved without destroying the microheater itself.
The original starting glasses were the hydrated samples used by Mysen et al. (1997). These samples were dehydrated with the microheater before high-temperature experiments by heat-ing them to >1000 °C for several minutes followed by tem-perature-quenching to glass. The anhydrous nature of these glasses was ascertained by recording spectra in the 3600 cm–1
range, which covers the range of OH stretching vibrations.
Following the dehydration procedure, for each composition, this material was then subjected immediately to high-tempera-ture Raman spectroscopy. A spectrum of glass at 25 °C was taken first. The sample was then brought to the highest tem-perature to start a series of high-temtem-perature spectroscopic ex-periments. The temperature was then lowered and the next spectrum was acquired. Each series of experiments was fin-ished by taking another spectrum of the glass at 25 °C.
Because the sample after a series of high-temperature Raman experiments cannot be removed from the microheater for chemi-cal analysis without destruction of the heater itself, the compo-sition of glasses after an experiment could not be determined directly. Instead, Raman spectra of glasses before and after an experiment were compared as described by Mysen (1996). TABLE 1. Composition of starting materials (wt%)*
244 245 246 247 248 249 250 251 SiO2 75.97 75.79 74.89 75.05 75.69 75.92 75.56 75.48 Al2O3 13.88 14.21 14.48 15.11 13.93 14.04 14.06 14.31 CaO 0.21 1.46 2.90 3.32 0.09 0.88 1.63 2.33 Na2O 3.92 2.96 2.19 1.62 3.92 3.16 2.64 1.99 K2O 5.89 4.47 3.28 2.34 6.22 4.92 3.88 3.03 P2O5 0.13 1.11 2.27 2.55 0.15 1.08 2.24 2.86 A/CNK 1.07 1.15 1.17 1.34 1.05 1.16 1.22 1.33 * The samples were synthesized under water-saturated conditions at 0.4-0.8 GPa as described in Mysen et al (1997). These were subse-quently dehydrated after loading onto the microheater used for high-temperature experiments. In the table, the compositions have been recalculated to 100 % ( anhydrous) The original electron microprobe analyses data are given in Mysen et al. (1997).
1Al3+ without charge-balance in tetrahedral coordination has
been suggested to form tri-clusters where Al3+ actually also has
four oxygen ligands (Lacey 1963). Recently, it has also been suggested that in peraluminous melts, Al3+ may reside in
struc-tural entities involving fourfold, fivefold, and sixfold coordi-nation with oxygen (Sato et al. 1991; Poe et al. 1992). For the present purposes, it is not necessary to know the exact struc-tural position of Al in peraluminous melts other than the fact that the Al is not a part of the aluminosilicate glass and melt network.
FIGURE 1. Relationships between weight percent of P2O5, peraluminosity (A/CNK) (a) and calculated NBO/T (b) of the starting materials. In b, the NBO/T calculations were conducted under the assumption that any Al3+ in excess of that for which alkalis and alkaline earths are available for electrical charge-balance of Al in tetrahedral coordination is a network-modifier. Filled symbols denote the NBO/T calculated without consideration of excess Al3+ associated with P. Open symbols denote the NBO/T calculated with all P associated with Al3+ as AlPO4 complexes. Only Al excess over (Na+K+2Ca+P) is considered a network-modifier.
MYSEN ET AL.: P IN PERALUMINOUS MELTS 1338
The samples were monitored microscopically throughout each series of high-temperature experiments (600× magnifica-tion). Nucleation and growth of bubbles or crystals would be observed immediately, but no such behavior occurred over the time scale of the experiments (60–120 minutes per series of high-temperature runs). The apatite saturation temperatures for these samples range between 750 and 800 °C (Pichavant et al. 1992). Therefore, in the lower-temperatures experiments, apa-tite would crystallize if sufficient time were provided to pro-mote the onset of nucleation and growth. As no crystal formation was observed, that time is clearly longer than those of the ex-periments conducted here.
The raw Raman data were corrected for background as well as for temperature- and frequency-dependent scattering inten-sity (Fig. 2). In this procedure, the intensities first were con-verted to percent relative to the most intense data point in the spectrum followed by fitting an exponential background through portions of the spectra with no Raman intensity (Fig. 2a). This spectrum was then corrected for frequency- and temperature-dependent scattering intensity (Long 1977; Mysen et al. 1982), and these data were recalculated to percent relative to the most intense point in the corrected spectra. An example of a result-ing spectrum is shown in Fig. 2b. It has been suggested that higher-order Raman scattering may contribute a few percent intensity to spectra of silicate and aluminosilicate melts at magmatic temperatures (e.g., Daniel et al. 1995; McMillan et al. 1994). However, within the several percent background scat-ter in the present data, there is no evidence for higher-order Raman bands.
RESULTS
Spectroscopic data
Raman spectra taken in-situ at the temperatures indicated on each spectrum are shown in Figure 3 (identified by sample number and corresponding P2O5 content in weight percent).
These spectra, resembling those of other highly polymerized aluminosilicate glasses and melts (e.g., McMillan et al. 1982; Seifert et al. 1982; Daniel et al. 1995; Neuville and Mysen 1996), show distinct intensity features in a low-frequency re-gion between ~200 and ~650 cm–1, an intermediate region
cen-tered near 800 cm–1, and a high-frequency region between ~800
and ~1300 cm–1.
The low-frequency region is centered near 500 cm–1, with an
asymmetry toward lower frequency and with one or more weaker peaks or shoulders near 600 cm–1. Most of the intensity in this
region can be assigned to vibrations within the three-imensionally interconnected (Si,Al)-O network (e.g., Daniel et al. 1995). The high-frequency portion of the spectra (~800 – ~1300 cm–1)
cov-ers the range that includes vibrations assigned to both (Si,Al)-O, P-O, and possible Al-O-P and Si-O-P vibrations.
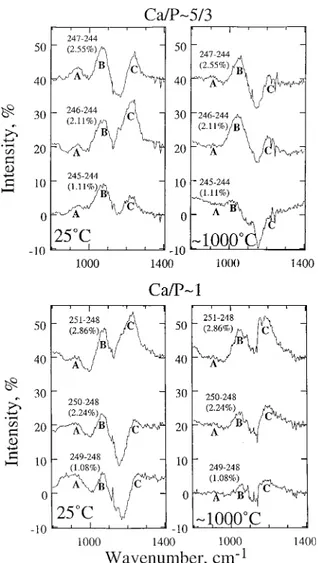
To extract more detailed information on the effect of tempera-ture in the high-frequency region, spectra of P-bearing samples were subtracted from those of samples having no phosphorus (Fig. 4). These difference spectra were then used as a guide in curve-fitting the high-frequency region, a few examples of which are shown in Figure 5 (where bands that are shaded are those that do not occur in spectra of P-free glasses and melts).2
The difference spectra (Fig. 4) show three regions of inter-est. Both the Ca/P~5/3 and Ca/P~1 glass spectra exhibit a dis-tinct intensity increase (compared with the spectra of P-free glass, no. 244 and 248) at or slightly below 1000 cm–1 (region
A). This intensity appears to diminish or disappear, however, as the glasses are transformed to melts (see the ~1000 °C
spec-FIGURE 2. Background subtraction procedure with a spectrum of sample 251 at ~1000 °C used as example. (a) Raw Raman data with fitted background shown as dotted line. Dark zones denote regions through which the background was fitted to an exponential function. (b) Spectrum resulting from subtraction of the background followed by correction for temperature- and frequency-dependent Raman intensity.
2The spectra were fitted to Gaussian lines with the commercial
data manipulation program Igor from Wavemetrics. The deconvolution procedure was conducted subsequent to correc-tion for temperature- and frequency-dependent Raman scatter-ing (e.g., Long 1977).
FIGURE 3. Unpolarized Raman spectra at temperatures indicated on the panels. The spectra are corrected for temperature- and frequency-dependent scattering intensity as illustrated in Figure 2. Sample numbers are indicated in parentheses. Percent values denote weight percent of P2O5 from Table 1. Each spectrum is offset vertically for clarity.
MYSEN ET AL.: P IN PERALUMINOUS MELTS 1340
FIGURE 4. Difference Raman spectra at 25 °C (glass) and 1000 °C (liquid) of samples as indicated. Percent values in parentheses denote weight percent of P2O5 from Table 1. Each spectrum is offset vertically for clarity.
tra in Fig. 4). The spectra of all glasses and melts display a pronounced intensity increase between 1050 and 1080 cm–1
(region B; Fig. 4) an intensity increase that is positively corre-lated with P-content (and A/CNK). Finally, there is a distinct intensity increase in the glass spectra near 1250 cm–1, an
inten-sity that increases with increasing P-content (and A/CNK) (Re-gion C). This intensity is noticeably weaker in the spectra of melts, and more so in the melt spectra of the Ca/P~5/3 series of compositions than in the spectra of melts from the Ca/P~1 se-ries of compositions.
In the curve-fitted spectra of melts and glasses (Fig. 5 shows examples at 25 °C and ~1070 °C), the P-free samples (Fig. 5a and 5b) can be fitted for five Gaussian bands (although one near 900 cm–1 is normally so weak that its inclusion could not always
be justified on statistical grounds). The spectra of the Ca/P~5/3 series were fitted to seven bands and those of the Ca/P~1 series of compositions to six bands (Fig. 5c, 5d, 5f, and 5g).
In the spectra of P-free glasses, the five bands in the high-frequency region occur near 795, 905, 1060, 1150, and 1200 cm–1 at 25 °C, and shift to lower frequencies with increasing
temperature at a rate of ≤10–2 cm–1/°C. These
temperatude-pendent frequency-shifts are within the range commonly re-ported for (Si,Al)-O stretching vibrations in silicate glasses and crystals (e.g., McMillan et al. 1992; Mysen and Frantz 1993; Richet et al. 1994).
In the P-bearing glasses, the bands in the high-frequency re-gion are near 800, 900, 950, 995, 1070, 1120, and 1150 cm–1 in
the Ca/P~5/3 series at 25 °C. In the Ca/P~1 series, the band near 950 cm–1 is not observed. The temperature-dependent
fre-quency shifts of the high-frefre-quency bands of P-bearing glasses (Fig. 6) resemble those of the P-free glasses. An exception is the band near 1070 cm–1 for which 1/ν
o(∂ν/∂T) ~ –0.5·10–5/K
(where ν is frequency and T is temperature). In the spectra of P-free glasses and melts, 1/νo(∂ν/∂T) ~–8·10–5/K for the band
in this frequency region.
Band assignments
The spectra of the P-free glasses and melts closely resemble those of other nearly or fully polymerized aluminosilicate ma-terials (e.g., McMillan et al. 1982; Seifert et al. 1982; Daniel et al. 1995; Neuville and Mysen 1996). The bands in the 900– 1200 cm–1 region are assigned to (Si,Al)-O stretching within
the three-dimensional network in accord with previous assign-ments (Seifert et al. 1982). The 800 cm–1 is assigned to in-cage
oxygen motion in this network (e.g., McMillan et al. 1992). The bands in the low-frequency region are assigned to (Si,Al)-O-(Si,Al) rocking motions (e.g., Phillips, 1984).
The highest-frequency band, near 1150 cm–1, is assigned to
(Si,Al)-O° in a fully polymerized (Si,Al)-O network by anal-ogy with assignments of the bands in spectra of glasses along the join SiO2-NaAlO2 (e.g., Seifert et al. 1982). The band near
1070 cm–1 corresponds to the intensity increase in region B in
Figure 4. The assignment of this band is somewhat uncertain. It occurs at a frequency similar to the band near 1060 cm–1 in
the P-free glasses and melts. This band, however, is consider-ably more intense in the P-bearing samples (e.g., Fig. 5). Fur-ther, its 1/νo(∂ν/∂T) value is about an order of magnitude less
than for the ~1060 cm–1 band in the spectra of P-free materials.
The value of 1/νo(∂ν/∂T) for the ~1070 cm–1 band in spectra of
P-bearing glasses and melts does, however, resemble that of a band at similar frequency in depolymerized Na2O-Al2O3-SiO2
glasses and melts. In the spectra of those materials, the ~1070 cm–1 band was assigned to (Si,Al)-O– stretching in Q3-type
struc-tural units (Mysen 1995). Furthermore, relative to the intensity of the 1150 cm–1 band, its integrated intensity is correlated
posi-tively with peraluminosity (A/CNK) and total phosphorus con-tent (Fig. 7) suggesting, therefore, that it stems from vibrations associated with structural features in the melts due to those compositional factors. In light of these observations, it is sug-gested that the band fitted near 1070 cm–1 in the spectra of
P-bearing glasses and melts is dominantly that of a vibration assigned to (Si,Al)-O– stretching (nonbridging oxygen) in Q3
structural units. It is possible, however, that the band as fitted also incorporates some intensity resulting from the presence of three-dimensionally interconnected structural units in the melts
FIGURE 5. Examples of curve-fitted Raman spectra and glasses and melts in the high-frequency portion of the spectra. Shaded bands are those found only in samples that contain P. The bands identified with numbers (approximate frequency) are those that occur in spectra of both P-free and P-bearing samples. (a and b) Spectra of glass and melt of P-free composition 244. (c and d) Spectra of glasses at 25 °C of samples 247 and 251, respectively. (e) Difference spectrum showing the result of spectrum D subtracted from spectrum C. The intensity difference refers to the percentage intensities in spectra C and D. (f and g) Spectra of melts at 1070 °C for samples 247 and 251, respectively. (h) Difference spectrum showing the result of spectrum G subtracted from spectrum F. The intensity difference refers to the percentage intensities in spectra F and G.
MYSEN ET AL.: P IN PERALUMINOUS MELTS 1342
FIGURE 7. Ratio of integrated intensity (area) of 1070 and 1150 cm-1 bands in glasses and melts as a function of temperature. Percent values denote weight percent of P2O5 in the sample. Shaded region (Glass Transition?) represents temperature range within which the glass transition temperatures for these compositions most likely would be found (see text for detailed discussion).
and glasses. That possibility cannot be resolved within the er-rors of the deconvolution procedure.
The bands near 950, 1000, and 1120 cm–1 (shaded in the
examples in Fig. 5) occur only in spectra of P-bearing samples. Among these, the 950 cm–1 band occurs only in spectra from
samples of the Ca/P ~5/3 series, but even in those spectra, its intensity is uniformly the lowest of the three (its integrated in-tensity is 1–3% of that of the total inin-tensity of the three bands). Assignments of bands associated with O vibrations in P-bearing aluminosilicate glasses have been summarized by Gan and Hess (1992). In assigning the bands due to dissolved phos-phorus in the present spectra, the assignments of Gan and Hess (1992) will be followed for the most part because their assign-ments were supported by 31P NMR data, and those assignments
also were consistent with available vibrational spectroscopic and NMR data (Gan and Hess 1992 and references therein). A more detailed 31P NMR study was published recently by Toplis
and Schaller (1998). Their data and those of Gan and Hess (1992) are in general agreement. The band near 950 cm–1 at 25
°C (lower frequency at higher temperatures) is assigned to P-O stretching in orthophosphate units (PO4). The band near 1000
cm–1 at 25 °C (and again the frequency decreases with
increas-ing temperature) is assigned to P-O stretchincreas-ing in pyrophosphate units (P2O7), and that one near 1120 cm–1 is probably due to
P-O stretching in units that may resemble three-dimensionally interconnected structure of berlinite (AlPO4).
DISCUSSION
From the assignments above, AlPO4 complexing is an
im-portant part of the P solution mechanism in peraluminous alu-minosilicate melts, a conclusion also consistent with other studies of P solution mechanisms in peraluminous alumino-silicate glasses (e.g., Reynard and Toplis 1997; Mysen et al. 1997; Mysen 1998a; Toplis and Schaller 1998). Positive corre-lation between the proportion of excess Al3+ (increasing
A/CNK-value above 1) and apatite solubility in aluminosilicate melts (Pichavant et al. 1992; Wolf and London 1994) is also consis-tent with this simple solution model.
FIGURE 6. Example of temperature-dependence of Raman bands in the high-frequency envelope. Sample 249 (1.08 wt% P2O5) is used as an example. Closed symbols denote bands found only in samples that contain phosphorus. Open symbols denote bands found in all samples. The lines are results of least-squares regression through the data.
An additional complexity to this model was introduced by Mysen et al. (1997) based on Raman spectra obtained at 25 °C on the same glasses as those used for starting materials in the present study. They suggested that the band near 1250 cm–1
might be due to P-O-Si cross-linking in a P-bearing alumino-silicate network. This band is also inferred to be present in the spectra of 25 °C glass reported here (see region marked C in the difference spectra in Fig. 5). However, the intensity of this band diminishes rapidly with increasing temperature and is insignificant or absent in spectra of high-temperature melts. Evidently, if there is Si-O-P cross-linking in the glasses, spec-troscopic evidence for those cross-linkages cannot be discerned in the high-temperature, peraluminous silicate melts.
In the present high-temperature study, there is also evidence for pyro- and orthophosphate complexes in addition to the Al-phosphate complex similar to those found in peralkaline, metaluminous, and peraluminous melts and glasses in the sys-tem Na2O-Al2O3-SiO2-P2O5 (Mysen 1998a). Those conclusions
were further supported by 31P NMR data on the glasses in that
study (Cody and Mysen, unpublished). Pyrophosphate (P2O74–)
appears in all compositions and at all temperatures, whereas evidence for orthophosphate (PO43–) is only found for materials
in the Ca/P~5/3 series. In other words, the series of composi-tions with the highest (Ca+Na+K)/P show a wider range in types of phosphate complexing.
Even in the Ca/P~5/3 composition series, the integrated in-tensity of the 950 cm–1 band assigned to P-O stretching in PO
4 3–
represents <3% of the total integrated intensity of P-O stretch bands. Because the Raman cross-sections for these vibrations are not known, these integrated intensities cannot be trans-formed quantitatively to abundance of the individual species. However, if the relative values of the cross sections for Si-O vibrations in analogous silicates can be taken as a guide (see for example, Mysen 1995), the Raman cross-sections for P-O stretching increase as the phosphate complex becomes less polymerized. Therefore, the intensity ratio of the 950 cm–1 band
relative to the sum of integrated intensities of the 950, 1000, and 1120 cm–1 band would be a maximum value for the relative
abundance of orthophosphate complexes. The relative abun-dance of PO43– units in the Ca/P~5/3 series of compositions does
not exceed ~3% of the total abundance of phosphate complexes in the melts and glasses.
The intensity of the 950 cm–1 band is also so low that
varia-tions in integrated intensities with temperature are buried in the scatter of the data and, therefore will not be considered further. There are, however, systematic relationships between the integrated intensities of the ~1000 cm–1 band (P-O
stretch-ing in P2O74– complexes) and those of the ~1120 cm–1 band
(P-O stretching in three-dimensionally interconnected AlP(P-O4
complexes). This ratio, A1000/(A1000+A1120), is correlated
nega-tively with total P2O5 content at any temperature (Fig. 8). This
correlation leads to the suggestion of decreasing relative abun-dance of P2O74– complexes in the melts as they become more
aluminous.
The formation of P2O74– and AlPO4 complexes can be
ac-complished via interaction between Al3+ in the aluminosilicate
network (AlO2)3 and dissolved P2O5:
4AlO2 + 3P2O5↔ P2O7 + 4AlPO4. (1)
Equation 1 is conceptually similar to that proposed by Toplis and Dingwell (1996) based on structural interpretation of melt viscosity data, although they proposed such a mechanism to form meta-(PO3) rather than pyrophosphate (P2O7). The
solu-tion mechanism illustrated with Equasolu-tion 1 is also consistent with the observation (London et al. 1993) that addition of P2O5
to the haplogranite system causes expansion of the liquidus volume of quartz relative to that of feldspar. That expansion is a direct result of the formation of AlPO4 complexes at the
ex-pense of AlO2 complexes in the melt. The alkalis required for
charge-compensation of Al3+ in the AlO
2 complexes are
trans-ferred to the pyrophosphate from the AlO2 complex. FIGURE 8. Ratio of integrated intensity (area) of 1000 and 1120
cm–1 bands in glasses and melts as a function of temperature. Percent values denotes weight percent of P2O5 in the sample. Shaded region (Glass Transition?) represents temperature range within which the glass transition temperatures for these compositions most likely would be found (see text for detailed discussion).
3Al3+ in the aluminosilicate network requires alkalis or calcium
for charge-balance. For simplicity, in describing these relations, neither the charge-balancing metal nor the formal electrical charge of the anionic complexes are shown.
MYSEN ET AL.: P IN PERALUMINOUS MELTS 1344
Reaction 1 alone cannot, however, account for all the spec-troscopic observations and their structural interpretations, be-cause it does not offer a mechanism by which the abundance of AlPO4 complexes increases relative to P2O7 with increasing P2O5
contents and A/CNK of the melts (Fig. 8). This latter feature can, however, simply be accommodated by including the ex-cess alumina in the formation of AlPO4 complexes:
Al(excess) + 3AlO2 + 2P2O5↔ 4AlPO4. (2)
In Equation 2 Al(excess) denotes Al3+ in excess of that for
which there are alkalis and alkaline earths for electrical charge-balance of Al in tetrahedral coordination. The AlO2 complex
represents Al3+ in tetrahedral coordination as a part of the
alu-minosilicate network.
For each composition, A1000/(A1000+A1120) remains constant
from room temperature to 650 ± 100°C, followed by a slight decrease at higher temperatures (Fig. 8). In this approximate tem-perature range (650 ± 100 °C), the integrated intensity ratio, A1070/
(A1070+A1150), begins to increase (Fig. 7) suggesting that the
ma-terials become somewhat less polymerized as the relative abun-dance of pyrophosphate units decreases relative to Al-phosphate. These transitions (Figs. 7 and 8) might be related to transgres-sion across the glass transition temperature in these glasses. These structural changes across the glass transition are similar to those observed in the simpler systems Na2O-SiO2-P2O5 (Mysen 1996)
and Na2O-Al2O3-SiO2-P2O5 (Mysen 1998a). Although the glass
transformation temperatures for the present compositions are not known, for the present purposes, these may be estimated semiquantitatively from the simple relationship, Tg = 2/3·Tliq,
where Tliq and Tg are the liquidus and glass transition
tempera-tures (K), respectively.4 The liquidus temperatures were estimated
from those of the end-member ternary systems, Na2O-Al2O3-SiO2,
K2O-Al2O3-SiO2, and CaO-Al2O3-SiO2 (Osborn and Muan 1960a,
1960b, 1960c) by assuming ideal mixing of the aluminate com-ponents and using the heat of fusion data for tridymite (liquidus phase for these compositions) from Richet (1986). The liquidus temperatures of P-free compositions so calculated range from ~1350 to ~1500 °C. The effect of dissolved P2O5 on the liquidus
temperatures was also calculated in this manner, which results in liquidus temperatures in the P-bearing systems in the range 1050–1200 °C. From these estimated liquidus temperatures, the glass transition temperatures for the compositions studied are in the range of 550–700 °C. This range is marked in Figures 7 and 8. Although the ratios of integrated intensities as a function of temperature display some scatter,5 it is evident that the
inte-grated intensity of the 1000 cm–1 band (P-O stretching in P 2O7
complexes) decreases relative to that of the 1120 cm–1 band
(P-O stretching in AlP(P-O4 complexes) as the estimated glass
tran-sition temperature range is crossed (Fig. 8). A possible reac-tion expressing the relareac-tionship between P2O7 and AlPO4 is
4AlO2 + 12Q4 + 2P2O7↔ 4AlPO4 + 12Q3 (3)
which shifts to the right as the temperature is increased above the suggested glass transition temperatures. This is a depoly-merization reaction (increase in abundance ratio, Q3/Q4)
con-sistent with the increased ratio of integrated areas, A1070/
(A1070+A1150) (Fig. 7). Without calibration of these intensity
ra-tios, quantitative assessment of the abundances of individual complexes cannot be carried out. It is clear, however, that the P-bearing aluminosilicate melts are less polymerized than their corresponding glasses.
CONCLUDINGREMARKS
The dominant phosphate complexing mechanism in peraluminous haplogranite composition melts and glasses at atmospheric pressure is that of an AlPO4-type complex. A small
fraction of ortho- and pyrophosphate complexing is also ob-served. The fraction of the latter complexes becomes more important as Ca/P of the melts and glasses is increased. With increasing temperature above that of the glass transition, the AlPO4-complexes becomes more important relative to
pyro-phosphate complexes. This transformation is accompanied by depolymerization of the aluminosilicate network portion of the melt system. These temperature-dependent structural changes cannot be quenched in as a melt is transformed to a glass.
ACKNOWLEDGMENTS
A majority of this work was conducted while one of us (B.O.M.) visited CNRS-CRSCM in Orleans, France, during the summer of 1994. The hospitality extended by CNRS is greatly appreciated. Critical reviews by G. Morgan and an unidentified reviewer improved the manuscript. This research was partially sup-ported by PICS-CIW grant no. 142, and by NSF grant no. EAR-961443 (B.O.M.).
REFERENCESCITED
Daniel, I., Gillet, P., Poe, B.T., and McMillan, P.F. (1995) In-situ high-temperature Raman spectroscopic studies of aluminosilicate liquids. Physics and Chemistry of Minerals, 22, 74–86.
Dingwell, D.B., Knoche, R., and Webb, S.L. (1993) The effect of P2O5 on the vis-cosity of haplogranitic liquid. European Journal of Mineralogy, 5, 133–140. Dupree, R., Holland, D., Mortuza, J.A., Collins, J.A., and Lockyer, M.W.G. (1989)
Magic angle spinning NMR of alkali phospho-alumino-silicate glasses. Journal of Non-Crystalline Solids, 112, 111–119.
Gan, H., and Hess, P.C. (1992) Phosphate speciation in potassium aluminosilicate glasses. American Mineralogist, 77, 495–506.
Ghazot, G., Menzies, M.A., and Hart, B. (1996) Determination of partition coeffi-cients between apatite, clinopyroxene, amphibole, and melt in natural spinel lherzolites from Yemen; Implications for wet melting of the lithospheric mantle. Geochimica et Cosmochimica Acta, 60, 423–427.
Green, T.H. and Watson, E.B. (1982) Crystallization of apatite in natural magmas under high pressure hydrous conditions, with particular reference to orogenic rock series. Contributions to Mineralogy and Petrology, 79, 96–105. Gwinn, R., and Hess, P.C. (1993) The role of phosphorus in rhyolitic liquids as
determined from the homogeneous iron redox equilibrium. Contributions to Mineralogy and Petrology, 113, 424–435.
Kosinski, S.G., Krol, D.M., Duncan, T.M., Douglass, D.C., MacChesney, J.B., and Simpson, J.R. (1988) Raman and NMR spectroscopy of SiO2 glasses co-doped with Al2O3 and P2O5. Journal of Non-Crystalline Solids, 105(1,2), 45–52. Kushiro, I. (1975) On the nature of silicate melt and its significance in magma
gen-esis: Regularities in the shift of liquidus boundaries involving olivine pyroxene, and silica materials. American Journal of Science, 275, 411–431.
Lacey, E.D. (1963) Aluminum in glasses and melts. Physics and Chemistry of Glasses, 4, 234–238.
London, D. (1987) Internal differentiation of rare earth-element pegmatites: Effects of boron, phosphorous, and fluorine. Geochimica et Cosmochimica Acta, 51, 403–420.
London, D., Loomis, J.L., Huang, W., and Morgan, G.B. (1990) Behavior and effect
4In a comparison of T
g values calculated in this manner with
measured Tg values, Mysen (1998b) found that the calculated
Tg values were within ±10% of the measured values. A ±10%
uncertainty results in the ranges shown in Figures 7 and 8. Given the scatter in the data in those figures, a 10% uncertainty in the Tg values does not affect the overall conclusions.
5This is particularly so in Figure 6, where the integrated
inten-sity of the 1070 cm-1 band is considerably uncertain due to
of phosphorous in the system Ab-Or-Qz-H2O at 200 MPa (H2O). Geol. Soc. Amer. Abstracts with Program 22, 302.
London, D., Morgan, G.B., Babb, H.A., and Loomis, J.L. (1993) Behavior and ef-fects of phosphorus in the system Na2O-K2O-Al2O3-SiO2-P2O5-H2O at 200 MPa (H2O). Contributions to Mineralogy and Petrology, 113, 450–465. Long, D.A. (1977) Raman Spectroscopy. 276 p. McGraw-Hill, New York. McMillan, P., Piriou, B., and Navrotsky, A. (1982) A Raman spectroscopic study of
glasses along the joins silica-calcium aluminate, silica-sodium aluminate and silica-potassium aluminate. Geochimica et Cosmochimica Acta, 46, 2021–2037. McMillan, P.F., Poe, B.T., Gillet, P., and Reynard, B. (1994) A study of SiO2 glass and supercooled liquid to 1950 K via high-temperature Raman spectroscopy. Geochimica et Cosmochimica Acta, 58, 3653–3664.
McMillan, P.F., Wolf, G.H., and Poe, B.T. (1992) Vibrational spectroscopy of sili-cate liquids and glasses. Chemical Geology, 96, 351–366.
Mysen, B.O. (1992) Iron and phosphorus in calcium silicate quenched melts. Chemi-cal Geology, 98, 175–202.
———(1995) Structural behavior of Al3+ in silicate melts: In-situ, high-temperature measurements as a function of bulk chemical composition. Geochimica et Cosmochimica Acta, 59, 455–474.
———(1996) Phosphorous speciation changes across the glass transition in highly polymerized alkali silicate glasses and melts. American Mineralogist, 81, 1531– 1534.
———(1998a) Phosphorus solubility mechanisms in haplogranitic aluminosilicate glass and melt: Effect of temperature and aluminum content. Contributions to Mineralogy and Petrology, 133, 38–50.
———(1998b) Structure and properties of magmatic liquids: From haplobasalt to haploandesite. Geochimica et Cosmochimica Acta, in press.
Mysen, B.O. and Frantz, J.D. (1992) Raman spectroscopy of silicate melts at mag-matic temperatures: Na2O-SiO2, K2O-SiO2, and Li2O-SiO2 binary compositions in the temperature range 25°–1475°C. Chemical Geology, 96, 321–332. ———(1993) Structure of silicate melts at high temperature: In-situ measurements
in the system BaO-SiO2 to 1669°C. American Mineralogist, 78, 699–1669. Mysen, B.O., Ryerson, F.J., and Virgo, D. (1981) The structural role of phosphorous
in silicate melts. American Mineralogist, 66, 106–117.
Mysen, B.O., Finger, L.W., Seifert, F.A., and Virgo, D. (1982) Curve-fitting of Raman spectra of amorphous materials. American Mineralogist, 67, 686–696. Mysen, B.O., Holtz, F., Pichavant, M., Beny, J.-M., and Montel, J.-M. (1997)
Solu-tion mechanisms of phosphorus in quenched hydrous and anhydrous granitic glass as a function of peraluminosity. Geochimica et Cosmochimica Acta, 61, 3913–3926.
Neuville, D.R., and Mysen, B.O. (1996) Role of aluminum in the silicate network: In-situ, high-temperature study of glasses and melts on the join SiO2-NaAlO2. Geochimica et Cosmochimica Acta, 60, 1727–1738.
Osborn, E.F. and Muan, A. (1960a) Phase equilibrium diagrams for ceramists. Plate 4. The system Na2O-Al2O3-SiO2. American Ceramic Society, Columbus OH. ———(1960b) Phase equilibrium diagrams for ceramists. Plate 5. The system K2
O-Al2O3-SiO2. American Ceramic Society, Columbus OH.
———(1960c) Phase equilibrium diagrams of oxide systems. Plate 2. The System CaO-Al2O3-SiO2. American Ceramic Society, Columbus OH.
Pichavant, M., Herrera, J.V., Boulmier, S., Brigueu, L., Joron, J.-L., Juteau, L.M., Michard, A., Sheppard, S.M.F., Treuil, M., and Vernet, M. (1987) The Macusani
glasses, SE Peru: Evidence of chemical fractionation of peraluminous magmas. In B.O. Mysen, Ed., Magmatic Processes: Physicochemical Principles, p. 359– 374. Geochemical Society.
Pichavant, M., Montel, J.-M., and Richard, L.R. (1992) Apatite solubility in peraluminous liquids: Experimental data and an extension of the Harrison model. Geochimica et Cosmochimica Acta, 56, 3855–3861.
Poe, B.T., McMillan, P.F., Cote, B., Massiot, D., and Coutoures, J.-P. (1992) SiO2 -Al2O3 liquids: In-situ study by high-temperature 27Al NMR spectroscopy and molecular dynamics simulations. Journal of Physical Chemistry, 96, 8220–8224. Reynard, B. and Toplis, M. (1997) The structural role of phosphorus in Na2O-Al2O3 -SiO2-P2O5 glasses and melts: High-temperature Raman spectroscopic results. Terra Nova, 9 (Abstract Supplement 1), 483.
Richet, P., Ingrin, J., Mysen, B.O., Courtial, P., and Gillet, P. (1994) Premelting effects in minerals: an experimental study. Earth and Planetary Science Letters, 121, 589–600.
Ryerson, F.J. (1985) Oxide solution mechanisms in silicate melts: Systematic varia-tions in the activity coefficient of SiO2. Geochimica et Cosmochimica Acta, 49, 637–651.
Sato, R.K., McMillan, P.F., Dennison, P., and Dupree, R. (1991) A structural inves-tigation of high alumina glasses in the CaO-Al2O3-SiO2 system via Raman and magic angle spinning nuclear magnetic resonance spectroscopy. Physics and Chemistry of Glasses, 32(4), 149–160.
Seifert, F.A., Mysen, B.O., and Virgo, D. (1982) Three-dimensional network struc-ture in the systems SiO2-NaAlO2, SiO2-CaAl2O4 and SiO2-MgAl2O4. American Mineralogist, 67, 696–711.
Toplis, M.J. and Dingwell, D.W. (1996) The variable influence of P2O5 on the vis-cosity of melts of differing alkali/aluminum ratio: Implications for the struc-tural role of phosphorus in silicate melts. Geochimica et Cosmochimica Acta, 60, 4107–4121.
Toplis, M.J. and Schaller, T. (1998) A 31P MAS NMR study of glasses in the system xNa2O-(1-x)Al2O3-2SiO2-yP2O5. Journal of Non-Crystalline Solids, 224, 57–68. Toplis, M.J., Dingwell, D.B., and Libourel, G. (1994) The effect of phosphorus on the iron redox ratio, viscosity, and density of an evolved ferro-basalt. Contribu-tions to Mineralogy and Petrology, 117, 293–304.
Watson, E.B. (1976) Two-liquid partition coefficients: Experimental data and geochemi-cal implications. Contributions to Mineralogy and Petrology, 56, 119–134. ———(1980) Apatite and phosphorous in mantle source regions: An experimental
study of apatite/melt equilibria at pressures to 25 kbar. Earth and Planetary Science Letters, 51, 322–335.
Wolf, M.B., and London, D. (1994) Apatite dissolution into peraluminous haplogranitic melts: An experimental study of solubilities and mechanisms. Geochimica et Cosmochimica Acta, 58, 4127–4145.
Wyllie, P.J., and Tuttle, O.F. (1964) Experimental investigation of silicate systems containing two volatile components. III. The effects of SO3, P2O5, HCl, and Li2O in addition to H2O on the melting temperatures of albite and granite. Ameri-can Journal of Science, 262, 930–939.
MANUSCRIPT RECEIVED MARCH 23, 1998 MANUSCRIPT ACCEPTED APRIL 29, 1999 PAPER HANDLED BY DAVID LONDON