HAL Id: hal-00306273
https://hal.archives-ouvertes.fr/hal-00306273
Submitted on 25 Jul 2008HAL is a multi-disciplinary open access archive for the deposit and dissemination of sci-entific research documents, whether they are pub-lished or not. The documents may come from teaching and research institutions in France or abroad, or from public or private research centers.
L’archive ouverte pluridisciplinaire HAL, est destinée au dépôt et à la diffusion de documents scientifiques de niveau recherche, publiés ou non, émanant des établissements d’enseignement et de recherche français ou étrangers, des laboratoires publics ou privés.
around negatively charged spacecraft
E. Sasot, A. Hilgers, B. Thiébault, Vincent Génot, A.I. Eriksson
To cite this version:
E. Sasot, A. Hilgers, B. Thiébault, Vincent Génot, A.I. Eriksson. Secondary electron emission causing potential barriers around negatively charged spacecraft. NASA/CP-2004-213091, 2004. �hal-00306273�
SECONDARY ELECTRON EMISSION CAUSING POTENTIAL BARRIERS AROUND NEGATIVELY CHARGED SPACECRAFT
Poster Session I
Eloy Sasot Samplón, Alain Hilgers, Benoit Thiébault
Space Environments and Effects Section (ESA-ESTEC/TOS-EES), Keplerlaan 1, 2200 AG Noordwijk, The Netherlands
Email contact: Eloy.Sasot@esa.int
Vincent Génot
Centre d'Etudes Spatiales des Rayonnements (CNES-CNRS/CESR) 9, avenue du Colonel Roche - Toulouse Cedex 4, France
Anders I. Eriksson
Swedish Institute of Space Physics (IRFU) Uppsala, Sweden
Abstract
Low-energy secondary electrons have been observed to be reflected back to the spacecraft during eclipse conditions. It has been argued that the presence of negative potential barriers can be caused by the secondary electron emission space charge and may play a role in the spacecraft charging process. The barriers turn back the low-energy spacecraft-emitted electrons and prevent the low-low-energy ambient electrons from reaching the detector. Two numerical methods previously presented by Whipple and by Parrot et al. in the literature have been used to study the effect of secondary electrons on potential barriers negatively charged spacecrafts. The former method provides an upper bound for the potential barriers when the sheath is large compared to spacecraft dimension. The latter one provides in principle the exact sheath profile subject to accurate integration of the density distribution over the energy. The application of the methods to data provided by the ATS6 and Freja spacecraft suggests that the high level negative charging is not due to barriers induced by secondary electron emission space charge.
Introduction
A key problem in plasma-body interaction studies is the self-consistent modelling of the plasma distribution in the electrostatic sheath. Numerous assumptions to tackle the problem in different ways have been set since the founder article by Mott-Smith and Langmuir [6]. The phenomenon is made even more complicated by the effect of secondary particles emitted at the body surface. This has been discussed by a number of authors (cf. e.g. Grard [4]). There has been evidence that under certain circumstances a potential barrier may be induced by the space charge due to an excess of secondary electron particles (cf. e.g. Whipple [10][11]). The electrostatic potential barrier has been suspected to play a role in high charging level. This has been invoked for ATS-6 spacecraft (cf. Whipple [10]) and more recently for the Freja spacecraft [2][9].
An example of a charging event observed on Freja spacecraft is shown on Figure 1 where the time series of the energy spectrograms of the ions (panel 1: Oxygen, panel 2: Helium and panel 3: Hydrogen) and of electrons (bottom panel) are shown. The pitch-angles of the ion and electron detectors are shown respectively in panel 4 and 6. In panel 5 the integrated flux of electrons in a broad energy range is shown. The charging event can be monitored via the acceleration of ions seen for all species between 17:00 and 18:20 UT. Beyond 18:20 the spacecraft acceleration signature is unclear due to the overlap with other high energy ion phenomena probably of natural origin. When no energetic ions are seen one can observe the usual feature of ram ion flux with energy corresponding to the relative velocity of the spacecraft with respect to the plasma.
Figure 1 : Time series plot of Freja particle measurements during a high level charging event [8].
Such a high charging level is relatively rare on Freja. The examination of 2 years of data (~7000 orbits) by Wahlund et al. [9] has identified about 170 charging events with negative potential below –10 V during auroral arc crossings. About 40 exhibited a potential lower than –100 V and 5 of the order of –1000 V.
The total distribution of the values of the potential for these events is shown in Figure 2 below. It must be noted that Freja manufacturers made use of material coating that are known to alleviate charging (especially ITO and cover glasses) therefore when – 10 V was observed on Freja another spacecraft could have experienced a much more negative potential in the same environment.
Figure 2 : Distribution of observed charging events of Freja for potential below –10 V (from Wahlund et al. [9]).
An unresolved problem yet is how such very high level negative charging events are possible on Freja despite the presence of all the materials with high secondary electron emission yield which are grounded to the spacecraft structure. So far all attempts to reproduce this charging level taking into account the expected secondary electron emission have failed [2]. Three main effects have been proposed to block secondary electron emission and therefore reach high level negative charging: (1) the effect of the magnetic field parallel to electron-emissive surfaces, or the effect of a negative potential barrier either due to (2) differential charging or due to (3) the negative space charge of the secondary electrons. To check the influence of the first effect, a correlation of the level of charging with the angle of the spacecraft spin axis with respect to the ambient magnetic field had been sought but no correlation were found [9]. The second effect may occur will operate if significant surfaces with low secondary electron emission and low surface conductivity existed. However, the existence of such surfaces on Freja has not been identified yet [2]. The third effect which had not been investigated so far is the subject of the current study.
In this paper two methods for assessing the level of a potential barrier are used to investigate the applicability of such mechanism to Freja charging process. It is concluded that no significant space charge induced potential barriers may have played a role in Freja high level charging.
Methods of Barrier Level Assessment
In this paper one uses numerical approaches which have been developed in the past and published in the literature by Parrot et al. [7] and Whipple [10]. The unperturbed ambient plasma, composed of primary electrons, ions and secondary emitted electrons is assumed to be collisionless and Maxwellian. Plasma conditions are taken
independent of time and not influenced by magnetic fields. Both methods solve the system of Vlasov-Poisson equations around a sphere equipotentially charged and therefore apply in principle to spherically symmetric problems.
The Vlasov-Poisson system of equations in spherical symmetry can be written as follows
Where V is the particle velocity, f is the particle distribution function in speed, ñ is the particle density, Ô is the electrostatic potential, R is the radial distance, and ∆R is the
Laplacian in spherical coordinate for spherical symmetry. The density of various species is determined by counting particles accessible in each relevant phase and space domain. Two formulations have been proposed to count the particles: the Effective Potential and the Turning Point methods.
Effective Potential Method
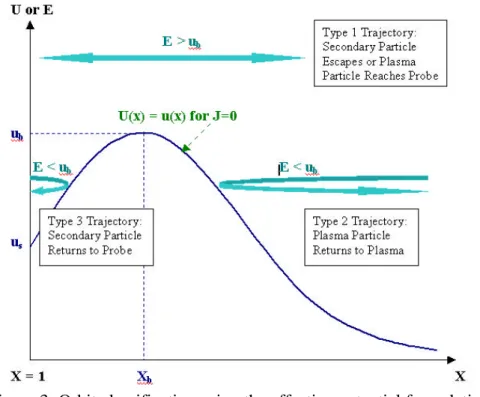
The effective potential formulation (Bernstein and Rabinowitz [1]) has been used by Whipple [10] to analytically solve the Vlasov equation in the E-J² domain under the hypothesis of a very large Debye length compared to the spacecraft dimension. The particle counting in phase space is based on the fact that the energy E must be greater than the effective potential U for radial motion for the trajectories to exist:
2 2
2
m
R
J
q
U
E
⋅
⋅
+
⋅
=
>
φ
Where U is the effective potential, φ is the electrostatic potential, q and m the charge and mass of the particle, R the distance from the probe and J the angular momentum of the particle. Particle densities at any point are given by an integral over velocities. Assuming spherical symmetry, they can be transformed into an integral over E and J². The result for secondary particles density n are, if Maxwelian distributions for both plasma and emitted electrons are assumed:
∫∫
−
⋅
−
⋅
⋅
⋅
=
1/2 2 − 2 2 12/2 02
(
E
J
/
x
)
dJ
dE
e
w
x
e
n
n
S Eφ
π
φWhere n is the nominal secondary particles density, x is the radial spatial variable 0
(scaled to the satellite radius), φ is the satellite potential and w is a weight value s which has the value unity in regions where only one-way trajectories are possible and
has the value 2 in regions where particles from a given source can be going in both directions. The applicability of Maxwellian distribution for secondary electrons has been discussed by e.g., Grard [4].
Whipple [10] used the above equation with an approximation of the boundary of the particle trajectories (cf. Figure 3) in the E-J² domain. He developed a numerical scheme to find out an upper bound of the value of the potential barrier in a given plasma environment.
Figure 3: Orbit classification using the effective potential formulation
Turning Point Formulation Method
The turning point formulation described by Parrot et al. [7] and also by Thiébault et al. [8] is based upon the study of the possible particles orbits in the r-J² phase space to solve the Vlasov equation for a given potential profile. The Vlasov-Poisson system is then solved iteratively by under-relaxation.
This has been validated for the application of sheath modelling in presence of secondary electron by Thiébault et al. [8] by comparison with a 3D Particle-In-Cell (PIC) code developed by Forest et al. [3]. The main limitation of the turning point approach is that the full solution is obtained via a numerical integration over the particles energies which is very demanding in terms of computing time.
Application of the turning point method to ATS-6
The effective potential method was further applied by Whipple to the ATS-6 satellite data for which a potential barrier had been observed thanks to the identification of a knee in the electron spectra [11]. The various plasma and potential values deduced
from the ATS-6 satellite data by Whipple [10] for 4 events where potential barriers were identified are shown in Table 1.
Table 1: Plasma parameters derived from ATS-6 data by Whipple [10].
Nph (p/cc) Ne/Ni (p/cc) Tph (eV) Te (eV) Ti (eV) Vsat (V) ëe (m) ëph (m) Day 198 10.3 0.2 4.9 65 7 -20 36.79 5.2 Day 199 90 1.2 2 32 10 0 9.59 1.1 Day 204 200 90 1.9 14.5 3.5 -2 1.08 0.73 Day 273 0.4 17 6 320 650 -2000 4.41 29.4
For each event three estimates of the potential barrier magnitude are available and are reported in Table 2 under the columns labelled E, W, and P which stand respectively for the Experimental estimate of the potential barrier observed on ATS-6 data, an estimate of an Upper bound of the potential barrier based on the effective potential method, and the theoretical Prediction of the barrier based on the turning point formulation. In this table Vmin stands for the minimum of the potential while Vdiff is equal to Vsat-Vmin. The two first estimates were provided by Whipple [10] while the later one is provided by this study. An example of potential profile computed for day 204 is shown on Figure 4.
Table 2: Experimental, Upper bound and turning point method estimates.
Day 198 Day 199 Day 204 Day 273 Potential
(V) E U P E U P E U P E U P
-Vsat 20 0 2 2000
-Vmin 60 24.6 20 10 6.2 3.82 10 3.2 2.47 2050 2000 2000
Vdiff 40 4.6 0 10 6.2 3.82 8 1.2 0.47 50 0 0
Figure 4: Potential barrier for ATS during the charging event of day 204 computed with the turning point method.
The upper bound and the exact prediction are consistent with each other. It can be noted that during day 198 the turning point formulation method even indicates that no potential barrier exists which is a significative refinement compared to the upper bound estimate method. In all cases, however, the theoretical predictions and upper bound estimates are both significantly lower than the observed barrier. This is interpreted as an impossibility that the potential barrier actually observed is due to the secondary electron space charge.
Application to Freja charging events
Freja, which was on a low altitude polar orbit, encountered a somewhat different environment than ATS-6, which was on a geosynchonous orbit. The main difference during the charging events was especially the much higher background plasma density observed on Freja. The turning point formulation method and the upper bound estimate method have been used to derive an estimate of a possible potential barrier around Freja spacecraft dur ing four well identified charging events. The environmental data and the spacecraft potential for each of these events have been derived from the data. The flux of secondary particle was chosen such as to remain in a realistic range but favouring the occurrence of negative electrostatic barrier. In all cases, no barrier could be found. A parametric study has been performed to find out the range of parameters for which barriers would occur on Freja. It was found that barrier would not occur for spacecraft potential lower than –7 Volts. We can therefore conclude that a secondary electron induced potential barrier is very unlikely to play a role in the process of high level charging observed on Freja.
Conclusion
The application of the turning point formulation to the modelling of electrostatic sheath has improved the prediction of secondary electrons induced potential barriers compared to previous studies. With this method the prediction made by Whipple of an upper bound of the expected secondary electron induced potential barrier has been refined. The conclusions of Whipple, however, remain unchanged. Applied to Freja, the turning point method shows that secondary electrons seem not to be causing potential barriers when the spacecraft is beyond a few volts negative in the polar region, where the density is relatively high (a few tens of particles per cc). Therefore, secondary electron induced potential barrier is unlikely to be involved in the building process of high level negative charging observed on Freja. Other aspects of the secondary electron emission process will have to be taken into account in order to explain the highly negative Freja charging events. This might still be due to differential charging effects although the reason for it is not understood yet. It must be also noted that certain characteristics of the secondary electron emission properties may not be well modelled yet and these could significantly affect the charging level too.
Acknowledgments
This study has been performed in the frame of the Spacecraft Plasma Interaction Network in Europe (SPINE) activities (cf. www.spis.org). We acknowledge useful
discussions with the participants of the 5th SPINE workshop and especially of the working group on surface plasma interactions lead by M-L. Fille.
References
1. Bernstein, I.B., and Rabinowitz, I.N.: “Theory of electrostatic probes in a low-density plasma”, Phys. Fluids, 2, 112, 1959.
2. Eriksson, A.I., Wedin, L., Wahlund, J-E, and Holback, B.: “Analysis of Freja Charging Events: Modelling of Freja Observations by Spacecraft Charging Codes”, IRF Scientific report 252, January 1999.
3. Forest J., Eliasson, L., Hilgers, A.: “A New Spacecraft Plasma Simulation
th
Spacecraft Charging Technology Conference, Proceedings pp.515-520, ESA/SP-476, ISBN No 92-9092-745-3, ESA-ESTEC, Noordwijk, The Netherlands, 23-27 April 2001.
4. Grard, R.J.L.: “Properties of the satellite photoelectron sheath derived from photoemission laboratory measurements”, J. Geophys. Res., Vol.78, No.16, 2885, 1973.
5. Hilgers, A., J.-E. Wahlund, L. Wedin, A. I. Eriksson, B. Holback and H. Koskinen, “Electrostatic Charging on Earth Polar Orbiting Spacecraft: Lessons Learned from Freja,” ESA publication Preparing for the future, Vol. 9, No 3, December 1999.
6. Mott-Smith, H.M., and Langmuir, I.: “The theory of collectors in gaseous discharges”, Phys. Rev., 28, 727, 1926.
7. Parrot M.J.M. Storey L.R.O. Parker L.W. Laframboise J.G.: “Theory of cylindrical and spherical Langmuir probes in the limit of vanishing Debye number”, it Phys. Fluids, Vol. 25, No. 12, 2388-2400, 1982.
8. Thiébault, B., Hilgers, A., Sasot, E., Forest, J., Génot, V., Escoubet, P.: “Investigation of Electrostatic Potential Barrier Near an Electron-Emitting Body”, Proceedings of the 8th Spacecraft Charging Technology Conference, Huntsville, AL, October 20-24, 2003.
9. Wahlund, J-E., L. J. Wedin, T. Carrozi, A. I. Eriksson, B. Holback, L. Andersson, H. Laakso, “Analysis of Freja Charging Events: Statistical Occurrence of Charging Events,” ESA contract 11974/96/NL/JG(SC), WP 130 TECHNICAL NOTE (SPEE-WP130-TN), Version 2.0, Finish Meteorological Institute, Helsinki, February 22, 1999.
10. Whipple, E.C. Jr.: “Theory of the Spherically Symmetric Photoelectron Sheath: A Thick Sheath Approximation and Comparison With the ATS 6 Observation of a Potential Barrier”, J.Geophys. Res., Vol. 81, No. 4, 601-607, 1976a.
11. Whipple, E.C. Jr.: “Observation of Photoelectrons and Secondary Electrons Reflected From a Potential Barrier in the Vicinity of ATS 6”, J. Geophys. Res., Vol. 81, No. 4, 715-719, 1976b.
![Figure 1 : Time series plot of Freja particle measurements during a high level charging event [8]](https://thumb-eu.123doks.com/thumbv2/123doknet/2339171.33528/3.894.153.740.354.738/figure-time-series-freja-particle-measurements-level-charging.webp)