For Peer Review
Aquifer-peatland connectivity in southern Quebec (Canada)
Journal: Hydrological Processes Manuscript ID: HYP-13-0816.R2 Wiley - Manuscript type: Research Article Date Submitted by the Author: n/a
Complete List of Authors: Ferlatte, Miryane; University of Quebec at Montreal, Earth and atmospheric sciences
Quillet, Anne; University of Quebec at Montreal, Earth and atmospheric sciences
Larocque, Marie; University of Quebec at Montreal, Earth and atmospheric Sciences
Cloutier, Vincent; University of Quebec in Abitibi-Témiscamingue, Groupe de recherche sur l'eau souterraine, Institut de recherche en mines et en environnement
Pellerin, Stéphanie; Université de Montréal, Institut de recherche en biologie végétale
Paniconi, Claudio; Université du Québec, INRS-ETE
Keywords: peatland, aquifer, connectivity, geological setting, southern Quebec (Canada)
For Peer Review
Aquifer–peatland connectivity in southern Quebec (Canada)
1 2 3
M. Ferlatte1, A. Quillet1, M. Larocque1*, V. Cloutier2, S. Pellerin3, C. Paniconi4
4 5 6 7
1
GEOTOP Research Center – Université du Québec à Montréal, C.P. 8888, succ.
Centre-8
Ville, Montréal (QC), Canada ; tel : 514-987-3000 ext. 1515 ; fax : 514-987-7749;
9
miryanef@gmail.com; anne.quillet@gmail.com; larocque.marie@uqam.ca
10
2
Groundwater Research Group, Research Institute on Mines and the Environment, –
11
Université du Québec en Abitibi-Témiscamingue, Campus d’Amos, 341, rue Principale
12
Nord, suite 5004, Amos (Qc), J9T 2L8, Canada ; tel : 819-732-8809 ext. 8228 ;
13
vincent.cloutier@uqat.ca
14
3
Institut de recherche en biologie végétale, Université de Montréal, Jardin botanique de
15
Montréal, 4101 rue Sherbrooke est, H1X 2B2, Montréal, Québec, Canada;
16
stephanie.pellerin.1@umontreal.ca
17
4
Institut national de la recherche scientifique, Centre Eau Terre Environnement
(INRS-18
ETE), Université du Québec, 490 rue de la Couronne, Québec (Québec), G1K 9A9,
19 Canada 20 * Corresponding author 21 22 3 4 5 6 7 8 9 10 11 12 13 14 15 16 17 18 19 20 21 22 23 24 25 26 27 28 29 30 31 32 33 34 35 36 37 38 39 40 41 42 43 44 45 46 47 48 49 50 51 52 53 54 55 56
For Peer Review
Abstract
23
In areas where peatlands are abundant, they are likely to play a significant role in the
24
hydrological and hydrogeological dynamics of a watershed. Although individual case
25
studies are reported in the literature, there is a large range of aquifer–peatland interactions
26
and there is a need to understand the controls of these interactions. The objectives of this
27
study were 1) to better understand aquifer–peatland connections and how these may be
28
predicted by geology and geomorphic location and 2) to provide a variety of reference
29
sites for glacial geological settings. Slope and depression peatlands were studied in the
30
Abitibi-Témiscamingue region and in the St. Lawrence Lowlands, two contrasting
31
regions of southern Quebec. A total of twelve transects that span a shallow aquifer–
32
peatland interface were instrumented with piezometers. Field investigations included
33
peatland characterization, monthly water level monitoring, and continuous hydraulic head
34
measurements with pressure transducers. The results indicate that 7 of the 12 transects
35
receive groundwater from the surrounding shallow aquifer. At the peatland margin, four
36
lateral flow patterns were identified and associated with slope peatlands (parallel inflow
37
and divergent flow) and with depression peatlands (convergent flow and parallel
38
outflow). Vertical hydraulic gradients suggest that water flows mainly downwards, i.e.,
39
from the peatland to the underlying mineral deposits. Vertical connectivity appears to
40
decrease as the distance from the peatland margin increases. All of these exchanges are
41
important components in the sustainability of peatland hydrogeological functions. The
42
regional comparison of aquifer–peatland flow dynamics performed in this study provides
43
a new set of referenced data for the assessment of aquifer–peatland connectivity.
44
Key words: peatland, aquifer, connectivity, geologic setting, southern Quebec (Canada)
45 3 4 5 6 7 8 9 10 11 12 13 14 15 16 17 18 19 20 21 22 23 24 25 26 27 28 29 30 31 32 33 34 35 36 37 38 39 40 41 42 43 44 45 46 47 48 49 50 51 52 53 54 55 56
For Peer Review
1. Introduction
46
There is a need to understand regional variability in watershed hydrology, and how this
47
may vary and be predicted by geology and geomorphic location. Wetlands in general and
48
especially peatlands can play a significant role in the hydrological and hydrogeological
49
dynamics of a watershed (Bullock and Acreman, 2003; Cohen and Brown, 2007).
50
Minerotrophic peatlands (or fens) are usually connected to shallow aquifers.
51
Ombrotrophic peatlands (or bogs) rely on precipitation and atmospheric deposition, and
52
they often have a higher water table isolated from regional groundwater flow. However,
53
groundwater can feed bogs as upward local groundwater flux (Drexler, 1999; Fraser et
54
al., 2001). Bogs can also be connected to surface aquifers through minerotrophic peat
55
margins and laggs. A better understanding of these dynamics can contribute to
56
groundwater and wetland management.
57 58
Aquifer–peatland connections are influenced by peatland location within a local,
59
intermediate, and regional flow system (Tóth, 1999; Winter, 2000; 2001; Winter and
60
LaBaugh, 2003), as well as peatland development stage. For example, peatlands located
61
on or at the base of hillslopes are known to be areas of regional or intermediate
62
groundwater discharge (Todd et al., 2006) which generally supports persistent surface
63
wetness in the peatland (Branfireun and Roulet, 1988). This context explains the
64
vegetation diversity, elevated pH, alkalinity, and calcium concentrations found in
65
minerotrophic peatlands (Bendell-Young and Pick, 1997; Bragazza and Gerdol, 2002).
66
However, with currently available data it is difficult to extrapolate site-specific
67
observations because of spatial variability of peatland geological settings (Whitfield et
68 3 4 5 6 7 8 9 10 11 12 13 14 15 16 17 18 19 20 21 22 23 24 25 26 27 28 29 30 31 32 33 34 35 36 37 38 39 40 41 42 43 44 45 46 47 48 49 50 51 52 53 54 55 56
For Peer Review
al., 2010) and climate conditions. There is clearly a need to perform multi-site aquifer–
69
peatland connection studies that could lead to a framework allowing such extrapolations
70
(Price et al. 2005). These frameworks are not new for temperate wetlands and riparian
71
zones (e.g., Brinson 1993), but are much less developed for peatland–upland interactions
72
and in northern climates.
73 74
In the Canadian province of Quebec, peatlands cover an area of approximately
75
112,000 km2, i.e., more than 7% of the territory (Daigle and Gautreau-Daigle, 2001), yet
76
relatively little is known about their connections with surface aquifers. The objectives of
77
this study were 1) to better understand aquifer–peatland connections and how these may
78
be predicted by geology and geomorphic location and 2) to provide a multi-site
79
comparison basis for aquifer–peatland connections in glacial geological settings. This
80
study analyzed stratigraphy as well as spatio-temporal variations in water levels in twelve
81
aquifer–peatland systems of the Abitibi and Centre-du-Quebec regions of southern
82 Quebec. 83 84 2. Study sites 85
Surficial geology in the Abitibi region (Figure 1a) is characterized by an esker-moraine
86
morphology surrounded by an extensive glaciolacustrine clay plain. These deposits cover
87
metamorphosed sedimentary and volcanic rocks intruded by granitoids. Deposited when
88
the region was submerged by the deep proglacial waters of Lake Barlow-Ojibway, this
89
clay contributes to the highly productive aquifers found in eskers by retaining
90
groundwater in the granular deposits (Nadeau, 2011). In the Abitibi region, 19% of the
91 3 4 5 6 7 8 9 10 11 12 13 14 15 16 17 18 19 20 21 22 23 24 25 26 27 28 29 30 31 32 33 34 35 36 37 38 39 40 41 42 43 44 45 46 47 48 49 50 51 52 53 54 55 56
For Peer Review
study area comprises wetlands, most of which are peatlands (Ducks Unlimited Canada,
92
2009) essentially found on esker slopes. The peatlands selected for this study are slope
93
bogs (as defined by NWWG, 1997) that have developed on the eskers. They form large
94
peatland complexes, with a marginal fen at their upgradient limit and fingering organic
95
deposits that drain naturally in small streams at the outer edge of the peatlands. The
96
peatlands are geogenous (Mitsch and Gosselink, 2007), i.e., open to outside hydrologic
97
flows other than precipitation, and most are flow-through systems.
98 99
Geology in the Becancour region (Figure 1b) consists of a series of sedimentary and
100
metamorphic rocks, mainly schists and shales, covered with tills and permeable
101
Quaternary marine deposits that form surface and semi-confined aquifers.
Low-102
permeability tills and Champlain Sea clay deposits accumulated during and after the last
103
glaciation have favored peat accumulation in topographic depressions (Godbout et al.,
104
2011). In low-lying areas, eolian deposits have been stabilized by the accumulation of
105
peat (Filion, 1987). Peatlands comprise approximately 6% of the Becancour watershed
106
(Avard et al., 2013). The peatlands selected for this study are basin bogs (as defined by
107
NWWG, 1997) surrounded by a minerotrophic lagg and are located at the head of small
108
or intermediate watersheds. They all have more than one small stream outflow, and most
109
are drained by artificial ditches. Many of the Becancour peatlands are topogenous
110
peatlands, i.e., they have developed in topographic depressions with the possibility of
111
local and intermediate scale groundwater connections (Mitsch and Gosselink, 2007).
112 113 3 4 5 6 7 8 9 10 11 12 13 14 15 16 17 18 19 20 21 22 23 24 25 26 27 28 29 30 31 32 33 34 35 36 37 38 39 40 41 42 43 44 45 46 47 48 49 50 51 52 53 54 55 56
For Peer Review
Vegetation surveys performed on all the transects (Munger et al., 2014) have identified
114
the presence of minerotrophic plant communities close to the shallow aquifer–peatland
115
interface and a gradient towards ombrotrophic plant communities as the distance from the
116
upland increases. This reflects the presence of a minerogenous hydrological system in the
117
lagg or marginal fen portion of the peatlands and an ombrogenous system towards the
118
inside of the peatland.
119 120
In the two regions, peatlands are bordered by sand and gravel deposits that extend, at
121
least partly, under the organic deposits. Regional aquifer characterization studies
122
(Larocque et al., 2013a; Cloutier et al., 2013) have shown that sand thickness can vary
123
from 1 to 20 m at the peatland border (near the surface aquifer), allowing lateral
124
hydrogeological connectivity. A hardened oxidized sand layer has been observed under
125
Becancour peatlands near the water table, indicating a possible restriction in vertical
126
flows. Towards the center of the peatlands, the organic deposits sometimes lie directly
127
over either clay or low permeability compact till. Vertical flows are expected to be very
128
limited in these sectors. In Abitibi, the slope peatlands are located within 250 to 3000 m
129
of an esker crest. In Becancour, some depression peatlands are within 50 to 500 m of a
130
local topographic crest, while other peatlands are far from any high topography region.
131
These conditions define the Abitibi peatlands in a discharge position within an
132
intermediate scale recharge-discharge setting. In Becancour, some peatlands are located
133
in local recharge-discharge settings while others could be intermediate or even regional
134
scale groundwater discharge sites.
135 136 3 4 5 6 7 8 9 10 11 12 13 14 15 16 17 18 19 20 21 22 23 24 25 26 27 28 29 30 31 32 33 34 35 36 37 38 39 40 41 42 43 44 45 46 47 48 49 50 51 52 53 54 55 56
For Peer Review
Long-term average air temperatures are 1˚C and 5˚C in the Abitibi and Becancour
137
regions respectively (Environment Canada, 2012). The long-term average annual
138
precipitation is slightly lower in Abitibi (918 mm) than in Becancour (1193 mm). The
139
proportion of snow precipitation (between November and April) is similar for the two
140
regions, with 27% for Abitibi and 24% for Becancour. The May-November 2011 study
141
period was especially dry in Abitibi, with 543 mm of rain (annual precipitation of
142
808 mm in 2011) compared to 954 mm in Becancour due to the Irene hurricane in late
143
August (total 2011 annual precipitation 1388 mm). The year 2011 was warmer than
144
average in both regions, with average temperatures of 3oC and 6oC in Abitibi and
145
Becancour respectively. The May-November average monthly temperatures were above
146
freezing in both regions (Figure 2). The potential evapotranspiration for the
May-147
November 2011 period (calculated with the Oudin et al., 2005 formula) was 495 mm and
148
555 mm in Abititi and Becancour respectively. This leads to a very low net precipitation
149
for the study period in Abitibi (48 mm) compared to a high net precipitation in Becancour
150 (399 mm). 151 152 3. Methods 153 3.1 Field instrumentation 154
The definition of peatland used in this study is the one from NWWG (1997), i.e., mainly
155
anaerobic water-saturated ecosystems, where peat accumulation exceeds 40 cm. Six
156
aquifer–peatland transects were instrumented in each region. Experimental sites were
157
selected using wetland maps (Ducks Unlimited Canada, 2006; 2009) as well as aerial and
158
satellite photographs. Undisturbed peatlands were preferred whenever possible. Five
159 3 4 5 6 7 8 9 10 11 12 13 14 15 16 17 18 19 20 21 22 23 24 25 26 27 28 29 30 31 32 33 34 35 36 37 38 39 40 41 42 43 44 45 46 47 48 49 50 51 52 53 54 55 56
For Peer Review
peatlands were selected in Abitibi: La Belle (two transects: LB1 and LB2), La Coupe
160
(LC), Saint-Mathieu-Berry (SMB), Sources Nord (SN), and Sources Sud (SS) and four
161
were selected in the Becancour region: Lac Rose (two transects: LR1 and LR2), Mer
162
Bleue (MB), Saint-Sylvère (SSY), and Villeroy (two transects: V1 and V2) (Figure 1).
163 164
In each peatland, one or two transects were positioned perpendicular to the peatland
165
margin, in the direction of potential lateral groundwater flow. Transects in the same
166
peatland were located at 690, 330, and 990 m apart for LB1/LB2, LR1/LR2, and V1/V2
167
respectively, and parallel to each other. All transects include six piezometric stations
168
(Figure 3). Each piezometer is built of a 2.5 cm-ID-PVC pipe slotted over the lower
169
30 cm and sealed at the base. In the shallow aquifer (station no.1), the piezometers were
170
installed using an auger and have depths ranging from 0.75 to 4.22 m, to ensure that they
171
reach the water table. This piezometer station is located within 10 m from the peatland
172
margin, while the other five stations (no.2 to 6) are located further into the peatland.
173
Station no.2 is located as close as possible to the peatland margin, where peat thickness
174
reaches 40 cm. Station no.3 is located where significant changes in vegetation are
175
observed, indicating a transition from a fen vegetation to a bog vegetation. Stations no.4,
176
5, and 6 are approximately 50 m, 100 m, and 300 m away, respectively, from station
177
no.3. The transects have an average length of 450 m.
178 179
Only one piezometer was installed in the surface aquifer, whereas nests of two
180
piezometers were installed in the peatland. The nests were composed of a surface
181
piezometer, at a maximum depth of 1.1 m in the peat, and a deep piezometer located at
182 3 4 5 6 7 8 9 10 11 12 13 14 15 16 17 18 19 20 21 22 23 24 25 26 27 28 29 30 31 32 33 34 35 36 37 38 39 40 41 42 43 44 45 46 47 48 49 50 51 52 53 54 55 56
For Peer Review
40 cm below the mineral-peat interface (slotted section located in the underlying mineral
183
deposits). This instrumentation was the best compromise for representing the surface
184
water table, while avoiding surface flow (in the top 50 cm of the live organic deposits),
185
therefore reflecting the true hydraulic gradients within the peatland. Transect surface and
186
elevation of all the piezometers were surveyed using a differential GPS (R8 GNSS). The
187
vertical precision of these measurements is approximately 1 cm in static mode (USGS,
188
2013). It is suspected however that the highly variable small-scale topography of the
189
organic deposits probably induces a larger error. At four transects in the Becancour
190
region (LR1, V1, V2, and SSY), the elevation of the shallow aquifer piezometer (no.1)
191
was estimated from a LiDAR survey because deciduous trees prevented a precise
192
measurement with the differential GPS. The vertical precision of the LiDAR
193
measurements is estimated at 26 cm (Hodgson and Bresnahan, 2004).
194 195
3.2 Field measurements
196
The thickness of the organic deposits was determined using a standard Oakfield soil
197
sampler every 50 m on all transects. At the time of sampling, the type of underlying
198
mineral deposits was estimated in the field using a finger rub test. Fourteen holes were
199
drilled using a portable pionjar drill in the Abitibi region close to station no.1 and
200
between stations no.1 and 2 at the LB1, LC, SMB, SN, and SS sites to investigate the
201
stratigraphy of the mineral deposits underneath the peatland. These pionjar holes reached
202
a maximum of 8.5 m depth (LB1 and SMB sites). In the Becancour region, pionjar
203
drilling was not able to penetrate below the organic deposits because of the presence of
204
compact till or boulders.
205 3 4 5 6 7 8 9 10 11 12 13 14 15 16 17 18 19 20 21 22 23 24 25 26 27 28 29 30 31 32 33 34 35 36 37 38 39 40 41 42 43 44 45 46 47 48 49 50 51 52 53 54 55 56
For Peer Review
206
Water levels were measured monthly in all piezometers from May to November 2011
207
using a manual water level tape (precision 0.5 cm). The water level surveys in each
208
region were conducted within a span of 2-3 days. Campaigns started in early May 2011
209
(May 3rd in Abitibi and May 11th in Becancour) and ended in mid-November
210
(November 13 in Abitibi and November 18 in Becancour). Water levels were therefore
211
measured outside of the snow accumulation period (cf. Figure 2) and there was no ice in
212
the organic deposits during the entire study period. Although an effort was made to
213
perform the measurement campaigns during dry periods, there could have been
214
occasional minor rain events. It is hypothesized that these did not bias the results. Lateral
215
and vertical hydraulic gradients were calculated using the monthly head values:
216 217
ilat((i)-(i+1)) = (hi - hi+1) / L(i)-(i+1) (1)
218
ivert = (hM - hP) / LM-P (2)
219 220
where ilat is the lateral hydraulic gradient between the peat piezometers located at stations
221
i and i+1 (m/m) (ilat is positive from the aquifer to the peatland), hi is the hydraulic head
222
in the peat at station i and hi+1 is the hydraulic head in the peat at station i+1 (m), L(i)-(i+1)
223
is the lateral distance between stations i and i+1 (m), ivert is the vertical hydraulic gradient
224
between the piezometer located in the peat and the piezometer located in the underlying
225
mineral deposits (m/m) (ivert is positive from the underlying mineral deposits to the
226
peatland), hP is head in the peat (m), hM is the head in the underlying mineral deposits
227
(m), and LM-P is the vertical distance separating the two piezometers at one station (m).
228 3 4 5 6 7 8 9 10 11 12 13 14 15 16 17 18 19 20 21 22 23 24 25 26 27 28 29 30 31 32 33 34 35 36 37 38 39 40 41 42 43 44 45 46 47 48 49 50 51 52 53 54 55 56
For Peer Review
Because of the error on the relative elevation of the peatland stations (+/- 1 cm) and on
229
the head measurements (+/- 0.5 cm), a vertical hydraulic gradient is considered only if the
230
head difference exceeds 2 cm.
231 232
Each transect had one piezometer nest equipped with pressure transducers (Solinst)
233
recording hourly hydraulic heads in the peatland and in the underlying mineral deposits.
234
These transducers were located at different positions in the transects to provide additional
235
insight into the degree of vertical connectivity at various stations.
236 237
Slug tests were performed on eight of the twelve transects to measure peat hydraulic
238
conductivity. Piezometers were temporally installed in the organic deposits to perform
239
slug tests at different depths (0.50-0.75, 0.74-1.00, 1.00-1.25, and >1.25 m from the peat
240
surface) between stations 2 and 3. A pressure transducer (INW PT2X, length 12 cm,
241
diameter 1.9 cm) dropped inside the piezometer acted both as an inserted slug and as a
242
logger of heads (initial heads were measured using the manual water level tape). The
243
resulting head differences were small (on average 11.5 cm) and this was considered
244
favorable to minimize potential compression effects. In total, 41 tests were performed,
245
but only 21 provided data that could be interpreted. For the successful tests, hydraulic
246
conductivity was calculated using the Bouwer and Rice (1976) method. In order to
247
produce reliable estimates of hydraulic conductivity, slug test response-time curves were
248
recorded until at least 90% recovery. The tests took between 12 and 5 870 sec to reach
249 90% completion. 250 251 3 4 5 6 7 8 9 10 11 12 13 14 15 16 17 18 19 20 21 22 23 24 25 26 27 28 29 30 31 32 33 34 35 36 37 38 39 40 41 42 43 44 45 46 47 48 49 50 51 52 53 54 55 56
For Peer Review
4. Results and discussion
252
4.1 Stratigraphic contexts and hydraulic properties
253
The studied peatlands from the Abitibi region (Figure 4 a-f) have developed on the
Saint-254
Mathieu-Berry esker slopes (SMB) or the Harricana Moraine slopes (SN, SS, LC, LB1,
255
LB2). With the exception of the LB1 site, elevation decreases along the transects for all
256
peatlands in this region. Maximum peat thickness on the six Abitibi transects is 4.5 m at
257
the SS site. At SN, till was found only 1-1.5 m under the sand whereas the underlying
258
sand is more than 20 m thick close to the peatland border at LB1 and LB2 according to a
259
regional-scale geological model (Cloutier et al., 2013). The SMB peatland is the only site
260
where the glaciolacustrine clay was found directly under the peat deposits (Figure 4d).
261
This is consistent with the upper limit of clay that rarely exceeds 320 m in the region
262
(Nadeau, 2011). On transects LB1 and LC, and to a lesser extent on transect SMB,
263
mineral deposits under the peat form plateaus close to the esker or moraine (e.g.,
264
Figure 4a, 4c, and 4d). These relatively flat plateaus start approximately 30 m from the
265
peatland margin and extend 80 m (SMB) to 150 m (LC1) beyond station no.1. These
266
plateaus and the irregularities in the peatland bottom observed in SN and SS sites
267
(Figure 4e, and 4f) were created by eolian sand deposits (Nadeau, 2011).
268 269
The Becancour peatlands have developed in depressions within the surface deposits
270
(Figure 4g-l). At several sites peat topography slightly increases from the shallow
271
aquifer–peatland interface towards the peatland center (e.g., Figure 4g, 4h, and 4j). The
272
maximum peat thickness on the six Becancour transects was 4.3 m at the SSY site where
273
portions of the transect lied directly on clay deposits (Figure 4j). On all the other
274 3 4 5 6 7 8 9 10 11 12 13 14 15 16 17 18 19 20 21 22 23 24 25 26 27 28 29 30 31 32 33 34 35 36 37 38 39 40 41 42 43 44 45 46 47 48 49 50 51 52 53 54 55 56
For Peer Review
Becancour transects, the organic deposits have accumulated on sand and gravel deposits.
275
A regional-scale stratigraphic model developed by Larocque et al. (2013b) shows that the
276
peatland at sites LR1 and LR2 (Figure 4g, and 4h) has developed on a 9 m thick sand
277
deposit. At the MB and V1 sites, a 1 m layer of compact till was found underneath 6
278
to10 m of sands and gravel at the peatland margin (Figure 4i and 4k). At the V2 site
279
(Figure 4l), the sand layer was very thin and the organic deposits were almost in direct
280
contact with the compact till (see Larocque et al., 2013b for a detailed stratigraphic
281
model of the Villeroy peatland). At the V1 and V2 sites, permeable Quaternary marine
282
deposits are overlain by parabolic dunes of eolian deposits (Filion, 1987), whereas on the
283
other Becancour region transects the Quaternary deposits are associated with glacial
284
deposits (Larocque et al., 2013a).
285 286
Hydraulic conductivities obtained with the slug tests range from 1.7x10⁻⁷ m/s (LC site in
287
Abitibi at depth 0.75-1.00 m) to 1.2x10⁻⁴ m/s (MB site in Becancour at depth
0.50-288
0.75 m) (Table 1). Values from the Abitibi peatlands at 0.50-0.75 m depth appear to be
289
lower than in the Becancour peatlands, but the sample size was too small to confirm a
290
significant difference. Hydraulic conductivity in the top 0.5 m of organic deposits is
291
expected to be much higher (e.g., Rosa et al., 2007; Levison et al., 2013). These upper
292
peatland layers can have a large influence on runoff. Peat hydraulic conductivities
293
generally decrease with depth from 0.5 m, and the lowest values were measured below
294
1 m. However, it is also possible that lower hydraulic conductivities occur closer to the
295
bottom of the peat. In this case, the peat functions as a partially impermeable layer
296
(Johansen et al., 2011). The results showed clearly that hydraulic conductivities are
297 3 4 5 6 7 8 9 10 11 12 13 14 15 16 17 18 19 20 21 22 23 24 25 26 27 28 29 30 31 32 33 34 35 36 37 38 39 40 41 42 43 44 45 46 47 48 49 50 51 52 53 54 55 56
For Peer Review
highly variable between transects and the connections could also vary significantly within
298
each transect. Similar lateral and vertical heterogeneity in hydraulic conductivity has
299
been observed in other peatlands (e.g., Fraser et al., 2001; Dempster et al., 2006).
300 301
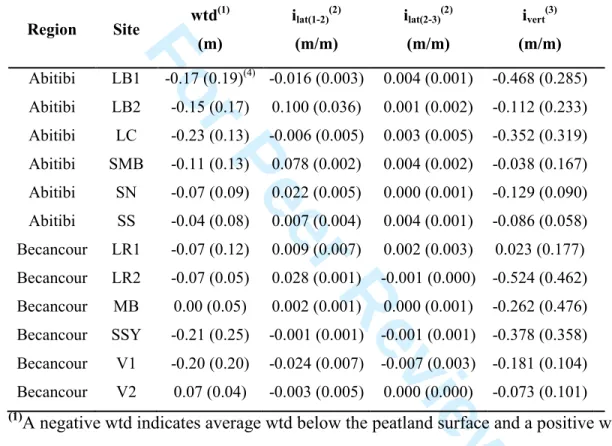
4.2 Lateral flow connections
302
The water table depths (wtd) within the organic deposits follow peat topography closely
303
(Figure 4). Average depths ranged from -0.23 m (LC site) to 0.07 m (V2 site) relative to
304
the ground surface (Table 2). The average wtd was negative (i.e., below the surface) for
305
all the Abitibi transects. In the Becancour region, the average wtd was negative for all
306
sites except at the MB site (at or near the peat surface) and at the V2 site (on average
307
0.07 m above the peat surface). Wtd were generally deeper in Abitibi than in Becancour
308
peatlands. This could be linked to the more humid conditions that occurred in the
309
Becancour region during the 2011 growing season, but it is also possible that the slope
310
peatlands simply drain better than the depression peatlands.
311 312
Hydraulic heads in the shallow aquifer (station no.1) were higher than those of stations
313
no.2 at LB2, SMB, SS, and SN (Abitibi), as well as LR1, LR2, and MB (Becancour) (see
314
Figure 4). The average hydraulic heads in the shallow aquifer varied between -3.41 m
315
below the surface at the V1 site and equal to the surface at the MB site. The amplitude of
316
head variations in the shallow aquifer is maximum at the SN site (1.29 m) and minimum
317 at the SMB site (0.14 m). 318 319 3 4 5 6 7 8 9 10 11 12 13 14 15 16 17 18 19 20 21 22 23 24 25 26 27 28 29 30 31 32 33 34 35 36 37 38 39 40 41 42 43 44 45 46 47 48 49 50 51 52 53 54 55 56
For Peer Review
The average hydraulic gradients from May to November 2011 between stations no.1 and
320
2 (ilat(1-2)) show that 7 out of the 12 transects (LB2, SMB, SS, and SN in Abitibi; LR1,
321
LR2, and MB in Becancour) had flow directions from the shallow aquifer to the peatland.
322
Sites LB1 and LC (Abitibi), as well as SSY, V1, and V2 (Becancour), had flow directions
323
from the peatland to the shallow aquifer. The average hydraulic gradients between
324
stations no.2 and no.3 (ilat(2-3)) were towards the peatland center on 6 transects (LB1,
325
LB2, LC, SMB, and SS in Abitibi; LR1 in Becancour). They were in the direction of the
326
shallow aquifer on three transects (LR2, SSY, and V1 in Becancour), and equal to zero
327
on three other transects (SN in Abitibi; MB and V2 in Becancour). The lateral gradients
328
between the aquifer and the peatland were larger than the first gradients within the
329
peatland with ilat(1-2) ranging from -0.016 (LB1) to 0.100 (LB2) and ilat(2-3) ranging from
-330
0.007 (V1) to 0.004 (LB1 and SMB).
331 332
The lateral hydraulic gradients (ilat) observed at the peatland margin i.e., between stations
333
no.1 and 3, suggest four types of lateral flow (Figure 5): 1) parallel horizontal inflow
334
(lpar_in) where groundwater flows from the shallow aquifer into the peatland, and towards
335
the peatland center; 2) convergent horizontal flow (lconv) where groundwater flows from
336
the shallow aquifer to the peatland where it converges with water flowing from the
337
peatland center to the peatland margin; 3) parallel horizontal outflow (lpar_out) where
338
peatland water flows out of the organic deposits and into the shallow aquifer; and 4)
339
divergent horizontal flow (ldiv) where water flows both towards the peat and towards the
340
surface aquifer, and flow from the peatland to the shallow aquifer is possible despite the
341
inverse topographic gradient. The different types of lateral connections were generally
342 3 4 5 6 7 8 9 10 11 12 13 14 15 16 17 18 19 20 21 22 23 24 25 26 27 28 29 30 31 32 33 34 35 36 37 38 39 40 41 42 43 44 45 46 47 48 49 50 51 52 53 54 55 56
For Peer Review
reflected by different geochemical signatures that assessed the degree (or lack) of
343
connection between the surface aquifers and the peat water (see Ferlatte, 2014; results not
344
reported here).
345 346
Four out of six transects in the Abitibi region (LB2, SN, SS, and SMB) showed lpar_in
347
horizontal flow. At the SN site, despite the null-value of the lateral gradient between
348
station no.2 and no.3, the hydraulic gradient beyond station no.3 was oriented towards the
349
peatland center and suggests a horizontal inflow. This horizontal flow is representative of
350
flow-through systems typical of slope peatlands (Kehew et al., 1998). Peatlands located
351
on esker and moraine slopes in Abitibi received water laterally from the shallow aquifer,
352
and this water flows through the organic deposits towards small streams at the other edge
353
of the peatland. Since all transects were set up parallel to the flow, the hydraulic gradients
354
capture this flow pattern.
355 356
Three transects in the Becancour region showed lconv flows (LR1, LR2, and MB). These
357
depression peatlands have raised surface topography with piezometric mounds that drive
358
water to flow towards the lower surrounding lagg. From that point, water generally stays
359
above the peat surface and flows parallel to the shallow aquifer–peatland limit towards
360
the surface flow outlet of the peatland.
361 362
The lpar_out flows were observed in three Becancour transects (SSY, V1, and V2),
363
although they occasionally showed lconv. As with the lconv case, these depression peatlands
364
have also raised surface topography with piezometric mounds that drive water towards
365 3 4 5 6 7 8 9 10 11 12 13 14 15 16 17 18 19 20 21 22 23 24 25 26 27 28 29 30 31 32 33 34 35 36 37 38 39 40 41 42 43 44 45 46 47 48 49 50 51 52 53 54 55 56
For Peer Review
the peatland margins. However, water does not converge with inflowing groundwater
366
from the aquifer, but rather flows into the surrounding sand deposits. These peatland
367
outflows are not caused by local groundwater level drawdowns from pumping in the
368
shallow aquifer (pumping for large volumes in these aquifers is unlikely because they do
369
not represent significant reservoirs). They appear to be determined by intermediate scale
370
groundwater flow directions driven by topography and hydrology. This type of flow
371
direction was observed by Dempster et al. (2006).
372 373
The ldiv flows were observed on only two transects in Abitibi (LB1 and LC). This type of
374
flow is common in drier climates and with vegetation control of hydraulic depression on
375
wetland edges (Winter, 2001). Ferone and Devito (2004) have reported similar conditions
376
of divergent flow in a Boreal Plain depression peatland located close to a moraine. These
377
conditions cannot be invoked exclusively for LB1 and LC since they are set in similar
378
conditions to the other Abitibi sites. The observed divergent flows could be related to the
379
presence of shallow peat depths over mineral plateaus observed at these two sites (cf.
380
Figure 4).
381 382
No significant lateral flow reversals occurred during the study period, although they were
383
locally and episodically observed at some stations in both regions (LB2, LC, SN, LR1,
384
V1, and V2). These occasional changes are probably related to seasonal transitions from
385
wet to dry periods (Ferone and Devito, 2004; Mouser et al., 2005).
386 387
4.3 Vertical flow connections
388 3 4 5 6 7 8 9 10 11 12 13 14 15 16 17 18 19 20 21 22 23 24 25 26 27 28 29 30 31 32 33 34 35 36 37 38 39 40 41 42 43 44 45 46 47 48 49 50 51 52 53 54 55 56
For Peer Review
Although peatland hydrology is mainly controlled by lateral hydraulic gradients, Reeve et
389
al. (2000) have shown that aquifer–peatland systems can also receive water from or
390
provide water to the underlying mineral deposits. Here, vertical hydraulic gradients
391
between the peatland piezometer and the piezometer in the underlying mineral deposits
392
are used to assess possible vertical flow connections. However, a vertical hydraulic head
393
gradient does not necessarily indicate the presence of vertical flow, as the presence of
394
peat layers with lower hydraulic conductivity can inhibit water flow.
395 396
The vertical hydraulic gradients (ivert) observed can indicate three types of vertical flow:
397
1) the head gradient between the underlying mineral deposits and the peat is downwards,
398
suggesting peatland water flowing towards the underlying mineral deposits (vdown); 2) the
399
head gradient between the mineral and organic deposits is upwards, suggesting vertical
400
groundwater flow from the underlying mineral deposits to the peatland (vup); and 3) the
401
head difference between the mineral and organic deposits is close to zero and vertical
402
flow is considered negligible (v0).
403 404
The vertical flow connections calculated from all piezometric stations and for all seven
405
months are dominated by vdown at all sites except at the LR1, SMB, and V2 transects
406
(Table 3). The vup vertical flow is observed at three sites (LB2, SMB, and LR1) and was
407
only recorded on one occasion at V1 (May) and LR2 (November). Most of the vup flows
408
were recorded near the shallow aquifer, in sites with lpar_in, lpar_out, and lconv lateral flow
409
connections. Stations without vertical hydraulic gradients (v0) were more frequent at the
410
sites with lconv lateral flow conditions. Settings with vdown occurred at all transect stations.
411 3 4 5 6 7 8 9 10 11 12 13 14 15 16 17 18 19 20 21 22 23 24 25 26 27 28 29 30 31 32 33 34 35 36 37 38 39 40 41 42 43 44 45 46 47 48 49 50 51 52 53 54 55 56
For Peer Review
412
Figure 4 shows that hydraulic heads in the underlying mineral deposits were generally
413
lower than the peatland heads in the Abitibi region. Heads in the underlying mineral
414
deposits are not available for stations 3, 4, and 5 at SMB because the organic deposits lie
415
on clay deposits. In the Becancour region, hydraulic heads in the underlying mineral
416
deposits are lower than those in the peatland at LR2, SSY, and V1. They were mostly
417
equal at LR1 and MB, and slightly lower at V2. Hydraulic head variations in the
418
underlying mineral deposits from May to November were generally larger than those in
419
the peatland, especially at sites LB1, LB2, LR2, V1, and V2. The average ivert was
420
downwards for 11 of the 12 transects (the exception is at LR1). The average gradients
421
vary from -0.524 (LR2) to 0.023 (LR1) (Table 2). These high vertical hydraulic gradients
422
are likely to be the result of the larger hydraulic conductivity in the underlying mineral
423
deposits (Reeve et al., 2000). The highest hydraulic gradients could also indicate
424
confined flow conditions in the underlying mineral deposits, caused by the low hydraulic
425
conductivity of the more decomposed peat layers found at the bottom of the peatland.
426 427
The vup conditions can be explained in part by the transect location within local or
428
intermediate scale recharge–discharge conditions (Tóth, 1999; Winter and LaBaugh,
429
2003). For all Abititi sites, recharge occurs at the esker crest (250-3000 m upgradient)
430
and the peatland is a lateral inflow discharge area. When vertical peat-mineral hydraulic
431
connectivity exists, upward flow can occur in these conditions. In Becancour, three
432
transects show upward flows. LR1 and LR2 are not located near a topographic high,
433
while V1 is a lateral outflow discharge area. These upwad flows could be due to
434 3 4 5 6 7 8 9 10 11 12 13 14 15 16 17 18 19 20 21 22 23 24 25 26 27 28 29 30 31 32 33 34 35 36 37 38 39 40 41 42 43 44 45 46 47 48 49 50 51 52 53 54 55 56
For Peer Review
intermediate-scale discharge conditions. Since vertical flow conditions can occur at any
435
station, the morphology of the underlying deposits and the presence of macropore flow
436
(Rossi et al., 2012) probably also play an important role.
437 438
Vertical flow reversals can occur when there is a change in the water table head relative
439
to the head in the underlying mineral deposits (Siegel et al., 1995; Devito et al., 1997).
440
This condition generates exchanged water. Flow reversals can also occur when there is a
441
change in water table head relative to a no-flow lower boundary such as clay (Fraser et
442
al., 2001), but does not include a vertical water flow. In this study, flow reversals were
443
observed many times at the LR1 site (all stations except no.6), but also occurred at least
444
once at LB2, LR2 and V2, from May to November. Several authors noticed vertical flow
445
reversals during sustained dry periods (e.g., Fraser et al., 2001). This was not what
446
happened at LB2 where flow was almost always upwards, except in August and
447
September where it was downwards. Lower heads in the esker aquifer late in the summer
448
were probably responsible for these flow reversals. The humid meteorological conditions
449
in the Becancour region are unlikely to have triggered flow reversals. They could have
450
resulted from ephemeral local scale groundwater upward flow equilibrating with a local
451
and temporary water deficit in the upper peat (Reeve et al., 2001). A larger number of
452
flow reversals might have been identified had the water depth survey been conducted
453
more frequently than once a month.
454 455
If the peatland is disconnected from the underlying mineral deposits, head variations in
456
the underlying mineral deposits should not be correlated with head variations in the peat
457 3 4 5 6 7 8 9 10 11 12 13 14 15 16 17 18 19 20 21 22 23 24 25 26 27 28 29 30 31 32 33 34 35 36 37 38 39 40 41 42 43 44 45 46 47 48 49 50 51 52 53 54 55 56
For Peer Review
(Mouser et al., 2005). To verify whether this was the case in the studied peatlands, hourly
458
head time series from the piezometer nest instrumented with a data logger were compared
459
on all the transects. A simultaneous reaction of peatland and mineral heads to rain events
460
near the peatland margins can be either related to direct transmission of a pressure pulse
461
within the peat to the underlying deposits, or to simultaneous but independent
462
transmission from the shallow aquifer of a pressure pulse within the peat and within the
463
mineral deposits. To assess when a connection was probable, linear regressions were
464
calculated between head time series from the peatland and head time series from the
465
underlying mineral deposits. R2, considered a measure of the intensity of the hydraulic
466
connection, varied from 0.23 at station no.6 of the LC site to 1.00 at station no.2 of the
467
LR1 site (Table 4). The largest R2 values were observed in the Becancour region, with the
468
exception of the V2 site where vertical connections were apparently lower (0.71). As the
469
distance from the peatland margin increases, head variations tend to become less
470
synchronized, and the responses to precipitation events were lessened and delayed (see
471
Figure 6 for examples at LB1 station no.6 and LR2 station no.2). This trend holds true for
472
all sites except SMB and LR1. It could result from the generally decreasing sand/gravel
473
thickness underneath the peatland, from the increasing peat thickness along the transects,
474
and from the decreasing peat hydraulic conductivity with depth.
475 476
Darcy’s law was used to estimate the amount of vertical flow across the peat–sand
477
interface. The average hydraulic conductivity from all transects at depths larger than 1 m
478
and the average vertical hydraulic gradient for stations no.2 and 3 where the highest
479
connectivity was observed were used to calculate the vertical flows. The results showed
480 3 4 5 6 7 8 9 10 11 12 13 14 15 16 17 18 19 20 21 22 23 24 25 26 27 28 29 30 31 32 33 34 35 36 37 38 39 40 41 42 43 44 45 46 47 48 49 50 51 52 53 54 55 56
For Peer Review
average outflows from the peatland to the underlying aquifer of 28 mm in Abitibi and of
481
38 mm in Becancour over the May-November 2011 period under study. These values
482
appear to be very high, especially in Abitibi where net precipitation was 48 mm from
483
May to November 2011 (net precipitation over this same period was 399 mm in
484
Becancour).
485 486
4.4 Implications for peatland management
487
The stratigraphic contexts of the 12 studied transects indicate that peatlands are often
488
underlain by permeable material. In these conditions, the decreasing thickness of the
489
deposits and the low permeability of the bottom peat layers could limit exchanged
490
vertical flows. This limited vertical connectivity, combined with the possible presence of
491
oxidized sand below the peatland, could explain how peat accumulation was initiated and
492
maintained through the centuries. These results have important implications for peatland
493
management since they indicate that a majority of slope and depression peatlands are
494
connected to surface aquifers. Lowering groundwater levels within a surface aquifer (e.g.
495
from increased pumping) could impact the peatland water budget, either through reduced
496
groundwater inflow (lpar_in and lconv) or through increased peatland outflow (lpar_out and
497
ldiv).
498 499
The results of this study show very clearly that the Abitibi slope peatlands are located in
500
an intermediate scale recharge–discharge setting and are connected to groundwater
501
reservoirs in esker aquifers. Vertical inflow to these peatlands was observed only on two
502
transects. Most transects show downward flow from the organic deposits to the aquifer,
503 3 4 5 6 7 8 9 10 11 12 13 14 15 16 17 18 19 20 21 22 23 24 25 26 27 28 29 30 31 32 33 34 35 36 37 38 39 40 41 42 43 44 45 46 47 48 49 50 51 52 53 54 55 56
For Peer Review
with a decreasing connectivity with distance from the peatland margins. This difference
504
with the presence of vertical inflows for slope peatlands suggested by Winter (2001)
505
probably stems from the highly permeable esker deposits that favor horizontal
506
groundwater inflow, and that in turn translate to a dominance of lpar_in lateral inflow
507
conditions.
508 509
In the Becancour depression peatlands, the SSY, V1, and V2 transects are located in local
510
discharge settings and feed the shallow aquifer with lpar_out flow conditions. In these
511
peatlands, precipitation is probably the main water source for peatland development and
512
maintenance. This corresponds to the typical definition of a bog. The other Becancour
513
transects (LR1, LR2, and MB) are clearly discharge sites from the neighboring mineral
514
deposits, but could also receive intermediate scale groundwater discharge. This translates
515
into lconv lateral flow conditions where only the lagg portion of the peatland receives
516
groundwater. In these peatlands, lateral groundwater inflow probably represents an
517
important water source for peatland development and maintenance. The distinction
518
between the two flow types in depression peatlands probably depends on the intermediate
519
scale groundwater flow directions driven by topography and hydrology.
520 521
It is evident that peatland and surface aquifers must be managed in a conjunctive manner
522
to prevent lowering of heads either in the surface aquifer or in the peatland. For example,
523
lowering of heads in the surface aquifer, due to a succession of dry periods or to pumping
524
increases, could have a direct impact on most of the studied peatlands. The marginal fen
525
portions of the Abitibi slope peatlands are probably least vulnerable to a long dry period
526 3 4 5 6 7 8 9 10 11 12 13 14 15 16 17 18 19 20 21 22 23 24 25 26 27 28 29 30 31 32 33 34 35 36 37 38 39 40 41 42 43 44 45 46 47 48 49 50 51 52 53 54 55 56
For Peer Review
because of the significant buffering capacity of the large groundwater flow systems
527
represented by eskers (Winter, 2000). In contrast, the lagg portions of some of the
528
Becancour depression peatlands are likely very vulnerable to such a change because of
529
the local recharge–discharge setting. The ombrotrophic portions of the peatlands in both
530
regions depend primarily on precipitation for their water supply and are probably highly
531
vulnerable to climate change (Winter, 2000). In other wetland settings, differences in
532
sources of water to wetlands could imply that they would require different techniques to
533
protect their water supply and water quality (Winter et al., 2001).
534 535
The main anthropogenic threat to the Abitibi peatlands is probably a reduction in esker
536
piezometric heads that would lead to less groundwater discharge through springs and
537
seepages areas. A reduction of this sort could be induced by pumping large volumes of
538
water from the highly productive esker aquifers that are already solicited for drinking
539
water purposes and water bottling (Cloutier et al., 2013). In the Becancour region, threats
540
to peatlands are mostly from changes in land use (Avard et al., 2013), such as draining
541
agricultural fields (this can limit aquifer recharge) and cranberry farming (this can modify
542
local recharge patterns). Drainage within a peatland can also have a significant impact on
543
aquifer–peatland interactions. Direct drainage is observed mostly in the Becancour
544
region, in connection with the expansion of intensive agriculture and cranberry
545
production. A lowering of peatland heads due to peat drainage can trigger tree growth
546
(Frankl and Schmeidl, 2000; Pellerin and Lavoie, 2003) and limit or stop peat
547
development. If groundwater levels in the shallow aquifer were to be significantly
548
reduced, peatlands could transition to the parallel horizontal outflow (lpar_out) category.
549 3 4 5 6 7 8 9 10 11 12 13 14 15 16 17 18 19 20 21 22 23 24 25 26 27 28 29 30 31 32 33 34 35 36 37 38 39 40 41 42 43 44 45 46 47 48 49 50 51 52 53 54 55 56
For Peer Review
550
5. Conclusion
551
The objectives of this research were 1) to better understand aquifer–peatland connections
552
and how these may be predicted by geology and geomorphic location and 2) to provide a
553
multi-site comparison basis for aquifer–peatland connections in glacial geological
554
settings. Twelve transects were instrumented, characterized, and monitored through a
555
seven-month period in the Abitibi and Becancour regions of southern Quebec. Four types
556
of lateral flow connections were identified, lpar_in with parallel groundwater inflow and
557
peatland flow within the organic deposits, lconv with convergent lateral flow connections,
558
lpar_out with parallel horizontal outflow, and ldiv with diverging flow, both towards the
559
peatland and towards the surface aquifer. Esker slope peatlands in Abitibi were
560
predominantly lpar_in type, while 50% of the depression peatlands in Becancour were
561
lpar_out and 50% were lconv type. Seven of the twelve transects receive water from the
562
shallow aquifer. Downward hydraulic gradients between the peat and the underlying
563
mineral deposits suggest the presence of predominantly downward vertical flow, with
564
decreasing vertical connectivity as the distance from the peatland margins increases.
565 566
These results have important implications for peatland management. Because a majority
567
of peatlands are connected to surface aquifers and most of the water input is from lateral
568
groundwater inflow, a decrease in groundwater levels surrounding the peatland will have
569
a direct impact on hydrological conditions within the peatland. This decrease could be
570
triggered by multi-year dry conditions, increased pumping, or land use changes. Over the
571
long term, such changes could impact peat development and sustainability.
572 3 4 5 6 7 8 9 10 11 12 13 14 15 16 17 18 19 20 21 22 23 24 25 26 27 28 29 30 31 32 33 34 35 36 37 38 39 40 41 42 43 44 45 46 47 48 49 50 51 52 53 54 55 56
For Peer Review
573
The twelve transects studied here were intended to represent conditions in two
574
geologically and climatically contrasted areas. They illustrate the wide range of
575
hydrogeomorphological settings of peatlands in southern Quebec. This study presents an
576
entirely new data set that can serve as a basis for systematic extrapolation of peatland
577
connectivity in southern Quebec. It is reasonable to assume that other peatlands in similar
578
geomorphological and climate settings would exhibit similar connectivity with the
579
surrounding shallow aquifer. Complementary work is underway on the studied transects
580
to confirm the results presented here with groundwater flow modelling.
581 582
Acknowledgements
583 584
This research was supported by the Fonds de recherche du Québec - Nature et
585
technologies (FRQNT), grant no. 137058. The authors acknowledge the participation of
586
the Quebec Ministry of the Environment (Ministère du Développement durable, de
587
l'Environnement et de la Lutte contre les Changements climatiques) who provided access
588
to the Villeroy peatland and of private owners who allowed access to their property
589
during this project. The authors would also like to thank the anonymous reviewers who
590
provided very useful comments.
591 592 593 3 4 5 6 7 8 9 10 11 12 13 14 15 16 17 18 19 20 21 22 23 24 25 26 27 28 29 30 31 32 33 34 35 36 37 38 39 40 41 42 43 44 45 46 47 48 49 50 51 52 53 54 55 56
For Peer Review
References
594
Avard K, Larocque M, Pellerin S. 2013. Perturbations des tourbières de la région de
595
Bécancour, Centre-du-Québec, entre 1966 et 2010. Le Naturaliste Canadien
596
137 (1): 8-15.
597
Bendell-Young L, Pick F. 1997. Base cation composition of pore water, peat and pool
598
water of fifteen Ontario peatlands: Implications for peatland acidification. Water,
599
Air, and Soil Pollution 96 : 155-173.
600
Bouwer H, Rice RC. 1976. A slug test for determining hydraulic conductivity of
601
unconfined aquifers with completely or partially penetrating wells. Water
602
Resources Research 12 : 423-428.
603
Bragazza L, Gerdol R. 2002. Are nutrient availability and acidity-alkalinity gradients
604
related in Sphagnum-dominated peatlands? Journal of Vegetation Science 13 :
605
473-482.
606
Branfireun BA, Roulet NT. 1998. The baseflow and storm flow hydrology of a
607
precambrian shield headwater peatland. Hydrological Processes 12 : 57-72.
608
Brinson MM. 1993. Changes in the functioning of wetlands along environmental
609
gradients. Wetlands 13: 65-74.
610
Bullock A, Acreman M. 2003. The role of wetlands in the hydrological cycle. Hydrology
611
and Earth System Sciences 7 : 358-389.
612
Cloutier V, Blanchette D, Dallaire PL, Nadeau S, Rosa É, Roy M. 2013. Projet
613
d'acquisition de connaissances sur les eaux souterraines de
l'Abitibi-614
Témiscamingue (partie 1). Rapport final déposé au Ministère du Développement
615
durable, de l'Environnement, de la Faune et des Parcs dans le cadre du
616 3 4 5 6 7 8 9 10 11 12 13 14 15 16 17 18 19 20 21 22 23 24 25 26 27 28 29 30 31 32 33 34 35 36 37 38 39 40 41 42 43 44 45 46 47 48 49 50 51 52 53 54 55 56
For Peer Review
Programme d’acquisition de connaissances sur les eaux souterraines du Québec.
617
Rapport de recherche P001, Groupe de recherche sur l’eau souterraine et Institut
618
de recherche en mines et en environnement, Université du Québec en
Abitibi-619
Témiscamingue. 135 p.
620
Cohen MJ, Brown MT. 2007. A model examining hierarchical wetland networks for
621
watershed stormwater management. Ecological Modelling 201 : 179-193.
622
Daigle JY, Gautreau-Daigle H. 2001. Canadian Peat Harvesting and the Environment.
623
Sustaining wetlands, Issues Paper no. 2001-1, North American Wetlands
624
Conservation Council Comittee, Ottawa, Ontario, Canada. 45 p.
625
Dempster A, Ellis P, Wright B, Stone M, Price J. 2006. Hydrogeological evaluation of a
626
southern Ontario kettle-hole peatland and its linkage to a regional aquifer.
627
Wetlands 1 : 49-56.
628
Devito KJ, Waddington JM, Branfireun BA. 1997. Flow reversals in peatlands influenced
629
by local groundwater systems. Hydrological Processes 11 : 103-110.
630
Drexler JZ, Bedford BL, Scognamiglio R, Siegel DI. 1999. Fine-scale characteristics of
631
groundwater flow in a peatland. Hydrological Processes 13 : 1341-1359.
632
Ducks Unlimited Canada (2006). Conservation plan for wetlands and their adjacent
633
uplands in the administrative region of Centre-du-Québec. Quebec 55 p.
634
Ducks Unlimited Canada (2009). Conservation plan for wetlands and their adjacent
635
uplands in the administrative region of Abitibi-Témiscamingue. Quebec 76 p.
636
Environment Canada. 2012. National Climate Data and Information Archive. Accessed
637
in February 2012. Online: climat.meteo.gc.ca/climateData/canada_f.html.
638 3 4 5 6 7 8 9 10 11 12 13 14 15 16 17 18 19 20 21 22 23 24 25 26 27 28 29 30 31 32 33 34 35 36 37 38 39 40 41 42 43 44 45 46 47 48 49 50 51 52 53 54 55 56
For Peer Review
Ferlatte M. 2014. Hydrogéochimie des systèmes aquifère-tourbière et traceurs des
639
processus d’échange dans deux contextes géo-climatiques du Québec méridional.
640
MSc thesis, Université du Québec à Montréal, Département des sciences de la
641
Terre et de l’atmosphère, 77 p.
642
Ferone JM, Devito KJ. 2004. Shallow groundwater–surface water interactions in pond–
643
peatland complexes along a Boreal Plains topographic gradient. Journal of
644
Hydrology 292 : 75-95.
645
Filion L. 1987. Holocene development of parabolic dunes in the central St. Lawrence
646
Lowland, Québec. Quaternary Research 28 : 196-209.
647
Frankl R., Schmeidl H. 2000. Vegetation change in a south German raised bog:
648
ecosystem engineering by plant species, vegetation switch or ecosystem level
649
feedback mechanisms? Flora 195 : 267-276.
650
Fraser CJD, Roulet NT, Lafleur M. 2001. Groundwater flow patterns in a large peatland.
651
Journal of Hydrology 246 : 142-154.
652
Godbout PM, Lamothe M, Horoi V, Caron O. 2011. Synthèse stratigraphique,
653
cartographie des dépôts quaternaires et modèle hydrostratigraphique régional,
654
secteur de Bécancour, Québec Montréal, Québec. 37 p.
655
Hodgson, M.E., Bresnahan, P. 2004. Accuracy of airborne Lidar-derived elevation:
656
empirical assessment and error budget. Photogrammetric Engineering & Remote
657
Sensing 70(3) : 331-339.
658
Johansen OM, Pedersen ML, Jensen JB. 2011. Effect of groundwater abstraction on fen
659
ecosystems. Journal of Hydrology 402(3–4): 357-366.
660 3 4 5 6 7 8 9 10 11 12 13 14 15 16 17 18 19 20 21 22 23 24 25 26 27 28 29 30 31 32 33 34 35 36 37 38 39 40 41 42 43 44 45 46 47 48 49 50 51 52 53 54 55 56
For Peer Review
Kehew AE, Passero RN, Krishnamurthya RV, Lovett CK, Bettsc MA, Dayharsh BA.
661
1998. Hydrogeochemical interaction between a wetland and an unconfined glacial
662
drift aquifer southwestern Michigan. Ground Water 36 : 849-856.
663
Larocque M, Gagné S, Tremblay L, Meyzonnat G. 2013a. Projet de connaissance des
664
eaux souterraines du bassin versant de la rivière Bécancour et de la MRC de
665
Bécancour. Rapport final déposé au Ministère du Développement durable, de
666
l'Environnement, de la Faune et des Parcs dans le cadre du Programme
667
d’acquisition de connaissances sur les eaux souterraines du Québec. Montréal,
668
Québec. 219 p.
669
Larocque M, Colpron-Tremblay J, Lavoie M, Tremblay L. 2013b. Écohydrologie de la
670
grande tourbière de Villeroy. Rapport d'activités. Report submitted to the
671
Ministère du Développement durable, de l'Environnement, de la Faune et des
672
Parcs. 61 p.
673
Levison JK, Larocque M, Fournier V, Gagné S, Pellerin S, Ouellet MA. 2013. Dynamics
674
of a headwater system and peatland under current conditions and with climate
675
change. Hydrological Processes 28 : 4808-4822.
676
Mitsch WJ, Gosselink JG. 2007. Wetlands. Wiley. 600 p.
677
Mouser PJ, Hession WC, Rizzo DM, Gotelli NJ. 2005. Hydrology and Geostatistics of a
678
Vermont, USA Kettlehole Peatland. Journal of Hydrology 301 : 250-266.
679
Munger J, Pellerin S, Larocque M, Ferlatte M. 2014. Espèces indicatrices des échanges
680
d'eau entre aquifère et tourbière. Le Naturaliste Canadien 138(1) : 4-12.
681 3 4 5 6 7 8 9 10 11 12 13 14 15 16 17 18 19 20 21 22 23 24 25 26 27 28 29 30 31 32 33 34 35 36 37 38 39 40 41 42 43 44 45 46 47 48 49 50 51 52 53 54 55 56