Development of a Criteria Based Strategic Sourcing Model by
Carlo G. Quiflonez, PE
BA Environmental Engineering, Rice University, 2003 BA Geology, Rice University, 2003
MS Civil & Environmental Engineering, Rice University, 2005
Submitted to the MIT Sloan School of Management and the Department of Engineering Systems in Partial Fulfillment of the Requirements for the Degrees of
Master of Business Administration
and
Master of Science in Engineering Systems
In conjunction with the Leaders for Global Operations Program at the MASSACHUSETTS OF TECHNOLOGYINST E Massachusetts Institute of Technology
June 2013
0 2013 Carlo G. Quiflonez, PE. All Rights Reserved
LIBRARIES
The author hereby grants to MIT permission to reproduce and to distribute publicly paper and electronic copies of this thesis document in whole or in part in any medium now
)dpowjor herpa(tr created.
Signature of Author: Certified by: Certified by: Accepted by: Accepted by: i 2 May 10, 2013 Engineering Systems Division and MIT Sloan School of Management
Stephen C. Graves, Thesis Supervisor
/) Pyofessor, Management Science
David Simchi-Levi, Thesis Supervisor Professor, Engineering Systems Division
Maura Herson, Directorof MBA Program MIT Sloan School of Management
Oli de Weck, Chair, Engineering Systems Education Committee Associate Professor, Aeronautics and Astronautics and Engineering Systems
Development of a Criteria Based Strategic Sourcing Model by
Carlo G. Quinionez, PE
Submitted to the MIT Sloan School of Management and the Department of Engineering Systems on May 10, 2013 in partial fulfillment of the requirements for the degrees of
Master of Business Administration and Master of Science in Engineering Systems.
Abstract:
Strategic sourcing is a key factor in enhancing Nike's competitiveness and organizational and operational performances. As Nike faces increasing pressure to expand margins and reduce source base risk during a climate of volatile commodity prices and rising labor
costs, it is imperative that Nike evolves its strategic sourcing mind-set and advance the decision-making processes. The motivation for the project is to evolve the current strategic sourcing approach at Nike by developing a more effective, efficient, and transparent sourcing process that can be applied throughout all Nike's brands and products. This is being accomplished by developing a criteria based model using Visual Basic and Microsoft Excel. The model takes into account important quantifiable variables
such as total landed costs, country and factory compliance risk, and Nike's
Manufacturing Index (factory performance measurement) to calculate a single output called the Risk Adjusted Total Landed Cost (RATLC). The scope of the project focuses on a specific Nike Brand apparel product classification (fleece) to be able to develop a functional pilot-scale model.
The RATLC methodology and criteria based model is used to develop a case study comparing the sourcing decisions to the model output for fleece in the Fall 2011 Season. The model indicated that Nike had the potential to reduce total landed costs by $25 million and reduce the risk in the factory portfolio by working with factories with higher manufacturing index and lower country risk index scores. Other potential benefits include reduced duty costs, higher quality products, and reduced leadtimes.
The model and methodology is able to help the sourcing team better understand the implications of total landed cost and supply chain risk on their sourcing decisions. With the tool, Nike will be able to understand and reduce the risks and costs associated with selecting a global network of sourcing factories.
Thesis Advisors: Stephen C. Graves
Professor, Management Science David Simchi-Levi
Acknowledgements
I would like to thank everyone at Nike for an outstanding internship, especially my
project manager Leo Saldana, Vice President of Sourcing and Manufacturing Nick
Athanasakos, and project sponsor Nikhil Soares. They were able to develop a project that was well defined, thus enabling me to have an exceptional internship experience. Leo was extremely supportive throughout the project and was not only my direct manager, but also my career counselor, presentation editor, and great life coach. It is going to be a blessing to work with this team in my future career at Nike.
I would like to thank my thesis advisors, professors David Simchi-Levi and Stephen
Graves. Their expertise and knowledge about the project was invaluable especially with their feedback and guidance on the direction my thesis. It was their guidance that helped me have a successful project that added value to Nike. Also, I would like to acknowledge the entire Leaders for Global Operations program for help along the way.
Furthermore, I would like to thank my peers in the LGO program that have acted as sounding boards and critics for my ideas in regards to this project. Robert
Giacomantonio and Marie Wolbert were my project saviors at Nike and continued to help me once I left Portland.
Finally, I would like to thank those that had to put up with my nonsense while attending the program. Katherine, you are an angel and crazy person for the patience, love, and
support you provided along this journey. Mom, Dad, and Juan, thanks for being supportive and not talking me out of getting, yet another degree. Ruca, you helped probably a lot more than your simple dog brain could possibly understand. I love you all.
Table of Contents
A bstract:...3
A cknowledgem ents... 5
Table of Contents... 7
1 Com pany Background ... 10
2 Project Description ... 13
3 Literature and Strategic Sourcing Review ... 15
3.1 Risk M anagement Research ... 16
3.2 Landed Cost Research ... 23
3.3 Chapter Summ ary ... 25
4 Project H ypothesis ... 26
5 Risk and Cost Component Identification and Sources... 27
5.1 Risk M odel Component Identification ... 27
5.1.1 M anufacturing Index... 29
5.1.2 Country Risk Index ... 36
5.1.3 Risk Conclusion... 43
5.2 Total Landed Cost Com ponent Identification... 44
6 Risk M odel Developm ent and Attributes ... 47
6.1 Relevant Risks... 47
6.1.1 Risk Scores... 48
6.2 Failure M odes and Effects Analysis... 50
6.2.1 FM EA Survey ... 52
6.3 Factory Com puted Risk Index... 68
6.4 Chapter Sum m ary ... 71
7 Landed Cost M odel Developm ent ... 73
7.1 North Am erica Total Landed Cost Calculation ... 75
7.2 W estern Europe Total Landed Cost Calculation... 76
7.3 Central and Eastern Europe Total Landed Cost Calculation... 77
7.4 Greater China Total Landed Cost Calculation... 78
7.5 Japan Total Landed Cost Calculation... 79
7.6 Korea (Emerging Market) Total Landed Cost Calculation ... 79
7.7 Brazil (Emerging Market) Total Landed Cost Calculation... 80
7.8 Mexico (Emerging Markets) Total Landed Cost Calculation... 82
7.9 Chapter Summ ary ... 83
8 Risk Adjusted Total Landed Cost Model Development...84
8.1 Risk Adjusted Total Landed Cost Calculation... 84
8.2 Risk Adjusted Total Landed Cost M odel Inputs ... 86
8.2.1 Factory Profile...88
8.2.2 Risk Adjusted Total Landed Cost Inputs ... 90
8.3 Dem and Allocation Optim ization... 92
9.1 Updating Calculation W orksheets ... 101
9.2 Running the Model...105
9.3 Viewing the Results...107
10 Case Study - Fall 2011 Demand Allocation ... 109
10.1 Case Study Data ... 109
10.2 Key Findings ... 110
10.2.1 Production Allocation...110
10.2.2 C ost C om parison ... 113
10.2.3 R isk C om parison ... 116
10.2.4 Leadtime Comparison...119
10.3 Case Study Validation...122
10.4 Conclusion ... 122
11 Conclusions...124
Appendices ... 127
Appendix A - Model Output Example ... 127
Appendix B - Case Study Data/Output...136
W orks Cited...263
List of Figures
Figure 1 -The supply chain risk management process (Christopher, 2011)... 19Figure 2 -Risk Categories and Sub-Categories (Feller, 2008)... 28
Figure 3 -M anufacturing Index Scale & Rating... 30
Figure 4 -Possible Incentives and Sanctions based on MI Rating ... 31
Figure 5 -M anufacturing Index Roadmap... 32
Figure 6 -Quality Metric Calculation (Points and ranges were changed to protect Nike information)... 33
Figure 7 -M anufacturing Sustainability Point Scale... 35
Figure 8 - M anufacturing Index M etrics and Final Score Example ... 35
Figure 9 - Country Risk Index Categories and Score Ranges ... 37
Figure 10 - Country Risk Index Composition... 42
Figure 11 - RI Report Card and Map. (Map does not reflect current RI scores, it is just an ex am ple) ... 4 3 Figure 12 - Supply Chain Risk Factors Compared to Model Risk Factors... 44
Figure 13 - M anufacturing Index and Country Risk Index Components... 48
Figure 14 - M anufacturing Index Risk Scale and Range Descriptions... 49
Figure 15 - Country Risk Index Scale and Range Descriptions... 50
Figure 16 -Nike's Six M arket Geographies... 74
Figure 17 -Cost and Corresponding Risk Category ... 85
Figure 18 -Calculating Risk Adjusted Total Landed Cost (in USD)... 86
Figure 19 -Criteria Based Strategic Sourcing M odel Process M ap ... 87
Figure 20 -FOB Costs Distribution Fitting for Sensitivity Analysis... 96
Figure 21 -Leadtime Data Distribution Fitting for Sensitivity Analysis... 97
Figure 22 - Sensitivity Analysis Tornado Diagram... 98
Figure 23 -Updating Calculation W orksheets...101
Figure 25 -Product Demand Input ... 104
Figure 26 -Input for FOB and Analysis Type ... 105
Figure 27 -Sheet1 Optimization and Results Buttons ... 106
Figure 28 -The Results Worksheets ... 107
Figure 29 -The Optimize Tabs where you can manually adjust allocation...108
Figure 30 -Fall 2011 Actual Fleece Production Allocation...111
Figure 31 -Fall 2011 5% Scenario Fleece Production Allocation...112
Figure 32 -Fall 2011 Total Landed Cost Scenario Comparison Graph...114
Figure 33 -Fall 2011 Regional Duty Costs Comparison between Actual and Modeled S cen ario s...1 15 Figure 34 - Fall 2011 Global Duty Spend Comparison per Manufacturing Country of O rig in ... 1 16 Figure 35 -Fall 2011 Weighted MI Comparison to Actual for Fleece Bottoms...117
Figure 36 -Fall 2011 Weighted MI Comparison to Actual for Fleece Tops...118
Figure 37 -Fall 2011 Leadtime Comparison to Actual for Fleece Bottoms...119
Figure 38 -Fall 2011 Leadtime Comparison to Actual for Fleece Tops ... 120
Figure 39 -Fall 2011 Leadtime Comparison to Actual for Fleece Warm Ups...121
List of Tables
Table 1 -Total Landed Cost Components in Model... 45Table 2 -FMEA Survey Results... 67
Table 3 -CRI Calculation for a Factory in a "Very High" Risk Country ... 70
Table 4 -Overall CRI Score by Risk Category for Example Factory in a "Very High" R isk C ountry ... 70
Table 5 -CRI Calculation for a Factory in a "Medium" Risk Country ... 70
Table 6 -Overall CRI Score by Risk Cateogory for Example Factory in a "Medium" Risk C ou ntry ... 7 1 Table 7 -The Six Geographies and Representing Countries for Model ... 74
T able 8 - M odel Inputs...87
Table 9 -Variables for Sensitivity Analysis... 94
Table 10 -Distribution Definitions for Variables in Sensitivity Analysis ... 98
Table 11 - Sensitivity Analysis Range of RATLC Mean by Variable...100
1 Company Background
Nike, Inc. is the largest seller of athletic footwear and athletic apparel in the world, based in Beaverton, Oregon. Their principal business is the design, development, marketing and selling of their footwear, apparel, equipment and accessories across six geographies: North America, Western Europe, Central and Eastern Europe, China, Japan, and
Emerging Markets (Emerging Markets is a broad group of countries that are foreseen as markets with rapid growth for Nike. Examples include Mexico, Brazil, Argentina, South Korea, India, and Australia). Nike sells their products through Nike owned retail stores and internet sales, and through independent distributors in approximately 190 countries across the globe.
In Nike's last reported fiscal year (May 31, 2011 through May 31, 2012), their revenues were approximately $24 Billion with 43.4 percent gross margins. The United States accounted for approximately 42 percent of the total revenue with three retail customers
accounting for 24 percent of this revenue. Non-US sales accounted for the remaining 58
percent of the total revenue and three customers accounted for 11 percent of these sales.
Nike focuses on offering products within seven primary categories: Running, Basketball, Global Football (Soccer), Men's Training, Women's Training, Sportswear, and Action Sports. Nike also offers products for other sports such as baseball, cricket, golf, lacrosse, American football, tennis, volleyball, and wrestling. In addition to the Nike brand, Nike owns six subsidiaries that are geared towards promoting various other markets. These subsidiaries include:
e Cole Haan: Designs and distributes dress and casual footwear, apparel and
accessories for men and women. Headquartered in New York, New York.
- Converse Inc.: Designs, distributes and licenses athletic and casual footwear,
apparel, and accessories under the Converse, Chuck Taylor, All Star, One Star, Star Chevron, and Jack Purcell trademarks. Headquartered in North Andover, Massachusetts.
" Hurley International LLC: Designs and distributes a line of action sports and
youth lifestyle apparel and accessories. Headquartered in Costa Mesa, California. Jordan Brand: Designs and distributes a line of athletic and casual footwear, apparel, and accessories inspired by legendary NBA basketball player, Michael Jordan. Headquartered in Beaverton, Oregon.
* Nike Golf: Designs and distributions golf inspired footwear, apparel, accessories and equipment. Headquartered in Beaverton, Oregon.
* Umbro International Limited: Designs, distributes, and licenses athletic and casual footwear, apparel, and equipment, primarily for the sport of global football (soccer). Headquartered in Cheadle, United Kingdom.
On May 31, 2012, Nike announced their intention to divest in Cole Haan and Umbro, to allow them to focus on the brands with the largest growth potential and highest returns. At the time of this thesis, buyers for the divested companies have not been reported.
Almost all of Nike's products are produced by factories they contract with outside of the. United States. In fiscal 2012, Vietnam, China, and Indonesia accounted for
approximately 41%, 32%, and 25% of manufactured Nike Brand footwear in the
respective countries. Similarly, most of Nike Brand apparel was manufactured in 28 countries outside of the United States, with the a majority of the production occurring in China, Vietnam, Thailand, Sri Lanka, Malaysia, Indonesia, Turkey, Cambodia, Mexico, and El Salvador. The largest single footwear factory that Nike contracted with accounted
for 5% of the total production and the largest apparel factory contract was responsible for
8% of the produced apparel. Nike has a single manufacturing subsidiary, Nike IHM,
Inc., that only produces and supplies Nike with the Air-Sole cushioning components used in footwear.
Nike is Beaverton, Oregon based corporation founded in 1964 as Blue Ribbon Sports and
1978 as Nike, Inc. by Bill Bowerman (deceased) and Phil Knight (Chairman of the
Board). As of 2011, Mark Parker (President and CEO) manages Nike with 44,000 employees in 842 retail stores, 2 headquarters, 20 distribution and customer service centers, 1 manufacturing facility, over 120 sales offices and showrooms, and approximately 85 administrative offices worldwide.
2 Project Description
Strategic sourcing is a key factor in enhancing Nike's competitiveness and organizational and operational performances. As Nike faces increasing pressure to expand margins and reduce source base risk during a climate of volatile commodity prices and rising labor costs, it is imperative that Nike evolves its strategic sourcing mind-set and advance the decision-making processes. The motivation for the project is to evolve the current
strategic sourcing approach at Nike.
The initial purpose of the project was to develop a more effective, efficient, and transparent sourcing process that can be applied throughout all Nike's brands and
products. As the project progressed, the scope evolved to developing a methodology and tool that will help the sourcing managers and teams create a sourcing game plan based on quantitative methods. The goal is to combine the analytics of the model with the supplier relationship knowledge of the sourcing team to form an optimized supplier portfolio that will benefit Nike in a spectrum of areas including, but not limited to: costs, risks, quality, sustainability, leadtimes, and supplier relations. This is being accomplished by
developing a criteria based model using Visual Basic and Microsoft Excel. The model takes into account important quantifiable variables such as total landed costs, country and factory compliance risk, and Nike's Manufacturing Index (factory performance
measurement). Nike will be able to use this tool through each milestone of their sourcing decisions and can be modified to reach across all of Nike's Product Engines (Footwear, Apparel, Equipment).
The scope of the project will focus on a specific Nike Brand apparel product
classification (fleece) to be able to develop a functional pilot-scale model within the term of the internship. The model will be developed with the ability to be implemented into the footwear technology platform with minimal modifications, and ultimately across Nike brands.
The model was validated using Fall 2011 demand, costs, and allocation data and was compared to Nike's actual sourcing plan for the fleece.
3 Literature and Strategic Sourcing Review
In order to develop the strategic sourcing model and methodology for Nike, it was important to understand what academia and other companies consider important criteria for sourcing strategies. A study, conducted by the Hackett Group, summarized key findings on what companies, inside and outside Nike's industry, thought were the current trends and future direction in global manufacturing. The highlights of the report are (Hackett Group, 2012):
" Global manufacturing sourcing strategies are rapidly evolving in response to
changing demand patterns, cost profiles, currencies, quality and risk.
- A growing number of companies are bringing back manufacturing capacity to developed markets ("reshoring")
* The volume of movement of capacity between low-cost countries is increasing and will be substantially higher than the volume of re-shored capacity;
dominating the global movement of manufacturing capacity.
- Executives are concerned that productivity improvements in China will not keep
pace with wage inflation, influencing China's continued growth rate.
- This trend will lead to acceleration of re-shoring out of China back to developed
markets (though with still a net inflow to China albeit at a much slower rate), and a movement of capacity out of China into other emerging markets.
There are many articles and studies that focus on each of these key points presented by the Hackett Group, but after discussing with the sourcing team, it was concluded that to develop a model that incorporated all of the global trends would be too complex. Rather,
the focus of the sourcing model should be on the important quantifiable sourcing criteria that is perceived as a legitimate strategy for Nike and that holistically accounts for important standards in sourcing for global manufacturing. These components are manufacturing risk, quality, and total landed cost. The following sections describe the literature reviewed on the manufacturing risk, quality, and total landed cost components that influenced the development of the sourcing model.
3.1 Risk Management Research
Reducing cost have been one of the largest trends in manufacturing, which has led to an outsourcing and offshoring strategy that has created more opportunities for a variety of events to disrupt the supply chain. The Hackett Group asked a variety of industry
professionals as the most important decision drivers pertaining to their sourcing strategy.
All of the respondents (100 percent) stated that product quality is an important decision
driver and ninety-five percent said they view supply chain risk as being important
(Hackett Group, 2012). Based on Nike's industry, the quality of the product is viewed as a potential risk. When working with manufacturers, there is an inherent risk that the product (shoe, apparel, or equipment) may be defective which will cause delays in getting the product line to the customer. Therefore, the product quality sourcing strategy will be grouped with risk management sourcing criteria.
An event that could disrupt the supply chain can have substantial repercussions to the organization. Between 1989 and 2000, more than 800 companies announced a supply chain disruption that resulted in a 33 to 40 percent lower stock returns when compared to industry peers (de Waart, 2006). Most executives are aware of supply chain risks, but
few companies actually incorporate risk into their sourcing strategies or try to quantify the impacts of disruptive events. According to the Hackett study, 72 percent of the companies interviewed have not incorporated supply chain risk into their sourcing
strategy, which contradicts the view that 95 percent of the companies view risk as an
important decision driver (Hackett Group, 2012). Even companies that have experienced disruptions do not translate the occurrence into a strategic shift in their sourcing criteria.
A study of procurement and supply chain executives found that less than half of the
represented companies have procedures in place to assess and/or respond to risk, even when 80 percent of those that responded had experienced a supply chain disruption within the last two years (de Waart, 2006).
The hesitation for companies to include risk management strategies within their sourcing decisions is counterintuitive to how humans "normally" act in regards to risk. It is human nature to remember the losses (the downside of risk) more than profits (the upside of risk), therefore it would be expected that executives and sourcing managers would include risk hedging criteria, especially if they have already experience a supply chain outage due to some event (Damodaran, 2008). The possible reasoning behind the contradiction are:
- The separation of management from ownership creates a potential conflict of
interest between the good of the business and the good for the manager. Since it is usually the mangers of the firms that decide how much and how to hedge risk, it is possible that the mangers will hedge risks that the owner would never want hedged in the first place.
- Companies are willing to be more risky as they get wealthy.
- Risk aversion seems to decrease when there is a chance of saving a large sum of
money with a small probability of success.
- When companies who have lost money are presented with choices that allow them
to make their money back in savings.
* Companies often make mistakes in assessing the probabilities of outcomes, underestimating the likelihood of an event occurring. The problem gets worse as the choices become more complex.
Although this behavior is thought to be a paradox to the standard thinking of how
companies are supposed to respond to risk, it occurs far too often across all industries that is should be considered the norm rather than the exception (Damodaran, 2008).
However, there is movement from executives to start incorporating supply chain risk because of evidence that shows how risk mitigation can positively impact their bottom
line. There are many ideas for supply chain risk management programs, but they all share a common theory: Minimizing supply chain risk will result in bottom-line savings
by reducing purchase-price volatility.
A basic layout for a Risk Management approach is shown in the basic process map
Understand the supply chain
impre
[mprove the supply chain
Identify the rcal paths (nodes &
Manage the critical paths
Improve network visibility
Establish a supply chain continuity
team
Work with suppliers and
customers to improve supply chain Frisk management procedures
Figure 1 - The supply chain risk management process(Christopher, 2011)
The basic idea of the risk management approach is to understand who is the supplier you are working with, in what ways are they critical in the supply chain, manage the
relationship, and continuously improve inefficiencies. One of the most complex stages of this process is stage 3, identifying the critical paths. Supply networks are a complex web of interconnected nodes and links in the form of product flowing between facilities (suppliers, distributors, factories, and warehouses). The vulnerability of a supply
network is determined by the risk of failure of these nodes and links (Christopher, 2011). Therefore it is critical to be able to identify how risk can affect the supply chain flow and how can managers make decisions in the present that has the potential of mitigation future disruptions. The work done in this thesis was within this stage of the risk
management process for Nike and there are many methodologies on how it can be approached.
A study done by PRTM suggests that it is necessary to follow an approach that allows for
sound financial decisions but is pragmatic in nature. Their approach has been dubbed "SMART", which is an acronym that stands for the 5 sequential stages of the process: Specific, Measurable, Actionable, Realistic, and Time-Phased. The suggested approach
by PRTM makes risk management a measureable and analytical process rather than
subjective, but the analytics are very high level and may be considered as opinion based rather than supported by calculations. The premise behind the methodology is to identify the important risks of the supply chain, give them a score of 0 to 100 to be able to
prioritize the risks, and then suggest risk mitigation initiatives for the highest rated risks (de Waart, 2006). This is a very simple method for creating a hierarchy structure of risk and is the basic structure for many risk management models.
The Analytical Hierarchy Process and Analytic Network Process presented by Saaty and Vargas builds on basic hierarchy model by introducing discrete and continuous pairwise comparisons between risk factors to establish relations within the structure of the problem (Saaty, 2006). The goal of their method is to be able to measure tangible (physical
objects) and intangible (judgment) events without compromising either. These methods are adequate for establishing a hierarchy of important risks to mitigate, but what Nike wanted to look at was the portfolio of risks involved with working with each
Failure Mode Effects Analysis (FMEA) is a tool used to facilitate risk management decisions. The procedures used to do a FMEA analysis is widely documented and it can be modified to evaluate the risk of manufacturing options (Welborn, 2007). The FMEA process will provide sourcing management with useful information that can reduce the risk-load in working with outsourced facilities by examining all the ways in which a disturbance can occur. For each risk, an estimate is made of its effect on the company, of its seriousness, of its frequency, and of its ability to be detected (Stamatis, 2003). With the output from an FMEA analysis, a portfolio of manufacturing facilities and appropriate risks can be developed and utilized to establish a minimized risked sourcing strategy for Nike.
The challenge in developing a portfolio of manufacturing facilities and their risks, is narrowing the list of risks that should be considered. The common categories of risk to consider include financial risks, schedule risks, legal risks, environmental risks,
sociopolitical risk, project organization risk, and human behavior risk. When evaluating the broad list of risks it is also important to identify them as internal or external risks. With internal risks, the organization has the ability to control the risk, whereas with external risks, managers cannot influence the risks, therefore mitigation measures or sourcing strategies must be incorporated into decision-making that can account for disruption possibilities (Sollish, 2011). In developing a sourcing strategy, Nike was predominately concerned about external risks associated with working with facilities
throughout the globe, therefore the focus of this thesis will be on risks that Nike has no control over.
The risk of working with an outsourced manufacturing facility is based on the
manufacturing country of origin and the facility itself. For instance, a factory can provide the best product on time and have a working environment above standards, but be located in a country with constant political and economical turmoil that can affect the product getting to the final destination. Both risks need to be identified and accounted for to be able to make a sound sourcing decision. There are numerous services that that measure country risk including:
e Bank of America World Information Services
e Business Environment risk Intelligence (BERI)
Control Risks Information Services * Economist Intelligence Unit (EIU)
* Euromoney
Institutional Investor
* Standard & Poor's Rating Group (S&P)
* Political Risk Services: International Country Risk Guide
e Political Risk Services: Coplin-O'Leary Rating System
e Moody's Investment Services
Each of the rating or index providers must merge a range of qualitative and quantitative information into a single rating. Most of the aforementioned services compile monthly data on a variety of political, financial, and economic risk factors to derive a composite-risk index (Erb, 1996). If you intend to engage in long term operations with a supplier in a specific country, emphasis should be placed on political, financial and economical stability of that country, but when dealing with manual manufacturing process and the physical movement of goods, other risks should be included such as country labor compliance, infrastructure, and natural disaster risk (Sollish, 2011). Maplecroft, an online risk service, provides global risk portfolios that includes labor compliance, infrastructure, and natural disaster risk as well as other indices pertaining specifically to supply chain risk analyses (Maplecroft, 2012). Nike currently uses Maplecroft services to develop a Nike specific country risk index that will be utilized in this thesis and will be discussed in Chapter 5.
3.2 Landed Cost Research
Cost is often referred to the overall cost of acquiring the product or service. Too often, cost models include only the material and transportation costs. In order to create a more robust costing model, the analysis should included the "landed cost" which includes the cost of goods, transportation cost, inventory carrying cost, and duty costs. The concept of Total Cost of Ownership (TCO) is usually introduced along with total landed cost as a way to analyze the entire spectrum of value. With TCO, the entire product life cycle cost is considered but it expands to include the on-time delivery, quality levels, risk factors, supplier innovation, technology, and flexibility (Sollish, 2011). Since the products the suppliers provide Nike are not capital intensive equipment, instead short-lived consumer
products, TCO does not pertain to Nike sourcing decisions. The total landed cost model is being used for the sourcing strategy.
When using total landed cost as a sourcing strategy, the goal is to minimize total costs under various constraints. There are multiple mathematical programming methods that are viable for solving the minimization problem. Linear programming (LP) and mixed integer programming (MIiP) are used to solve vendor selection problems in sourcing and reducing costs is the core goal of model formulation. There have been multiple published studies (Wind and Robinson, 1968; More and Fearson, 1973; Pan, 1989) that have
developed LP models with price, quality, and delivery factors for solving the vendor selection problem. MIPs have predominately been used in minimizing the costs
associated with purchasing, inventory and logistics costs given the constraints of vendor capacity and demand satisfaction. The sourcing selection problem is a multi-criteria problem at its core. But multi-criteria techniques are rarely used to solve the problem because a large set of performance criteria must be identified and suitably weighted according to their context-specific importance. Also, the trade-offs between the
conflicting goals of price, quality, delivery performance, etc.... must be extensively analyzed and re-iterated (Wang, 2010). Another method is fuzzy multiple goal programming which utilizes parameters in a model that are uncertain and cannot be precisely estimated. Fuzzy set theory is widely used for formulating problems with insufficient information related to different criteria in real-world decision-making (Wang, 2010). These methods may be useful for the evolution of the project, but for this thesis, linear programming (LP) is capable solving Nike's sourcing strategy.
3.3 Chapter Summary
After reviewing the literature, it was evident that there is not a single method for evaluating cost and risk that is utilized across supply chains. Nike is unique, just like most other companies, therefore, it will be necessary to establish a methodology that is distinctive to its sourcing realm. If Nike can develop a structured approach to identifying the best case sourcing strategy that incorporates risk and cost, they will have a definite advantage over their competition.
4 Project Hypothesis
As shown in the literature review, it is evident that there are many factors that are important when trying to decide which sourcing factories to work with. Currently, Nike uses established relationships, tier levels, and available factory capacity to determine which factories get allocated. Nike understands their need to elevate their sophistication in developing a sourcing strategy, therefore the developed model will improve their current sourcing process.
The goal of the project is to incorporate total landed cost and risk factors into their sourcing strategy to develop a factory portfolio that will both minimize cost and risk of doing business with the different factories. The Risk Adjusted Total Landed Cost (RATLC) model developed for Nike will utilize the cost of producing a product and
shipping it to a specific geography as well as the developed indices. This will provide Nike with a single output that incorporates cost and risk that can be used to compare factories easily across all available factories. The model will develop a factory demand
allocation plan for the Nike geographies that minimizes the RATLC, thus minimizing both cost and risk. It is likely that certain aspects (risk, cost, leadtime, quality, etc...)
may be sacrificed to develop the factory portfolio, but the model output should not be taken as the final strategy, rather initial guidance with needed human manipulation to derive satisfactory results. The resulting model will aid in making sourcing decisions quantitative, analytical and transparent resulting in a comprehensive strategy that will benefit Nike in minimizing cost and risk.
5 Risk and Cost Component Identification and Sources
As stated in the previous chapter, it is of growing importance to Nike to include both risk and cost in future sourcing strategies. Supply chain risks and costs are diverse in nature and can be analyzed in great depth. However, for this project, Nike wanted to develop a methodology that was broad enough that it could be applied across the vastness of its supply chain without constant updates and iterations. Therefore, the approach was to include the major components of risk and cost that could be applied to all suppliers without adding additional complexity. This method will allow suppliers to be compared against each other in a similar environment, which will make the model output significant and easy to interpret. The following sections describe the methodology of selecting the respective data and its relevance for Nike.
5.1 Risk Model Component Identification
In order for the model to be effective, Nike's supply chain risks must be classified in two dimensions: the risk itself in one dimension and the impact to the business on the other dimension. Therefore, the risks can be prioritized based on their probability as well as their impact to Nike. As previously mentioned, Nike wants a model and methodology that was broad enough to include the entire supply chain, consequently, it is important identify the high-priority risks that are both highly probable and most likely to severely damage the business. The risks should be measureable and specific to Nike.
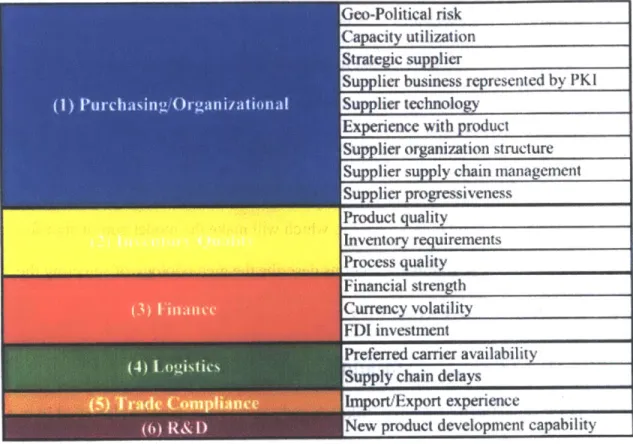
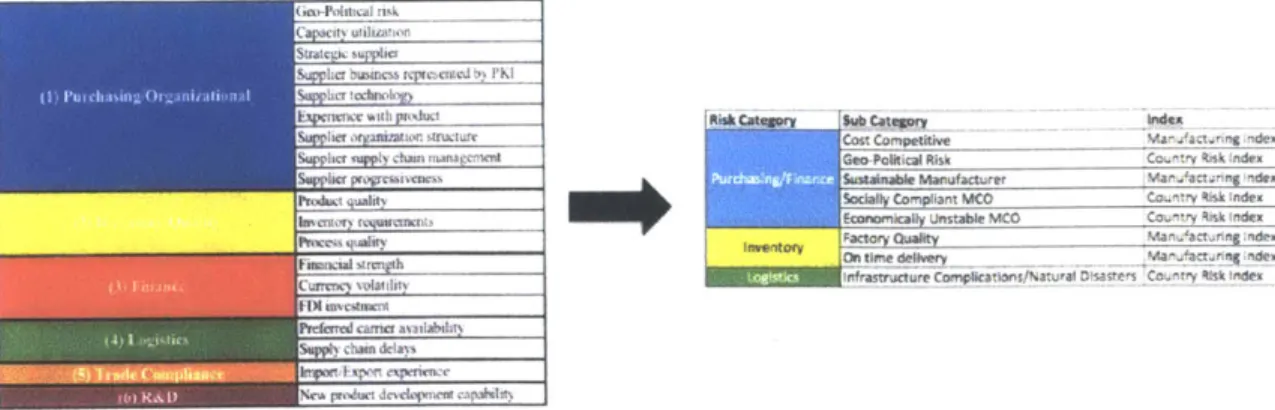
Feller (Feller, 2008) identified 6 major risk categories with 19 sub-categories that are relevant to supply chains. The list does not present a ranking order of the importance of
each risk, rather a portfolio of risk components used to understand the relative risk of a supplier against a variety of factors. Figure 2 shows risk categories and sub-categories.
Geo-Political risk Ca city utilization
Strt c suppier
S lier business represented b PKI
Su lier technology Experience with roduct
E lier oraization structure Suplier supply chain management
Supplier progressiveness Product quality, Invento re uirements Process quality Financial ste h Currency volatility FD1 investment
Preferred carrier availabilil upply chain delays Import/Export experience
New product development capability
Figure 2 - Risk Categories and Sub-Categories (Feller, 2008)
After reviewing the different possible risks associated with Nike's supply chain, it was discovered that a different team outside of sourcing has produced two different indices that are relevant to the risk categories shown in figure 2 and to the sourcing strategy we were envisioning for the project. The two Nike indices are the Manufacturing Index (MI) and the Country Risk Index (RI). Rather than reinvent risk indices for Nike, it was concluded by the sourcing team that the MI and RI were sufficient risk analysis and scores for the project. The MI and RI are discussed in the following sections.
5.1.1 Manufacturing Index
The MI was developed by the Sustainable Manufacturing & Sourcing (SM&S) team at Nike to measure the performance of existing suppliers and to try and devise a game plan to balance the risks associated with working with the individual factories. The MI provides a score for each supplier in the four following areas:
" Costing/Profitability
* Delivery Precision
Craftsmanship and Quality Manufacturing Sustainability
The factories are assessed using common ratings and point scale which are consistent across all of Nike's product engines (footwear, apparel, and equipment) and Brands. The scores are reported quarterly and if the factory is a new partner, it is allowed four quarters for "ramp-up". Based on the score of the factories, a color coded rating is assigned to the factory which corresponds to potential incentives or sanctions. Figure 3 provides a summary of the MI scale and rating correlation.
gWg
um
Manufacturing Industry leader - role model for others
Performance far exceeds requirements.
Effectively self-governs
CBST=Y EXCEEBM 1111IM inSS i
Leader in the sporting goods footwear/apparel/equipment manufacturing industry
Committed to continuous Improvement
Factory In good standing
Below minimum standards
ECENTVES
SANCTIONS
Immediate action required
Figure 3 - Manufacturing Index Scale & Rating
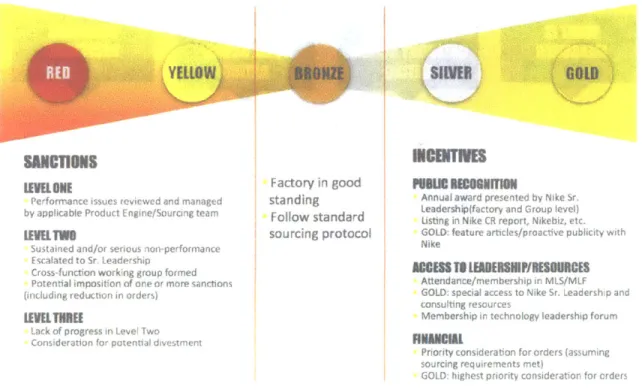
The sanctions and incentives for the factories are not finalized by the SM&S team, but possible actions include working groups, order reductions, and divestment for the underachieving factories and public recognition, access to leadership, and financial awards to the top rated factories. Ideas for sanctions and incentives corresponding to the different ratings are shown in figure 4.
W5109
85-94
70-84
60-6
>60
YELLOW
-NCTIONS lEVEL ONE
Performance issues reviewed and managecd by applicable Product Engine/Sourcing team
IEVELTM
Sustained and/or serious non-performance
Escalated to Sr. Leadership
Cross function workig group formed Potential imposition of one or more sanctions
(including reduction in orders)
LEVEL THREE
Lack of progress in Leve! Two
Consideration for potential divestment
Factory in good standing Follow standard sourcing protocol OLD EUM ITMITIO
Annual award presented by Nike Sr. Leadershipffactory and Group level)
Listing in Nike CR report, Nikebiz, etc. GOLD: feature articles/proactive publicity with
Nike
ACCESS TLEADERSHIPRESOURCES
Attendance/membership in MLS/MLF GOLD: special access to Nike Sr. Leadersh p and consulting resources
Membership in technology leadership forum
FMNCIAll
Priority consideration for orders (assuming sourcing requirements met)
GOLD: highest priority consideration for orders
Figure 4 - Possible Incentives and Sanctions based on MI Rating
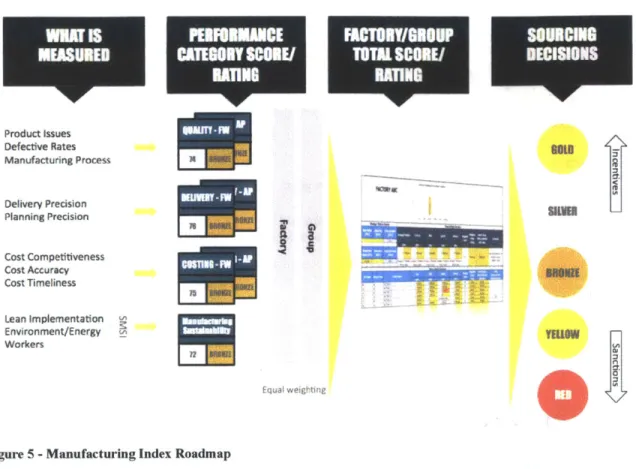
A roadmap for the MI metrics rating process is shown in figure 5 below.
Product Issues Defective Rates Manufacturing Process Delivery Precision Planning Precision Cost Competitiveness Cost Accuracy Cost Timeliness Lean Implementation ' Environment/Energy L Workers gglM
it
ywaFigure 5 -Manufacturing Index Roadmap
As previously mentioned, and shown in Figure 5, there are four metrics that are taken
into account when developing the MI score for the factories: Quality, Delivery, Costing, and Manufacturing Sustainability. Each metric will be further discussed in the following sections. Specific calculation details cannot be provided due to proprietary information.
5.1.1.1 Quality Metric
The quality scores of factories are determined by an adjusted defective rate and product quality issues. The adjusted defective rate is the ratio of the number of defective
garments to the number of audited garments. The audit is conducted by Nike's certified auditors at the third party logistics center or during factory visits. Product quality issue is a cost that is associated with the number of units scrapped, reworked, or seen as a critical failure and excludes any issues identified as Nike's responsibility. The issues are
SOURCING
DECISIONS PEFOBMANCE CATEGORY SCORE/ RATING FACTORY/GR00P TOTAL SCORE/ RATING Equal weighting 10,identified via the inbound goods audit team or by any other means outside the audit process. The quality metric score is between 0 and 100 based on defined ranges for the defective rate and product quality issue cost. The ranges and steps for calculating the costs are shown in Figure 6.
NT Step 1 Cacute severty G| osue Step . Sum a of the demerit pai
award pomis3 0 to 0.5% 50 Minor <$2000 0.6 to 1.0% 35 Moderate > $2000 and < $60K 0-2 1 1 to 2.0% 25 Severe* > $60K 3-6 > 2.0% 0 tr 2 Atsagn
5rand Rsk Severe Mods'ate - 7-10 reAjsted Defertive Rate sep.arate. rac'or 3D 2
Cric i Fa . fresC") from de c aic dation; sa'ec 25 S 1
treating themr z35 separate mehsCr:ica;
are, represert the nurrbe r audits vrt a %i 5 > 50 defectwqe rate of 46% o- highe. The metrt s
baser on a rolrg 12 month average. -roduct safety issues are considered severe regarliess of frarciat mpact
Cost -rOB ($JS) x # of units scrapped OR cost of Qualty issus are based on the
rework, B-grade losses etc. Crrticai akres are montts of factory a f ormanep
accourted for wsheen there s a cost associated
Figure 6 -Quality Metric Calculation (Points and ranges were changed to protect Nike information)
nts & determme 50 30 20 10 0 revious 12
5.1.1.2 Delivery Precision Metric
The delivery precision metric is based of both delivery and planning precision. Delivery precision is the confirmed factory leadtime from the factory to the consolidator within a tolerance of a number of days before and after the quoted delivery date. Planning
precision is the comparison between the date that the factory promised the products to the consolidator thirty days prior to origin receipt date within a window of a small number of days. The delivery precision score is between 0 and 100 and is highly weighted to the actual delivery date to the consolidator.
L M= AIL BEI ECINEUrE
5.1.1.3 Costing Metric
The costing metric is a measurement of how competitive, accurate and timely the factory is with costs. Cost competitiveness is based on the production costs of products when compared to the benchmark standard. Cost accuracy is a validation marker for the material utilization measurement to ensure that the quoted cost is based on the actual material used for the product. Cost timeliness is if the factory provides quotes to Nike on time during their planning stages to ensure that Nike is working with up to date numbers. The costing metric score is between 0 and 100 and is weighted more towards cost
competitiveness and accuracy over timeliness.
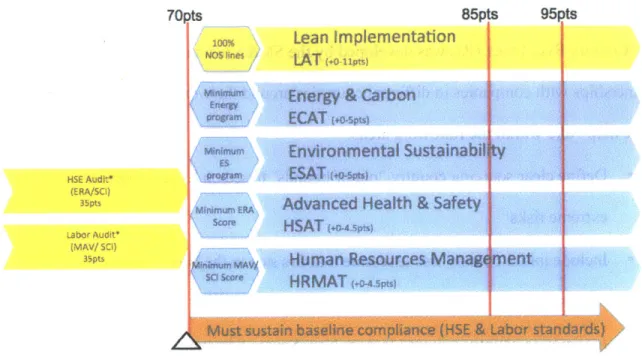
5.1.1.4 Manufacturing Sustainability Metric
The manufacturing sustainability metric measures how "Lean, Green, Equitable, and Empowered" the manufacturing processes of the factories are. Factories start with a minimum score of 70 (out of a range between 0 and 100), because they must pass a Health, Safety, and Environment and Labor Audit to be considered a sourcing partner with Nike. The additional possible 30 points is derived from additional excellence in the
following categories:
* Lean Implementation Energy Minimization
* Environmental Sustainability Health and Safety
* Human Resources Manageent
70pts 85pts 95pts
Lean implementation
NOS lines tAT (+o iipts)
Wimum Energy & Carbon
Energ
poram ECAT (,o-spts
Wnmum Environmental Sustainabi y
HSE Audit. progge ESAT apu
(ERA/SC)
35ts Minimum ERA Advanced Health & Safety Labor Audit' Score HSAT .. 4.pfs5)
(MAV/ SO)
Mi.our Mv Human Resources Manags ment
HRMAT <O-4.5s)
Figure 7 -Manufacturing Sustainability Point Scale
5.1.1.5 Combining MI Metrics
The MI metrics for the factories are calculated and combined for an overall rating for the factory. Each metric (Quality, Delivery Precision, Costing, and Sustainable
Manufacturing) carries equal weight and is averaged together for the final MI factory rating. Figure 8 shows an example of five factories and their metrics and final weighted scores. The individual metric scores for the factories are used in the model and the weighted final score is not utilized.
FatryA 77renze 67 1 1001 Gold 98 Gold 96 silver
FactoryDA 77 -si 7
Factory 8 82 gronue 70: those I 101o 85 8det 4 Bronze
Factory C 67 70 Dronte 100 Gold 97 Gol~d 64 OE
Factory D 76 Bosur- 70 Bronwe 100 Gold 86 Sive &V3
Factory E 83la'ie 70r No Data No 97 (<Ad 83 Bronz
5.1.2 Country Risk Index
The Country Risk Index (RI) was developed by the SM&S team to help assess
partnerships with companies in different countries around the world. The goal of the RI is the help Nike within the following areas:
- Define clear sourcing country "out of bounds" based on legal constraints and extreme risks
e Include initial country risk assessment at firs step in the New Country Approval
Process
- Incorporate country risk into factory New Source Selection Process approval and
audit track determinations
e Assist in allocating SM&S resources (people and programs)
- Provide macro risk reports/data to support strategic sourcing review and long term
strategy
The manufacturing countries are given a score based on four areas of risk: Political, Social/Compliance, Economic, and Infrastructure/Climate Risk. The scores are built on risk metrics and indices from the online database, Maplecroft. The RI score is from 0 to
10 with 0 being no risk and 10 being high risk. The country risk categories and score
ranges are shown in Figure 9.
Possible sourcing implications for factories within countries of different levels of risk are: * Low Risk Countries:
o Consider as a fast track factor is New Source Selection Process * Higher Risk Countries:
o No sourcing permitted
o High level of business justification and level of approval authority necessary
o Active measures to monitor and mitigate risk required
Rating Weighted Definition
Score
Extreme 7.0 10.0 Countries whose risk is so extreme that no new sourcing is permitted
Risk
Very High 5.5- 6.9 Countries where there is a substantial
risk of disruption in the manufacture/
Risk delivery of product and/or Brand
exposure
4.5 - 5.4 There is risk of disruption and/or non-compliance at the country level.
3.0- 4.4 Some risk of business interruption and/ or Brand exposure at the country level.
Low Risk 0,0 2 9 tow risk of business interruption and/or Brand exposure at the country level.
Figure 9 - Country Risk Index Categories and Score Ranges
The four metrics (Political, Social/Compliance, Economic, and Infrastructure/Climate Risk) that are inputs into the final RI score are outlined in the following sections. As previously mentioned, the different components are from the online database, Maplecroft, unless otherwise noted. Maplecroft's methodology for calculations can be found at their website.
5.1.2.1 Political Risk
There are three components that affect a country's political risk score: Political Stability
& Risk of Violence, Rule of Law, and Corruption. The political stability and risk of
violence component is calculated using a Nike developed travel security rating in conjunction with a political violence index and regime stability index from Maplecroft. The Nike Travel risk rating evaluates the threat to travelers and expatriates by political violence, social unrest and petty crime while considering the effectiveness of security and emergency services within the country. Maplecroft's political violence index assess the risk to business relating to the intensity, frequency and impact of politically motivated violence, including terrorism and risk of human rights violations relating to personal security. The regime stability index evaluates the risk to business of political turmoil and disruption of governance by examining the peaceful or violent nature of regime changes as well as levels of democratic governance.
The rule of law index assesses the risk relating to the ineffectiveness of legal and regulatory practices, based upon judicial independence, judicial effectiveness, and the comprehensiveness, transparency and consistent application of business relevant regulation in a country.
The corruption score is based on the Corruption Perceptions Index (CPI 2010) compiled
by Transparency International. CPI 2010 charts corruption in the public and private
5.1.2.2 Social/Compliance Risk
Three components are inputs into the Social/Compliance Risk score: Civil Rights, Compliance with Core Labor Standards, and Worker Vulnerability. The civil rights risk score assesses the risk of complicity for responsible business in violations of civil and political rights, including arbitrary arrest and detention, freedom of conscience,
expression and religion, freedom of speech and the press, human rights defenders, female rights, indigenous peoples' rights and minority rights.
A country's compliance with core labor standards is evaluated using the Working
Conditions Index, the Business Partner and Supply Chain Complicity Risk Index, and the SMSI aggregate factory performance. The Working Conditions Index measures the prevalence and gravity of sub-standard working conditions, particularly in relation to the minimum wage, working hours and health and safety in the workplace. The Business Partner and Supply Chain Complicity Risk Index assesses the risk of labor standards violations committed along the supply chain, based on four core labor standards: freedom of association and collective bargaining, child labor, forced or involuntary labor and discrimination. SMSI aggregate factory performance measures compliance performance of current factories based on aggregate SMSI ratings.
The Worker Vulnerability component is based on the Poverty Index. The Poverty Index assesses the level of risk of poverty and is based on the United Nations Development Program (UNDP) Human Development Index (HDI) 2008. The HDI looks at the
following factors: life expectancy at birth, adult literacy rate and combined gross enrollment in school, and GDP per capita.
5.1.2.3 Economic Risk
A country's economic risk score is based on the workforce risk, business environment,
and the general economic environment. The workforce risk looks at the Food Security Risk Index, the Education Index, and the capacity to contain infectious disease score. The Food Security Risk Index (FSRI) assesses the risk of food insecurity, providing quantitative assessments of the availability and stability of, as well as access to, food supplies. The education index measures the risk posed to individual countries, and the business environment within those countries, from the lack of educational attainment. The capacity to contain infectious diseases index evaluates the ability to respond to and contain outbreaks of infectious diseases (either existing or emergent), taking into account wealth and the quality of health, education and communications.
The business environment risk index is composed or the business environment score and regulatory framework score. The business environment score is calculated based on respect for property rights and the comprehensiveness, transparency and consistent application of the business-relevant regulation in each country. The regulatory framework index assesses the extent to which regulation affects the ease of doing business in each country.
The general economic environment score takes into account the key macroeconomic variables in the each country to indicate the degree to which the macroeconomic
environment is conducive to business. Key indicators include: Economic Performance Index, Development Financing Index, and Effectiveness of Economic Policy Index.
5.1.2.4 Infrastructure & Climate Risk
The infrastructure and climate risk score for the manufacturing country of origin is composed of three components: logistics infrastructure, energy and water, and natural disaster and climate change. Logistics infrastructure uses the Transport and
Communications Infrastructure Index to analyze the level of coverage of transport and communications infrastructure in each country. Transport and communication
measurements are based on: Roads
* Railways
* Air Transportation
Fixed and Mobile Telephone subscribers
e Internet Users
- Electricity Generation
The energy and water component scores the energy security and water security risk. The energy security index is the risk posed to the availability, affordability and continuity of energy within the short term. Indicators include diversity, security and reliance on imported energy, electrical transmission losses, power outages in a typical month, and energy prices. The water security risk index quantifies the risk to a country that economic function will be limited by the availability of water. Indicators include dependency on external water, water use intensity and water stress (ratio of use to renewable water supply).
The natural disasters and climate change component evaluates risk based on climate change vulnerability and natural hazards risk. The climate change vulnerability index evaluate vulnerability and risk of exposure to extreme climate related events and major climate changes over the next 30 years. The natural hazards risk accounts for the total value of non-agricultural economy exposed to such natural hazard risks as seismic and volcanic activity, tsunamis, floods, storms and cyclones, landslides, and wildfires.
5.1.2.5 Combining RI Metrics
The RI metrics for the factories are calculated and combined for an overall rating for the factory. Each metric (Political, Social/Compliance, Economic, and Infrastructure and Climate Risks) carries equal weight and is averaged together for the final RI factory rating, as shown in Figure 10.
* Political Stability & Risk
of Violence (Nike Travel risk rating, political violence and regime stability)(15%)
* Rule of law (effectiveness of legal & regulatory practices)(5%) a Transparency and
Corruption (Transparency International Corruption Perception 1ndex)(5%)
" Civil Rights (e.g., freedom of the press, arbitrary
arrests, minority rights)(5%)
" Compliance with Labor
Standards (risk of wages,
hours, FoA, child labor, etc. violations and SIMSI performance)(15%) -Worker Vulnerability
(UNDP Human Development
Index)(5%)
"General Economic Environment (including
risk of economic instability, FX, inflation, debt, GDP)
(15%)
* Business Environment
(business regulation; trade)
(5%)
" Workforce Risk (access
to food, education and disease risk -WIP)(5%)
" Logistics infrastructure (speed, cost and security of
logistics, e.g., roads, ports,
communications)(10%)
* Energy & Water
(availability and vulnerability of energy and water
resources)(5%)
"Natural disasters; & Climate change
(vulnerability and exposure to extreme natural disasters)
(5%)
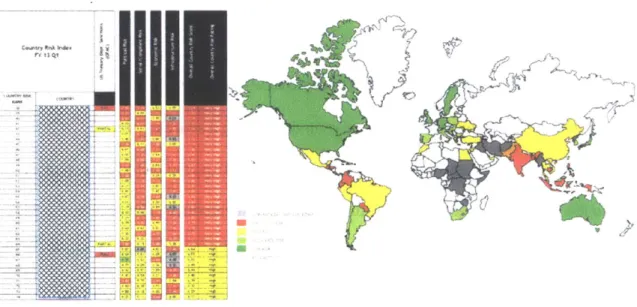
Figure 11 shows an example of a RI report card and final weighted scores along with a RI map. The individual metric scores for the factories are used in the model and the
weighted final score is not utilized.
Figure 11 - RI Report Card and Map. (Map does not reflect current RI scores, it is just an example)
5.1.3 Risk Conclusion
As previously mentioned, the project team moved away from incorporating a large number of risks that are usually associated with supply chains, as shown in Figure 2. Rather, the risk factors were derived from existing Nike developed indices, the
Manufacturing Index and the Country Risk Index. These indices incorporate the major risks as viewed by the Nike sourcing team. Therefore, the risk model evolved from incorporating 19 risks to 8 risks as shown in Figure 12.
strate w su iser
Icrmmiess re ed PMnq
her!tcho
wah ~~~IS nxmRs~t ruCatego.ryine Sumli-
ognmi qwuvcost Competitve V -9 ni -!e
hcra hm m mt GeO Poutical Risk Co4-,ry "k -1dex
he~rytvcues S ustainable Marufacturer Ma.-'eacu dex -uPrdc 1Siy Factors t o R k SOcWa Compant MCO _mae
5.2 rcanlL acdnornecad d ak Unstable MCO CCny index
ls e t i e p wtthdh praodQuait. MaTo'actarng idex
nt irreie y ,M&.-I"'ie incorporfr fpdittouducat truue ast ft C op cai on/ Nake ant- tRsk ode
camdean
upnexpenenc
Nwproduct develqwnent capallht
Figure 12 - Supply Chain Risk Factors Compared to Model Risk Factors
5.2 Total Landed Cost Component Identification
In order to ensure that the model is effective in developing a sourcing strategy, it is important that the costs associated with getting a product from the factories' assembly lines to the different geographies with the demand for the product. The costs the model incorporates is the cost each factory charges Nike for producing the product and the costs of transporting and getting the product into a specific country. Table 1 shows the
Table 1 -Total Landed Cost Components in Model
The cost components are similar to the cost components used in other models for total landed cost analysis. Some costs that are not included in the model that may be in other costing models include, but not limited to:
" Fuel Surcharge
- Additional Warehousing Costs
* Packaging Costs
Cost Component Data Used In Model
Materia Costs Average Freigit On Board (FOB) Costs from
Factories
Duty Duty Rates from Nike and Harmorized
Tariff Schedule
Freight Historical Freight Rates from Nike
Database
Bark Charges Historical International Bank Charges for
Importirg Goods in Specific Countries from
Nike Database
Transportation Unit Cost of Trarsporting Good into
country. Data frorr Nike database Customrs Clearance Customs Clearance Fees based on
Historical Records
irsLrarce The :nsurance rate for products goirg to
different courtries
Pipel ne Inventory The cost associated with the leadtime of
goods travelling from marufactu rfing
country of origin to destination.
Nissho lwai Cost associated with working with the
trading company Nissho fwa, to get goods
into certain countries
VAT Value Added Tax added to the product for
goods going into certain countries
Otner Any other costs that is not called out by
- Distribution Center Inventory Costs
e Potential Customer Discounts
It was assumed that most of the excluded costs were actually included in material, freight, and/or transport costs (packaging and fuel surcharge). The products usually go straight from the factory to a Nike distribution center or customer distribution center, therefore, additional warehousing is not relevant. This project purposely left out inventory costs associated with holding product at Nike distribution centers because of other projects researching the inventory "problem" at Nike. Inventory holding policies were evolving throughout the duration of this project, as a result, it was decided by the team to leave out as to not complicate the project further.
Each of the cost components, shown in Table 1, were not included in every analysis. The use of the cost components is dependent on the origin of the product and the final
destination. The development of the total landed cost model is described in more detail in Chapter 7.
A key finding in researching the necessary cost components for the total landed cost
analysis was that Nike had most of the costing data necessary to develop the model, it was just not being used for sourcing decisions. The costing model will help in the consolidation of the data for costing analyses.