HAL Id: tel-01144518
https://pastel.archives-ouvertes.fr/tel-01144518
Submitted on 21 Apr 2015HAL is a multi-disciplinary open access archive for the deposit and dissemination of sci-entific research documents, whether they are pub-lished or not. The documents may come from teaching and research institutions in France or
L’archive ouverte pluridisciplinaire HAL, est destinée au dépôt et à la diffusion de documents scientifiques de niveau recherche, publiés ou non, émanant des établissements d’enseignement et de recherche français ou étrangers, des laboratoires
distribution system
Seddik Yassine Abdelouadoud
To cite this version:
Seddik Yassine Abdelouadoud. Integration of renewable energies in the electricity distribution sys-tem. Electric power. Ecole Nationale Supérieure des Mines de Paris, 2014. English. �NNT : 2014ENMP0071�. �tel-01144518�
T
H
E
Doctorat ParisTech
TH`
ESE
pour obtenir le grade de docteur d´elivr´e par
l’´
Ecole Nationale Sup´
erieure des Mines de
Paris
Sp´
ecialit´
e doctorale “´
Energ´
etique”
pr´esent´ee et soutenue publiquement par
Seddik Yassine Abdelouadoud
le 1 d´ecembre 2014
Int´
egration des ´
energies renouvelables au r´
eseau
de distribution d’´
electricit´
e
Directeur de th`ese : Fran¸cois-Pascal Neirac Co-encadrant de th`ese : Robin Girard, Thierry Guiot
Jury
M. Manuel Matos, Professeur, INESC Porto Rapporteur
M. Anastasios Bakirtzis, Professeur, University of Thessaloniki Rapporteur M. Rapha¨el Caire, Maitre de conf´erence, G2ELab Rapporteur
M. Marc Petit, Professeur adjoint, Sup´elec Examinateur
M. Jean-Christophe Passelergue, Alstom Examinateur
M. Fran¸cois-Pascal Neirac, Professeur, Mines Paristech Examinateur M. Robin Girard, Charg´e de recherche, Mines Paristech Examinateur
M. Christophe Leboss´e, ErDF Invit´e
This thesis has been financed by the Centre Scientifique et Technique du Batiment (CSTB), a French public research and assessment orga-nization tasked with developing and disseminating new knowledge to improve the quality and efficiency of buildings. The impetus be-hind this foray into the inner workings of the power system is the ex-pected development of "zero-energy" or "positive-energy" buildings that not only strive to limit their energy consumption but also supply energy on-site, usually via renewable-based converters. If it reaches a significant level, the integration of such buildings into the power system will have impacts on its planning and operation. In this light, the objective of this work, from the standpoint of the CSTB, is to provide a methodology to assess those impacts in a systemic man-ner, which means taking into account the power system as a whole with a particular focus on the interactions between its various subsys-tems. While the power systems in various countries display concep-tual similarities, their practical implementation, especially in terms of the technical characteristics of the generators and the regulatory envi-ronment, are the results of historical processes and are thus specific to each countries. As a consequence, the methodologies and tools devel-oped in this contribution could be adapted to various power systems, whereas the case studies are heavily influenced by the characteristics of the French power system.
1 i n t r o d u c t i o n 1
1.1 Evolution of the Power System . . . 1
1.1.1 Early days, 1880-1910 . . . 1
1.1.2 Regional Alternating Current (AC) transmission, 1910-1946 . . . 2
1.1.3 National monopoly : 1946-1996 . . . 3
1.1.4 Deregulation: 1996-Now . . . 6
1.2 Distributed Generation . . . 9
1.2.1 Definition . . . 9
1.2.2 Distributed renewable generators . . . 10
1.2.3 Distributed storage units . . . 19
1.3 Existing approaches for impact mitigation . . . 28
1.3.1 Local control . . . 28
1.3.2 Active Distribution Network . . . 29
1.4 Objectives . . . 32
1.5 Outline . . . 33
2 d i s t r i b u t e d g e n e r at i o n a s s e s s m e n t 41 2.1 Introduction . . . 41
2.1.1 Current DG deployment . . . 41
2.1.2 Potential impact of large DG penetration . . . . 41
2.1.3 Existing approaches . . . 42
2.1.4 Outline . . . 43
2.2 Optimization model and decomposition . . . 44
2.2.1 Theoretical model . . . 44
2.2.2 Principles of decomposition and coordination . 45 2.2.3 Application to CPS and DG coordinated operation 46 2.3 Case Study . . . 48
2.3.1 Context . . . 50
2.3.2 ADN and DG operation . . . 50
2.3.3 CPS operation . . . 54
2.4 Results . . . 58
2.4.1 Master Problem results . . . 59
2.4.2 Sub-problem results . . . 61
2.5 Conclusion and perspectives . . . 64
3 o p t i m a l p o w e r f l o w i n a d i s t r i b u t i o n s y s t e m 67 3.1 Introduction . . . 67
3.1.1 OPF as a QCQP . . . 68
3.1.2 Convex relaxations . . . 68
3.1.3 Outline . . . 69
3.2 The OPF model and its SOC relaxation . . . 69
3.2.2 Mathematical Conditions ensuring the exactness
of the relaxation . . . 71
3.2.3 Examples of inexact relaxations in a simplified case study . . . 71
3.2.4 Results . . . 74
3.2.5 Interpretation . . . 74
3.3 Extracting a physically meaningful solution . . . 77
3.3.1 Principle of the cutting planes . . . 78
3.3.2 Definition of the cuts . . . 78
3.3.3 Proof of the validity of the cuts . . . 79
3.3.4 Illustration of the convergence on configuration 2 81 3.3.5 Stopping Criterion . . . 81
3.4 Case Study . . . 82
3.4.1 Definition of the configurations studied . . . 82
3.4.2 Analysis of the results . . . 83
3.5 Conclusion . . . 85 4 c r i t i c a l i t y c r i t e r i o n 87 4.1 Context . . . 87 4.2 Outline . . . 87 4.3 Methodology . . . 88 4.3.1 Problem studied . . . 88 4.3.2 Criticality criteria . . . 89 4.4 Application . . . 92 4.4.1 Case Study . . . 92
4.4.2 Compromise between accuracy and computa-tional gains . . . 94
4.5 Conclusion . . . 97
5 c o n c l u s i o n 99 5.1 Achievements . . . 99
5.2 Perspectives fur future research . . . 100
Figure 1 French network and main generators in 1930, source : [1] . . . 3
Figure 2 Electricity production by source, source : EDF 6
Figure 3 Evolution of the start of constructions of nu-clear reactors in France from 1971 to 1991, source : International Energy Agency (IEA) . . . 6
Figure 4 Evolution of the high-voltage (400 kV) network in France, source : RTE . . . 7
Figure 5 Evolution of direct global greenhouse gas emis-sions, by sector, 1970-2004 . . . 11
Figure 6 Life-cycle greenhouse gas emissions for selected power sources . . . 11
Figure 7 Historic and projected evolution of levelized cost of electricity for solar in Germany, 2005-2020, source: [2] . . . 12
Figure 8 Evolution of levelized cost fo electricity for wind, 1980-2010, source: [3] . . . 12
Figure 9 Comparison of levelized cost of electricity for various type of generators, source: Fraunhofer Institute . . . 12
Figure 10 Evolution of FITs in France for various type of
installations, 2002-2014 source: photovoltaique.info 14
Figure 11 Evolution of installed PV capacity, 2009-2014, source: Commissariat Général au Développe-ment Durable . . . 14
Figure 12 Installation price of residential and commer-cial PV according to their size in the USA, 2012, source: [4] . . . 15
Figure 13 Installation price of utility-scale PV according to their size in the USA, 2012, source: [4] . . . 16
Figure 14 Distribution of the size of PV installations in France, June 2014, source : Commissariat Général au Développement Durable . . . 16
Figure 15 Installed capacity by region,June 2014, source : Commissariat Général au Développement Durable 17
Figure 16 Voltage in a distribution without DG, source: [5] 20
Figure 17 Voltage in a distribution without DG, source: [5] 20
Figure 18 Output of PV, wind and conventional power plants with the coincident market prices, source: [6] . . . 20
Figure 19 Power and Energy Capacity, source: Energy
Stor-age Association . . . 23
Figure 20 Weight and Volume Energy Density, source: En-ergy Storage Association . . . 24
Figure 21 Capital Cost per Unit Power and Energy, source: Energy Storage Association . . . 24
Figure 22 Efficiency and Lifetime, source: Energy Stor-age Association . . . 25
Figure 23 Technological Maturity of Storage Technologies, source: [7] . . . 25
Figure 24 Non-coincidental peak for system and trans-former load, source: [8] . . . 27
Figure 25 Use of storage in combination with intermit-tent and inflexible generators, source: NRStor . 27 Figure 26 Various options for matching load and demand in systems with intermittent and inflexible gen-eration, source: [9] . . . 28
Figure 27 Possible Architecture of an Active Distribution Network, source: Nice Grid Project . . . 30
Figure 28 A1gorithm for Coordinated CPS and ADN op-eration . . . 49
Figure 29 Weekly Mean Power Produced by Source (2012) 51 Figure 30 Weekly hydro virtual marginal prices . . . 57
Figure 31 Long-term master problem . . . 59
Figure 32 Short-term master problem, Week 8 . . . 60
Figure 33 Short-term master problem, Week 18 . . . 60
Figure 34 Short-term master problem, Week 52 . . . 60
Figure 35 Storage output of type 1 at iteration 1 and 2 . . 61
Figure 36 PV output at iteration 1 and 2 . . . 61
Figure 37 Total yearly deviation . . . 62
Figure 38 Maximal deviation . . . 62
Figure 39 Number of time steps with significant deviation 63 Figure 40 Photovoltaic energy curtailed . . . 63
Figure 41 Storage curtailed . . . 63
Figure 42 Sub problem power flows for the rural network at time step 5303 . . . 64
Figure 43 Voltages obtained by SOCP relaxation and power flow for various objective functions . . . 76
Figure 44 Voltages obtained by SOCP relaxation and power flow for various objective functions . . . 81
Figure 45 Voltages obtained by SOCP relaxation and power flow for various time steps of the algorithm ap-plied to configuration 2 . . . 82
Figure 46 Number of Critical Time Steps for the 30 Case Studies . . . 93
Figure 48 Criticality Ranking for Two Cases of Network 1, with the Size of the Points Proportional to
the Total Deviation . . . 94
Figure 49 Criticality Ranking for Two Cases of Network 2, with the Size of the Points Proportional to the Total Deviation . . . 94
Figure 50 Criticality Ranking for Two Cases of Network 3, with the Size of the Points Proportional to the Total Deviation . . . 95
Figure 51 Compromise Between Accuracy and Compu-tational Gains for Case 10 of Network 1 . . . . 95
Figure 52 Compromise Between Accuracy and Compu-tational Gains for Case 10 of Network 2 . . . . 96
Figure 53 Compromise Between Accuracy and Compu-tational Gains for Case 10 of Network 3 . . . . 96
L I S T O F TA B L E S Table 1 Storage technologies and their associated en-ergy form . . . 21
Table 2 Estimates of response time for various storage technologies, source : [10] . . . 23
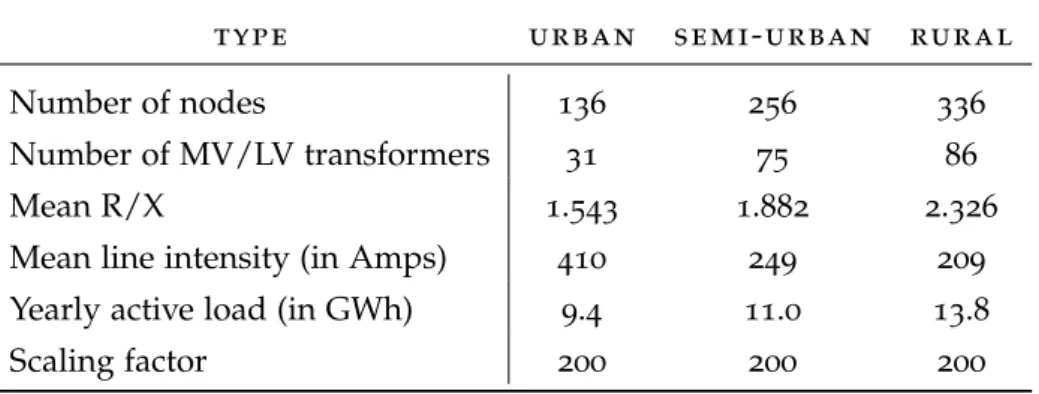
Table 3 Electricity production and capacity by source . 50 Table 4 Characteristics of considered ADN . . . 51
Table 5 Installed storage and PV characteristics, by net-work . . . 52
Table 6 Distributed storage characteristics . . . 52
Table 7 Nuclear fleet characteristics . . . 56
Table 8 Fossil plant characteristics . . . 57
Table 9 Line parameters of the test network . . . 71
Table 10 Node parameters of the test network . . . 72
Table 11 Configurations of the test network that will be studied . . . 72
Table 12 Maximum gap (in p.u.) for various objective functions and configurations . . . 75
Table 13 Optimal active power injection for various ob-jective functions and configurations . . . 75
Table 14 Network Losses for various objective functions and configurations . . . 75
mality, with a stopping criterion allowing the achievement of a solution respecting network constraints . . . 82
Table 16 Characteristics of the case studies . . . 83
Table 17 PV curtailment for the SOCP relaxation with-out cuts, and for two values of the stopping criteria . . . 84
Table 18 max VPF
j for the SOCP relaxation without cuts, and for two values of the stopping criteria . . 84
Table 19 Objective value for the SOCP relaxation with-out cuts, and for two values of the stopping criteria . . . 84
Table 20 Mean duration of individual SOCP steps and number of SOCP steps before termination, for two values of the stopping criterion . . . 84
A C R O N Y M S
AC Alternating Current
DC Direct Current
EPIC Etablissement Public à caractère Industriel et Commercial, or Commercial and Industrial Public Company
EDF Electricité De France
CEA Commissariat à l’Energie Atomique
IEA International Energy Agency
TSO Transmission System Operator
DSO Distribution System Operator
DG Distributed Generation
DN Distribution Network
APEI Advanced Power Electronic Interface
PV Photovoltaic
EROI Energy Return On Investment
LCOE Levelized Cost Of Electricity
FIT Feed-In Tariffs
ADN Active Distribution Network
EPS Electric Power System
SMES Super Magnetic Energy Storage
DER Distributed Energy Resources
CPS Centralized Power System
OPF Optimal Power Flow
CG Centralized Generation
AS Active Substations
MV Medium Voltage
LV Low Voltage
MINLP Mixed-Integer Non-Linear Problem
LTMP Long-Term Master Problem
QCQP Quadratically Constrained Quadratic Problem SOC Second-Order Cone
1
I N T R O D U C T I O N
This introduction will be organized in the following manner. First we will describe the various phases of the evolution of the French power system, from the decentralized system of the early days to the large-scale deregulated current system and passing through the state-owned monopoly. We will focus particularly on the interplay between technological improvements and political orientations as the deter-mining factor explaining power system organization and functioning. Subsequently we introduce a potentially disruptive set of technolo-gies that is the focus of this thesis: distributed generation, with a specific attention brought to the complementary instances of weather-dependent renewable generators and storage. Due to intrinsic quali-ties that we set forth, renewable energies have enjoyed a broad politi-cal support that has turned into various subsidy mechanisms that we also present. In turn, the development that this has spurned will have possibly adverse impacts on the rest of the power system that we de-pict in detail. Distributed storage units, their characteristics and the applications they could have in the context of large distributed renew-able generation penetration are specified next. Due to this expected expansion of distributed generation, the assumptions underpinning the current planning and operation of the power system, and espe-cially the distribution system, are called into question. To cope with this, various strategies relying on differing assumptions concerning the level of control and observability of the future distribution net-work have been put forward in the literature. After describing them summarily, we identify a potential area of improvement that leads us to set out the list of objectives that we have assigned ourselves as well as the organization of the rest of this contribution.
1.1 e v o l u t i o n o f t h e p o w e r s y s t e m 1.1.1 Early days, 1880-1910
The first commercial applications of electricity were developed in competition with other energy vectors, such as pneumatic or hydraulic transmission to power motors or gas for street lights. Each type of load (street lights, factory motors, streetcars, etc) had differing volt-ages and had to be supplied with its specific generators and lines. Moreover these generators had to be located nearby for low-voltage loads. It was already known that higher voltages would allow trans-mission on longer distances, in turn permitting to take advantage of
economies of scale and remote hydropower sources. However, there did not exist any practical mean to transform the voltage and the only solution to transport electricity on long distances was thus to supply many loads connected in series, which was done, for example, with light systems at the Universal Exposition in 1878 (11 kilometers) or with a line between the Moutiers hydropower plant and the Lyon street light infrastructure in 1906 (125 kV, 230 kilometers). Both al-ternatives (local supply or loads connected in series) had limitations that did not allow electricity to supplant existing energy vectors eas-ily, a fact illustrated by, for example, the fierce competition between electricity and gas lightning in the UK during the 1880s, see [11]. As
an telling anecdote, we can refer to the Opera Avenue in Paris, whose lighting system was electrified in 1878 before going back to gas in 1882.
1.1.2 RegionalACtransmission, 1910-1946
In this context, the invention of the transformer, that can be dated back to 1884-1885, along with the invention of an efficient AC motor by Tesla in 1888, proved to be a pivotal moment in the history of elec-tricity. The advantages were twofold : first, low-voltage loads could be connected to remote generators and, second, loads with differing voltages and thus differing uses could be supplied with the same net-work. One of the first example of a commercial implementation is the AC line linking the Niagara Falls hydropower plant and the city of Buffalo, NY in 1895. This did not end the War of Currents between AC and Direct Current (DC) immediately (for example the Moustiers-Lyon line mentioned above was DC) but AC gained an advance that proved decisive. From an economic standpoint, this resulted in sig-nificant reduction in the costs of electricity due to effects of scale in generation, higher load factors and reduced capital investments in networks. Consequently, the first decades of the 20th century saw a continuous expansion of electricity use, with, for example, the num-ber of electrified municipalities in France going from 7000 in 1919 to 36500 in 1938, with a particularly high growth between 1927 and 1933(18210 to 33567 electrified municipalities). In parallel, the yearly electricity produced went from 1.8 TWh in 1914 to 21 TWh in 1938. Figure 1 depicts the state of the French power system in 1930, with
the several high-voltage line allowing the connection of load centers with remote power sources on a regional scale. At the end of the 1930s, there existed around 200 companies concerned with produc-tion, 100 with transmission and 1150 with distribution [12]. However,
the sector was fragmented only in appearance, as most of the compa-nies in production and transport belonged to large holdings (Union d’Electricité, Energie Industrielle, groups Péchiney or Empain) that thus acted as regional quasi-monopoly. The consequence is a series of
Figure 1: French network and main generators in 1930, source : [1]
anti-competitive behavior regarding investments in generators (large and capital-intensive investments, especially in hydroelectricity, that could lower electricity costs are avoided) and transmission (inter re-gional connections that could permit a better matchup of generators and loads are discarded), see [13] for details, that did not allow the
development of the power system to its full potential and set the stage for the next phase : nationalization.
1.1.3 National monopoly : 1946-1996
The idea that the power sector had to be regulated was not a new one : as early as 1906, June 15th, a law established that the distribu-tion of electricity was a public service with the equipment being the property of municipalities that could concede its exploitation to the private sector. On July 19th, 1922, another law was enacted to allow the State to either invest himself or force private companies to invest in transmission lines if it deemed it necessary "to ensure a more com-plete utilization and better sharing out of electrical energy". However,
this law was never put to use and the anti-competitive behaviors in the power sector continued unabated, with high prices and a high geographical inequality in the access to power. The situation deterio-rated rapidly at the beginning of the 1930s and led, in July 1937, to the signings of resolutions by a parliamentary commission on elec-tricity, the federation of electrified municipalities and the association of mayors urging the government to enforce "a significant decrease in high-voltage electricity prices" and "the creation of a public en-tity tasked with sharing out high voltage energy between production plants and distribution networks". The first response of the govern-ment was the the enactgovern-ment of a decree (May 2nd, 1938) allocating 350 million Francs to the creation of a publicly-owned transmission network in eastern France. Fearing a possible nationalization of elec-tricity transmission, the private sector joined the government in talks that ended up with an agreement formalized by a decree on the 17th of June. The major measure was the creation of the "Groupement Fi-nancier d’Electricité", an entity tasked with collecting funds from elec-tricity companies and emitting bonds to finance a 3 billion Franc de-velopment program with a particular focus on hydropower and inter-regional connections. Other measures concerning prices and working conditions were also introduced and the threat of nationalization was fended off for the time.
This did not last long as the end of World War II ushered in a new era. The fundamental issues stemming from the control of the power sector by a few "electricity trusts" were not solved by the pre-war at-tempts at regulation. This time around, the difference was that the political landscape had changed, with the nationalization not only defended by the communist party and unions but also supported by the Général de Gaulle since 1944 and listed as an objective in the Conseil national de la Résistance political program. Thus, on April 18th, 1946, following the initiative of Marcel Paul, the then minis-ter of industrial production, a law was passed to create Electricité de France, a vertically and horizontally integrated state-owned com-pany ("établissement public à caractère industriel et commercial" or Etablissement Public à caractÚre Industriel et Commercial, or Com-mercial and Industrial Public Company (EPIC) to be accurate) tasked with ensuring the production, transport and distribution as well as imports and exports of electricity. While all the transmission system was incorporated into EDF, some parts of the distribution system al-ready under municipal control and some generators -usually small or used for self-consumption by industries- remained independent. The creation of EDF had multiple objectives [14]:
• Operating the power system on a national scale in an integrated manner and with a public service goal regarding price setting, equality of access and quality of supply
• Planning and carrying out the rebuilding and then expansion of the power system
• Financing, usually through debts, these investments
• Balancing revenues and expenditures through rational organi-zation and price settings
Of course, these objectives could not be attained all at once, and we can distinguish three phases in the history of EDF.
1.1.3.1 1946-1950
Administrative and organizational integration of nationalized com-panies, investment in production and transport and management of shortages are the main priorities of the newly integrated utility. In 1950, the situation is back to normal concerning the supply-demand equilibrium, but France still lags behind in term of overall access to electricity (10 million households connected in 1948, 140 kWh of annual mean consumption compared to 390 kWh in the UK or 590 kWh in Switzerland). The theoretical foundations for electricity tariff, based on marginalist theory calculation are established.
1.1.3.2 1950-1970
Large investments in production (hydro and thermal), transport (380-400kV) and distribution system allow France to fill the gap with other industrial countries. At first thermal and hydro are developed at vir-tually the same rate, but in the middle of the 60s, hydro capacity increase stalls as the geographical opportunities for low-cost hydro decrease. In the middle of the 70s, 20 million households are con-nected (for a total population of 52 millions) which means that only highly isolated sites are still not supplied by the centralized network. Starting in 1951 for industries and 1956 for households, an electricity price based on long-term marginal costs is applied.
1.1.3.3 After 1970
The development of the power system is not focused on electrifica-tion anymore, but rather on increasing the quality and reliability of supply, as well as increasing the total output to allow new uses (in particular thermal uses) of electricity to develop. This coincides with the beginning of the industrial phase of the civil nuclear program. Af-ter a long opposition between EDF and the Commissariat à l’Energie Atomique (CEA), the light-water technology (boiling and pressurized were considered, but only pressurized water reactors were eventually built) was chosen and the first 6 reactors were commissioned at the end of 1969. While a further expansion was already planned, the oil shock of 1973 precipitated the commissioning of new nuclear plants,
Figure 2: Electricity production by source, source : EDF
Figure 3: Evolution of the start of constructions of nuclear reactors in France
from 1971 to 1991, source :IEA
1971 1972 1973 1974 1975 1976 1977 1978 1979 1980 1981 1982 1983 1984 1985 1986 1987 1988 1989 1990 1991 Year
T
otal capacity of constr
uction star ted dur ing the y ear (in MW) 0 2000 4000 6000 8000 10000
with energetic independence a major concern at that time. The start of construction of new reactors continued at a rapid pace during the 1970s, as can be seen in Figure 3. In parallel, the density of the 400
kV is greatly increased to accommodate the new generation means, see Figure 4. The beginning of the 80s marks a shift in the
percep-tion of nuclear with the incidents in Three Mile Island in 1979 and Saint-Laurent in 1980, but it is the Chernobyl accident of 1986, in con-junction with a decrease in expected load growth, that puts a stop to the French nuclear program. Commissioned plants are still built but no new plant is planned until 2004.
1.1.4 Deregulation: 1996-Now
Starting with Chile in 1981, a trend of liberalization, restructuring and privatization of the power sector can be identified, a part of a much
(a) 1960 (b) 1978 (c) 1990
Figure 4: Evolution of the high-voltage (400 kV) network in France, source : RTE
broader movement toward a market-based organization of the econ-omy. This trend has taken various forms depending on the country considered but common denominators can be outlined:
• "Unbundling" of previously vertically integrated companies into separate (at least from an accounting viewpoint) entities tasked with the production, transmission, distribution and retailing • Preservation of tightly-regulated natural monopolies in
trans-mission and distribution
• Creation of an open wholesale energy and ancillary service mar-ket
• Creation of a regulatory agency tasked with overseeing regu-lated activities (transmission and distribution) and ensuring an efficient market operation
It may be an understatement to say that France did not take the lead in the liberalization of its electricity market. However, after directives were enacted by the European Union, it started on this path and we can highlight the following milestones:
• December 19th, 1996: directive 96/92 organizing the interior electricity market by the "accounting unbundling" of the ver-tically integrated utilities, the creation of open markets for pro-duction and retailing, the establishment of rules for transmis-sion and distribution network access and for exchanges between countries.
• February 10th, 2000: the French law transcribing directive 96/92 is enacted and the "accounting unbundling" as well as the open-ing of the retail market for large customers are carried out. • June 26th, 2003: directive 2003/54 imposes, among other things,
the "legal unbundling" and a time frame for the opening of the whole retail market.
• July 1st, 2004: the retail market for all professional customers and municipalities is opened
• August 9th, 2004: EDF is turned from an EPIC to a "Société Anonyme". Part of its capital is introduced on the stock ex-change on November 21st, 2005. To this date, the French state still owns around 84% of the capital.
• September 1st, 2005: RTE, the French Transmission System Op-erator (TSO), becomes a subsidiary of EDF
• July 1st, 2007: the retail market for all customers is opened • January 1st, 2008: ErDF, the French Distribution System
Oper-ator (DSO) who operates 95% of the distribution network, be-comes a subsidiary of EDF
• July 13th, 2009: directive 2009/72 was meant to enforce the "ownership unbundling", but France obtained the possibility to let the network operators be owned by utilities in exchange for strict rules guaranteeing their financial and technical autonomy. RTE obtained its agreement from the French regulatory agency to operate within this framework in January 2012.
As a consequence of these laws and decrees, the French power sys-tem can be considered nominally liberalized and restructured. De-spite this, a meaningfully competitive environment did not ensue. The fundamental issue behind this state of affairs is the fact that, hav-ing acted as a natural monopoly forced to sell to its retail clients at its long-term marginal cost, EDF can not be dislodged solely by opening up its market. Indeed, its competitors cannot have access to electricity at a price sufficiently low to enter the retail market either through the wholesale market because the price establishes itself at the short-term marginal cost of the incumbent, which is higher than its long-term marginal cost, or through its own investment in gener-ation because it would need to invest at once in a genergener-ation fleet on the scale of the incumbent’s one to take advantage of both the effect of scale due to large generators and that obtained through in-tegrating the operation of generators with complementary technical and economic characteristics (e.g. base, mid-base and peak plants). To remedy this fact and comply with requests from the European Com-mission to effectively open up its electricity market, a law was passed to establish a "new organization of the electricity market" (Nouvelle Organisation du Marché de l’Electricité or NOME law) on Decem-ber 7th, 2010. It consists in creating a mechanism (Accès régulé à l’électricité nucléaire historique or ARENH) that forces EDF to sell up to a 100 TWh a year of the electricity it produces to its competitors at a price "that reflects its economic operation", in complete opposi-tion with the principles of pure and perfect competiopposi-tion. Of course,
such a price is open to interpretation depending on the methodology employed to calculate it. Unsurprisingly, EDF advocated a method taking into account the cost of the generation fleet over its whole life that lead to a 49,5 euros/MWh result, while its competitors favored a net accounting value approach (i.e considering the current level of amortization) that resulted in a 39 euros/MWh. The very visible hand of the government set it in a decree at 40 euros/MWh before changing it to 42 euros/MWh to "take into account the consequences of the Fukushima accident". Such a paradoxical approach led Marcel Boiteux, CEO of EDF from 1967 to 1987, to declare that "we opened up the market to competition to decrease the prices, but now we have to increase the prices to allow competition".
In spite of all the efforts to dislodge EDF from its dominant posi-tion and 14 years after the first deregulaposi-tion law, we are still in the presence of an incumbent actor that owns around 85% of the genera-tion capacity, produces about 90% of the yearly energy and supplies 93% of the residential customers and 92% of the other classes of cus-tomers [15], at a price that is, for most of them, still regulated by the
state. Moreover it is subject to public service requirement such as the obligation to buy renewable at a rate fixed the State or to propose specific tariffs to underprivileged households. This set of observation is the reason why, in this contribution, we have chosen to consider the distributed generators and storage units that could be deployed not as market participants operating in a pure and perfect competitive en-vironment, but rather as parts of a larger generation fleet operating with an aim to minimize the total costs while respecting constraints on reliability and quality, in accordance with the public services re-quirements Electricité De France (EDF) is subjected to.
1.2 d i s t r i b u t e d g e n e r at i o n
In the preceding section, we have explored the evolution of the power system from a decentralized infrastructure to one in which most gen-erators are large-scale and connected to the transmission system. We will now consider a potential reversal of this trend that could be brought about by the advent of new technologies for distributed gen-eration.
1.2.1 Definition
As a general definition of distributed generation, we follow [16] by
considering that Distributed Generation (DG) ’is an electric power source connected directly to the distribution network (Distribution Network (DN)) or on the customer site of the meter’. In this thesis, we will focus on a subset of the distributed generators comprised of
the renewable-based, weather-dependent generators and the storage units.
1.2.2 Distributed renewable generators
1.2.2.1 Characteristics
We will concentrate on distributed renewable generators that convert wind or solar energy into electricity before injecting it into the DN. We make the hypothesis that they are connected to the DN through an Advanced Power Electronic Interface (Advanced Power Electronic Interface (APEI), see [17]) that can control active power injection up
to a limit dependent on the weather condition and reactive power within the limits imposed by the APEI’s apparent power. It should be noted that, due to the power source they tap, such generators have only fixed cost. As a consequence, any decrease in their output below the limit allowed by the weather conditions represents an economic loss for their operators.
1.2.2.2 Drivers explaining their development
The photovoltaic effect was discovered in 1839 and put to practical use by the space industry during the 60s, while the first electricity-generating wind turbine can be dated back to 1887. However, it was not until rather recently that their large-scale integration into the power system was considered. We can classify the reasons behind this change into three categories:
• Environmental aspects: starting in the 70s, it became apparent that an economic development based on the exploitation of non-renewable resources (in particular for energy generation) could not go on indefinitely in a finite world. The seminal work of [18] has been influential in propagating this viewpoint while
the 2004 update of their report [19] confirmed the validity of
the models used. As long as they attain an Energy Return On Investment (Energy Return On Investment (EROI), [20] and [21])
sufficient to allow the "continued economic activity and social function" of the society they supply, renewable energies could be a solution to this issue [22]. Available data on EROI presents
large variability but [23] indicates a range of 3-10:1 for solar
and an average of around 18:1 for wind energy, which is com-patible with the preliminary results in [22]. In parallel, the
grow-ing concerns over the potential consequences of climate change, epitomized by the creation of the International Panel on Cli-mate Change (IPCC) in 1988 and the release of their first report in 1990 [24], represent another purpose of renewable energy
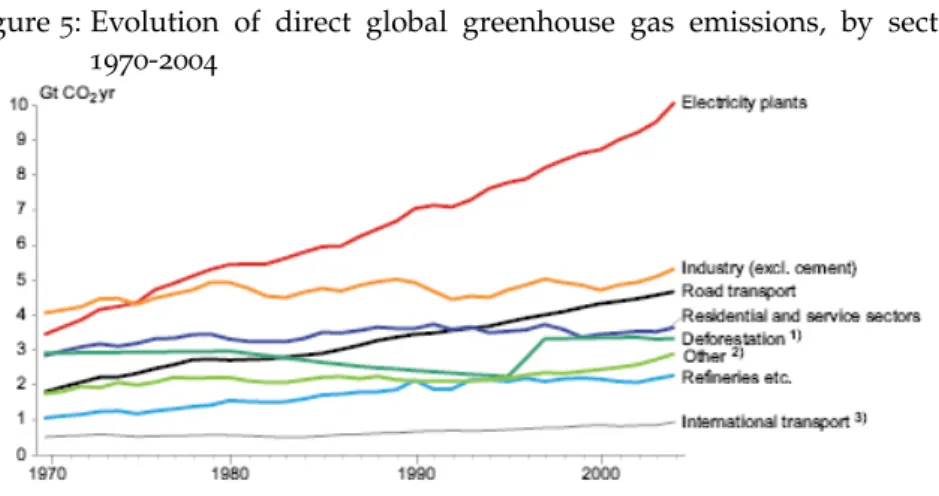
ex-pansion. Indeed, Figure 5taken from [25] shows the dominant
Figure 5: Evolution of direct global greenhouse gas emissions, by sector,
1970-2004
Figure 6: Life-cycle greenhouse gas emissions for selected power sources
Figure 6extracted form [26] illustrates the desirable properties
of renewable energies in this respect.
• Social preferences: the deployment of distributed generators, owned by individual households or at a community level [27]
corresponds to a new, more horizontal organization of the econ-omy that is emerging [28]. In addition, visions of energy
auton-omy -100% reliance on renewable energies- like [29] or [30]
cre-ate powerful narratives facilitating their social acceptance and increasing citizens’ active involvement.
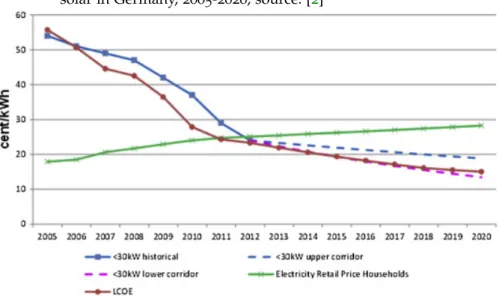
• Economic competitiveness: in a positive feedback loop, the pub-lic support for renewable energies, embodied in various sub-sidies, has created expanding commercial outlets for manufac-turers, allowing them to invest in larger production facilities and research and development, which has then led to reduc-tion in producreduc-tion costs and increased interest in their devel-opment. Figure 7 and 8 display the evolution of the levelized
cost of electricity (Levelized Cost Of Electricity (LCOE)) for pho-tovoltaic and wind respectively, while Figure 9 compares it to
Figure 7: Historic and projected evolution of levelized cost of electricity for
solar in Germany, 2005-2020, source: [2]
Figure 8: Evolution of levelized cost fo electricity for wind, 1980-2010,
source: [3]
Figure 9: Comparison of levelized cost of electricity for various type of gen-erators, source: Fraunhofer Institute
1.2.2.3 Structures of incentives
In some countries, the public support in favor of a larger integration of renewable energies to the power system has turned into a political will to provide a regulatory environment favoring it. Each country introduced a specific set of rules, but they can be grouped into three broad categories, with France having adopted a mix of the first three ones:
• feed-in-tariffs (Feed-In Tariffs (FIT)): all the electricity generated is injected into the grid and sold to the utility at a price fixed by law for the expected lifetime of the installation [31]. The
util-ity is forced to buy the electricutil-ity and is compensated, usually through a specific tax scheme. The idea is to set the price at a value high enough to make the investments profitable, but not too high to contain the costs passed on to electricity end-users. This has not always been done very well, especially in the French case, where FITs for Photovoltaic (PV) were massively increased in 2006 to catch up the delay and stayed high until 2010(see Figure10), at a time when PV costs were significantly
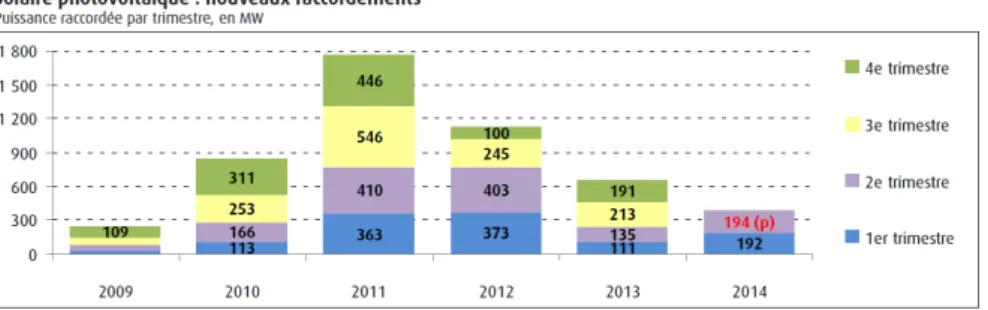
lower, creating an undue profitability and a predictable surge in connection requests (see Figure11). Fearing ballooning costs
for end-users, the government suspended the mechanism until it came up with a self-correcting scheme with changes in tariffs every three months, very successful at containing costs by effec-tively slashing the yearly installed capacity to 650 MW in 2013. For PV, it is usual to create several classes of FITs according to the size of the installation, so that not only utility-scale projects are carried out.
• premium: in a manner very similar to feed-in tariffs, producers are paid a rate fixed by law that is not supposed to cover all the costs but rather is supplementary to the revenue coming from the wholesale market.
• net-metering: it is in essence equivalent to the FIT scheme, with the only difference being that only the net energy injected in the network is paid at a premium rate [32]. However, if the rate
for net-energy injection is the same as the FIT, as is the case in France, net-metering is a net loss for generator operators as the cost of retail electricity is usually lower than the FIT.
• tax credit: like the first two methods, it is a price-based policy. The main differences are the fact that costs are borne by the state instead of the utility and that they are due at the construction instead of spread-out over the lifetime of the plant.
• renewable portfolio standard: it consists in mandating utilities to incorporate a minimum percentage of renewable energy to
Figure 10: Evolution of FITs in France for various type of installations,
2002-2014source: photovoltaique.info
Figure 11: Evolution of installed PV capacity, 2009-2014, source: Commis-sariat Général au Développement Durable
their supply and is thus a quantity-based policy. It is generally supported by the issuance of renewable energy certificates to el-igible producers that are then traded on a specific market, a fea-ture that allows utilities to meet their requirements in the most cost-effective manner, according to proponents of this mecha-nism [33].
Each type of incentive has specific advantages and drawbacks, but, in general, price-based mechanisms are more effective to jump-start a market by removing part of the risks for investors (see [34] and
[35]) at the cost of having less controllable outcomes in terms of
in-stalled capacity and the associated financial burden. On the contrary, renewable portfolio standards allow a better control of costs but can sometimes fail to attain their goal in terms of capacity addition, de-pending on details of their implementation [36].
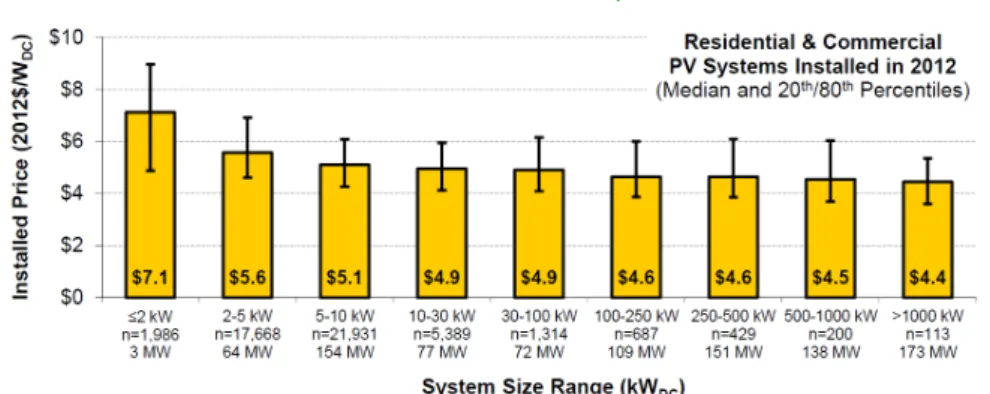
Figure 12: Installation price of residential and commercial PV according to
their size in the USA, 2012, source: [4]
1.2.2.4 Motivations for a distributed deployment
A particular decision to invest in a renewable generator is the result of a complex process involving considerations on technical and financial aspects of the installation, the financial status and the personal pref-erences of the potential investor and the local and national regulatory environment. Nonetheless, two aspects specific to renewable genera-tors can be identified to explain their propensity to be deployed in a distributed fashion:
• The energy converters used are modular, thus allowing even small installations to enjoy, to a certain extent, the effects of scale in upstream manufacturing. Larger plants still have additional effects of scale, but they become tenuous above 100 kW and vanish around 1 MW and higher, see Figure 12 and Figure 13.
The consequence is that investments in renewable are accessible to a wide array of potential investors.
• The primary energy they use is inherently diffuse. This ensures that a large array of siting opportunities with suitable weather condition exist.
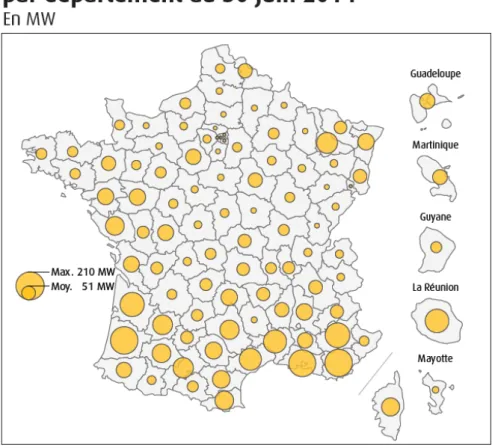
Combining these two characteristics with a size-dependent FIT war-rants the availability of many potential sites of various sizes that could achieve a LCOE low enough to be profitable. This can explain why a significant proportion of the PV generators are connected to the distribution network, as Figure 14illustrates (the category "> 250
kW" contains all the installations connected to the transmission sys-tem but also some generators connected to the distribution syssys-tem), and why these are rather well shared out across the country, as Fig-ure28.
1.2.2.5 Impacts on the Power System
Since the interconnection of regional areas and the concentration of generators at the transmission level, the distribution network has
Figure 13: Installation price of utility-scale PV according to their size in the USA, 2012, source: [4] < 3 kW 3 kW< <9 kW 9 kW< <36 kW 36 kW< <100 kW 100 kW< <250 kW >250 kW Thousands of PV installations 0 50 100 150 200 250
(a) In terms of number of installations
< 3 kW 3 kW< <9 kW 9 kW< <36 kW 36 kW<
<100 kW 100 kW< <250 kW >250 kW
Installed capacity (in MW)
0 500 1000 1500 2000
(b) In terms of installed capacity Figure 14: Distribution of the size of PV installations in France, June 2014,
Figure 15: Installed capacity by region,June 2014, source : Commissariat Général au Développement Durable
been planned and operated in a passive manner and under the as-sumption of unidirectional power flows. If we exclude research ex-periments, the dominant mode of integration of distributed renew-able generators is the fit-and-forget approach [37], that consists in
reinforcing the network to alleviate any potential local constraint and then letting the generator inject active power in the grid at the max-imal output allowed by the meteorological conditions and at a unity power factor. When the penetration of DG remains marginal at a local and national level, this method is justified as the existing margins in network and power plant capacity help restrain the costs associated to passive DG connection while also avoiding the large investment in software, communication, measurement and control technology needed for an active distribution network (Active Distribution Net-work (ADN)) [38] and [39]. However, when the level of penetration
becomes significant relative to the other determinants of the power system, DG will have impacts on both the local distribution network and the centralized power system, denoted respectively local Electric Power System (EPS) and area EPS in [40], where a comprehensive
re-view of these impacts is undertaken. Impacts on the distribution network:
• Voltage profile: the assumption on unidirectional power flows ensures that the voltage will be decreasing between the sub-station and the loads, allowing the voltage downstream of the substation to be set at a high value, see Figure 16. However,
when DG injection surpasses load, voltage will increase, as in Figure 17, compelling changes in the management of voltage
profiles [41–43].
• Line flows: if DG produces reliably during peak load, it can help defer investment in new lines to alleviate line intensity con-straints. Conversely, if its maximal output entails reverse power flows higher in magnitude than the maximal flows associated to the preexisting load, investments will need to be carried out [44,45].
• Line losses: as line flows change, line losses will too, albeit in a quadratic manner. This will influence the operational expenses of the distribution system operators [46,47].
• Short-circuit current: depending on the relative location of the DG, the protective device considered and the fault envisioned, DG will either increase or decrease the short-circuit current. The protection and coordination need to be adapted in consequence [48–50].
• Power quality: DG can cause the injection of harmonics and direct currents or provoke flickers [51–53]
Impacts on the centralized power system:
• Transmission system: in essence, the impacts on the transmis-sion are the same than those on the distribution system. How-ever, the fact that they result in costs or benefits and the ampli-tude of those will of course depend on the determinants of the transmission system (aggregated load profiles, thermal limits, impedances,...). As a consequence, it is conceivable that a given DG could bring benefits to the distribution system and costs to the transmission system, if for example, the aggregated load profile at the different levels have non-coincidental peaks. • Power plant operation: DG will modify the net load profile that
centralized power plant are expected to serve. As a consequence, power plants are likely to operate at different set-points and, if the variation in DG output are more dynamic than usual load variation, with more load-following duties [54]. In systems with
very high penetration of DG and inflexible base load power plants (typically nuclear or coal), conflict can arise between the must-run constraints of these plants and the injection of DG. Figure18illustrates this phenomenon by displaying the output
of the various type of plants as well as the prices in energy mar-kets that become negative PV and output are high and must-run constraints prevent conventional generators from being turned-off.
• Reserve sizing: standby and spinning reserve are used to com-pensate short-term, unpredictable variations in load and power plant availability. The introduction of DG will change the am-plitude and dynamic nature of the variations in the net load. In a manner comparable to load-following, albeit at a shorter time frame, the minimum level of standing and spinning reserve will need to be reevaluated [55–57].
• Spinning reserve provisioning: spinning reserve are usually sup-plied by conventional generators operating below their maxi-mal output. As DG will displace conventional generators, the remaining will need to operate farther from their optimal set-point or new means of reserve provisioning will have to be in-troduced [58].
1.2.3 Distributed storage units
Storage is often presented as the natural companion to intermittent renewable generators as, intuitively, it could be used to store energy when production is high compared to the load and discharge it oth-erwise, allowing the intermittent generators to act as dispatchable
Figure 16: Voltage in a distribution without DG, source: [5]
Figure 17: Voltage in a distribution without DG, source: [5]
Figure 18: Output of PV, wind and conventional power plants with the
ones [59], thus eliminating their main negative feature. In this
sec-tion, we will endeavor to nuance this viewpoint first by presenting the defining characteristics of storage units before detailing the roles they could play in the power system. To clarify, we are not opposing distributed storage units that could be controlled and coordinated to distributed renewable generators that could only be deployed in an uncoordinated manner, but rather separating distributed renewable generators, that could be deployed for reasons other than optimiz-ing the power system operation (see Section1.2.2.2) and thus maybe
in an uncoordinated fashion, from distributed storage units, whose only purpose is optimizing power system operation and whose de-ployment should thus be coordinated with power system operation.
1.2.3.1 Characteristics
Electricity is notoriously difficult to store and so most of the storage technologies, to the exception of supercondensator and superconduct-ing magnetic energy storage (Super Magnetic Energy Storage (SMES)), consists in converting the electrical energy into another form of en-ergy to store it before converting it back when needed. Table 1
de-scribes the most common storage technologies and the form of en-ergy they are converting electricity to. We include pumped-hydro and compressed-air energy storage despite the fact that, in their current commercial form, these systems require a connection to the trans-mission system due to their size because current developments may allow small-scale versions of these technologies to be viable in the future, see [60,61] Detailed descriptions of each storage technologies
are available in [8].
s t o r a g e t e c h n o l o g y e n e r g y f o r m
Supercondensator Electrostatic field
SMES Magnetic field
Solid state batteries Chemical
Flow batteries Chemical
Pumped Hydro Potential
Flywheel Kinetic
Compressed-air energy storage Pneumatic
Table 1: Storage technologies and their associated energy form
To compare the various storage technologies between themselves, several parameters can be considered:
• Power and energy capacity: while it is technically conceivable to consider a lead battery storage system of several hundred
MW or a pumped-hydro storage system of a few kW, imple-mentation and economic constraints impose minimal and max-imal power and capacity for storage systems according to the technology considered, that are summarized in Figure 19. It
should be noted that only existing large-scale pumped-hydro and compressed-air energy storage are displayed, and that the figures concerning these technologies could evolve significantly in the future.
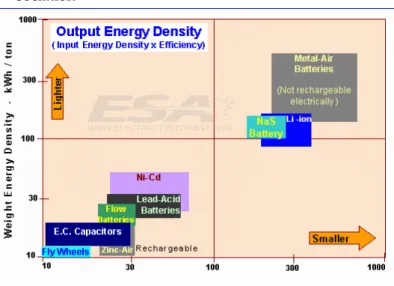
• Energy density: In a context where storage is a potential can-didate for connection at the distribution level where space and load-bearing capacity may be limited, the volume and weight of storage systems may be an influential factor. Figure 20
dis-plays the energy density in weight and volume of the various technologies.
• Capital cost: the relevance of this factor is self-evident. When dealing with storage, it is usual to separate the cost into two components: one linked with power and one with capacity. In-deed, the various storage technologies can have very contrast-ing discharge duration and so there is no linear relationship between these two parameters. Moreover, we will see that some applications of storage will be focused on power while others will be limited by the energy available and so the cost of both aspects have to be differentiated, a feat achieved in Figure21.
• Efficiency and lifetime: for some applications such as price ar-bitrage, efficiency is an essential parameters as it determines the profitability that can be expected. The lifetime (expressed in term of the number of cycles that can be achieved at a given depth of discharge) is a crucial factor whatever the application is as it dictates when a storage system will need to be replaced and has thus a great influence on the overall cost associated to the implementation of a storage system for a given applica-tion and a given operaapplica-tion duraapplica-tion. Figure 22 illustrates both
aspects.
• Response time: it is the time taken by the storage device to reach its full output. This parameter will influence the suitability of a given storage technology for applications demanding a high reactivity, such as spinning reserve provisioning. Ranges of esti-mates for this parameter are available in Table2.
• Technological maturity: electricity storage is a field in which technologies at very differing stages of development co-exist. Thus it is useful to have an idea of their maturity so as to, for example, estimate the potential for future cost reduction or the reliability of implementation feedback. Figure 23 gives an
Figure 19: Power and Energy Capacity, source: Energy Storage Association
s t o r a g e t e c h n o l o g y e n e r g y f o r m
Supercondensator < 1/4 cycle
SMES < 1/4 cycle
Solid state batteries < 1/4 cycle
Flow batteries < 1/4 cycle
Pumped Hydro sec-min
Flywheel < 1 cycle
Compressed-air energy storage sec-min
Table 2: Estimates of response time for various storage technologies, source
: [10]
1.2.3.2 Applications
In the section 1.2.2.5, we have summarily described the various type
of impacts that the introduction of distributed renewable generators could have on the power system. With their ability to control injection and consumption and their potentially distributed implementation, storage systems have applications that can be conceived as symmet-rical to the impacts of distributed renewable generators and that we will now specify, along with potential technical alternatives. For a thorough discussion of this subject in a broader context, the reader is advised to consult [8,62,63].
Applications in the distribution system:
• Voltage profile: in a straightforward manner, storage systems can help control voltage by consuming active power when the local production is too high and injecting it otherwise.
More-Figure 20: Weight and Volume Energy Density, source: Energy Storage As-sociation
Figure 21: Capital Cost per Unit Power and Energy, source: Energy Storage Association
Figure 22: Efficiency and Lifetime, source: Energy Storage Association
over, if storage systems are connected to the grid through APEIs and the R/X ratios of the lines are suitable, they can help control voltage by managing reactive power, at the expense of possibly higher losses [64]. For this application, storage has to be
com-pared with other suitable alternatives or combination thereof: reactive power control through intermittent distributed gener-ation APEIs, on-load tap changer management, adaptgener-ation of FACTS devices to the distribution network, demand response or dispatchable distributed generation such as fuel cells or re-ciprocating engines.
• Line flows: distributed storage system can smooth out line flows, thus allowing investment deferral on upstream distribution net-work equipment, a service that could also be achieved by de-mand response and other forms of dispatchable distributed gen-eration.
• Line losses: as line flows change, line losses will too, albeit in a quadratic manner. This is more likely to be a by-product of another application (e.g. peak shaving for investment deferral), as operating a storage system solely for loss reduction purposes is not usually a sensible approach considering the level of losses in the DN and the efficiency of the storage systems (i.e. storage losses would be higher than prevented network losses).
Application in the centralized power system:
• Transmission system: in essence, the applications of distributed storage for the transmission system are the same than those for the distribution system. However, the fact that they result in costs or benefits and the amplitude of those will of course depend on the determinants of the transmission system (aggre-gated load profiles, thermal limits, impedances,...). As a conse-quence, it is conceivable that a given distributed storage could bring benefits to the distribution system and costs to the trans-mission system, if for example, the aggregated load profile at the different levels have non-coincidental peaks, see Figure24.
• Power plant operation: In a system where intermittent genera-tors co-exist with inflexible baseload generagenera-tors, storage can be used to minimize the total running cost of the system by, for example, storing energy when intermittent production is high to prevent the stopping of generators with high start-up cost and discharging it at the peak load to avoid the use of gener-ators with high running cost. In essence, this is the same ap-plication for which 5 GW of pumped-hydro are used today in France : storing the excess nuclear energy during the night to discharge it at the evening peak. The only difference being that, with the introduction of intermittent generation, the net load is
Figure 24: Non-coincidental peak for system and transformer load, source:
[8]
Figure 25: Use of storage in combination with intermittent and inflexible generators, source: NRStor
expected to be more variable, leading to more opportunities for cost-effective shifting of energy by storage systems. Figure 25
displays a stylized view of this application. It should be noted that, for this application, storage is in competition with other alternatives such as intermittent generation curtailing, demand response or investment in flexible generation, as exemplified in Figure26.
• Load-following and reserve provisioning: Storage technologies with suitable response times could be used to replace conven-tional generators for the provisioning of these ancillary services [65, 66]. Moreover, storage systems are able to provide both
downward and upward reserve, a feature that will become rel-evant in grids with high intermittent generator penetration [67, 68]. Such ancillary services could also be provided by demand
response, intermittent generation curtailing or flexible genera-tors.
Figure 26: Various options for matching load and demand in systems with
intermittent and inflexible generation, source: [9]
1.3 e x i s t i n g a p p r oa c h e s f o r i m pa c t m i t i g at i o n
1.3.1 Local control
In the preceding section, we have introduced the general concept of distributed generation before considering in more detail two specific subsets: distributed renewable generators and storage systems. In par-ticular, we have reviewed the impacts that distributed renewable gen-erators could have on the power system as well as the roles that stor-age systems could fulfill.
Many approaches have been put forward to try and mitigate the more immediate impacts of renewable distributed generation at the distribution level (i.e voltage rise) and increase the acceptable level of penetration by abandoning the fit-and-forget approach while relying on local measurement and control so as to avoid massive changes in distribution network architecture. Most of them can be classified into one of the three categories, based on the physical quantity controlled: • Reactive power compensation: controlling reactive power injec-tion of distributed generainjec-tion inverters so as to maintain voltage inside the desired limit [69–72].
• On-load tap changer control: controlling the tap setting of the transformer to modify its output voltage and thus the voltages in the rest of the network [73–76].
• Generation curtailment: disconnecting or limiting the output of distributed generators as a last resort to mitigate voltage rise [77–79]
Compared to the fit-and-forget methodology, these techniques allow for a much higher level of penetration of distributed generation (as much as 72% in a specific case study according to [80]). However, this
could still be improved by more centralized supervision and control capabilities, the subject of the next section, which could also unlock
the potential ability to provide impact mitigation and benefits not only to the local distribution network but also to other areas of the power system.
1.3.2 Active Distribution Network
1.3.2.1 Definition
The earliest reference to the concept of Active Distribution Network (ADN) that we found in the literature is [81]. According to the author,
it is a concept based "on a vision in which distribution networks have the physical structure and the control options that were traditionally only found in transmission systems". On a conceptual level, this is justified by the fact that, if a significant level of DG penetration is en-visioned, the role of the distribution network will not anymore be to only serve loads but rather to interconnect them with generation, in a manner similar to the transmission system. Since then, more concrete and applicable definitions of ADN have been proposed, such as in [82–84] or [85]. For our purpose, we will adopt the latest version of
the definition put forward by the CIGRE SC6 Working Group [86] and
taken up in [87]: "Active distribution networks (ADNs) have systems
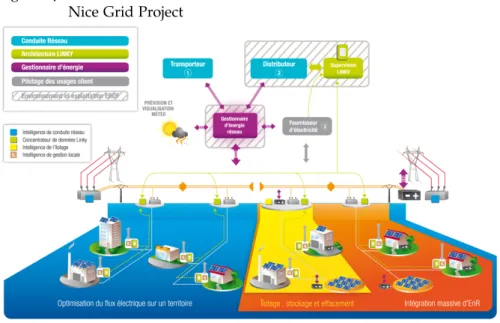
in place to control a combination of distributed energy resources ( Distributed Energy Resources (DER)s), defined as generators, loads and storage. Distribution system operators (DSOs) have the possibil-ity of managing the electricpossibil-ity flows using a flexible network topology. DERs take some degree of responsibility for system support, which will depend on a suitable regulatory environment and connection agreement." In particular, this entails the existence of sensors, actu-ators and the associated information and communication infrastruc-ture to allow the supervision and control of the system. An example of the architecture of an ADN is take from the Nice Grid demonstra-tor project and reproduced in Figure27
1.3.2.2 Existing Approaches for ADN management
In parallel to the drive to define accurately what the technical fea-tures of an ADN could be, a flurry of work has been published to propose various management strategies able to take advantage of the control capabilities of ADNs to maximize the benefits they bring to the power system at the operational stage. We now propose a clas-sification of these approaches according to which aspect of power system operation they put their emphasis on. We have chosen to use existing concepts to avoid the useless creation of terminology but the drawback is that, due to the lack of widely agreed upon definitions, there may exist conflicts between our definitions and some uses in the literature.
Figure 27: Possible Architecture of an Active Distribution Network, source: Nice Grid Project
• The Microgrid, where DG and distribution network are oper-ated in coordination with an aim to satisfy local network con-straints and objectives [88], [89], [90], with an emphasis on
po-tential planned or unplanned islanded operation.
• The Commercial Virtual Power Plant, in which DG capabili-ties are aggregated in order to bring services to the centralized power system [91], [92], [93], [94], generally in the form of
mar-ket participation [95]
• The Technical Virtual Power Plant [96], [97], [98] where DG and
distribution network are grouped according to electrical and geographical determining factors (usually all elements down-stream of a considered substation) and operated in coordination to satisfy local network constraints and objectives while consid-ering the interaction with the Centralized Power System (CPS) through the possibility to buy and sell electricity considering market prices (with a price taker assumption) or time-of-use prices.
In the Commercial Virtual Power Plant concept, the local distribution network constraints and objective are ignored which implicitly means that the benefits and impacts DG could bring to the distribution sys-tems cannot be modeled. Conversely, in the Microgrid approach, the emphasis on local network constraints and objectives prevents from evaluating DG interactions with the centralized power system. There-fore, the Technical Virtual Power Plant approach is the most aligned with our purpose as it takes into account distribution network con-straints and objectives and models the influence of the centralized power system operation on DG operation. However, hidden in the
price taker assumption or the utilization of time-of-use prices is the fact that the influence of DG active operation on CPS operation cannot be apprehended through such a framework. This is not an issue when only marginal DG penetration (at the scale of the whole power sys-tem considered) is envisioned as centralized power syssys-tem operating points would not be meaningfully altered by DG operation. Nonethe-less, large DG penetration at the national level will influence central-ized power system operation, in particular with regards to the inter-action between DG and inflexible centralized generators, and an as-sessment of the costs and benefits of DG has to take this into account, especially considering our particular focus on the French power sys-tem, in which the centralized power system is still operated in an integrated manner by a single actor.
Independently of the issue outlined above, the similarities between the current transmission network and the future ADN lead us to as-sume that the Optimal Power Flow (Optimal Power Flow (OPF)), a framework first introduced in 1962 by [99] and now widely used for
the planning and operation of the transmission network, will prove useful as a tool to manage the integrated operation of DG and ADN. However, it has been remarked by several authors such as [100] and
[101] that some characteristics inherent to the distribution system
(in particular high R/X ratios and the radial nature of its topology) prevent us from applying traditional transmission system OPF algo-rithms, such as the Newton-Raphson method implemented in, for example, the Matpower package [102]. Moreover, simplifications
com-monly used in the planning of the transmission system, such as the linearization of the power flow constraints, are known to produce poor results with high R/X networks.Thus, and despite recent ef-forts that we will detail in the relevant chapter, we are still lacking a methodology to solve the OPF in the distribution network that is satisfactory in terms of convergence properties, low computational requirement and versatility, either to establish control strategies at the operational stage or simulate the operation at the planning stage.
1.3.2.3 Integration at the planning stage
In the sections dealing with the impacts and benefits of DG, we have observed that some of those have consequences not only at the op-erational stage but also at the planning stage (transmission or distri-bution network investment deferral or investment in new production capacity). As a consequence, a fully integrated assessment of DG can-not be achieved without considering the planning stage. In the trans-mission system today, a planning option is usually evaluated by sim-ulating the operation of the system using a simplified version of the OPF implemented at the operational stage. Due to the lack of such a methodology for the distribution system, integration at the planning
has only been envisioned under the assumption of passive operation [103–106] or with limited control [107].
1.4 o b j e c t i v e s
In this introduction, we have started by describing the evolution of the power system from its inception up until the current situation of a highly centralized power system. Then we discussed the develop-ment of distributed generation, with a particular focus on distributed renewable generators and distributed storage systems, the drivers be-hind their development and their impacts on various aspects of power system operation and planning. We continued by relating the exist-ing propositions to mitigate these impacts and harness these benefits, from decentralized control warranting little investment and change in distribution network management to integrated operation relying on a yet-to-be developed supervision, communication and control infras-tructure that would turn the current passive distributed network into an active one. This investigation has prompted us to identify several areas of the existing literature that we could improve upon, leading us to assign ourselves the following scientific objectives:
• Propose a mathematical framework defining the fully integrated operation of DGs, ADNs and the centralized power system as the solution to an optimization problem under constraints. • Develop a decomposition and coordination methodology able
to turn the large-scale, non-linear, mixed-integer optimization problem resulting from the objective above into a series of smaller and less complex master and sub-problems.
• As the sub-problems turn out to be single-stage OPFs in the distribution system, propose an algorithm able to solve them while guaranteeing convergence, low computational cost and versatility.
• Advance a technique able to identify beforehand which sub-problems will effectively influence the objective value, so that only those are solved in order to evaluate a planning option in the most computationally effective manner.
In addition to the objectives outlined above that have led to novel con-tributions, a separate work has been undertaken to obtain relevant datasets. Indeed, developing a methodology to assess the impacts of DG without applying it to realistic data, especially concerning net-work characteristics and load profiles, is moot. For load profiles, I took advantage of the work by my colleagues at the PERSEE research center, while network data was obtained by establishing a partnership with ErDF in order to carry out a first attempt at a taxonomy of the
![Figure 13: Installation price of utility-scale PV according to their size in the USA, 2012, source: [ 4 ] < 3 kW 3 kW< <9 kW 9 kW< <36 kW 36 kW< <100 kW 100 kW< <250 kW >250 kWThousands of PV installations050100150200250](https://thumb-eu.123doks.com/thumbv2/123doknet/3041187.85694/28.892.252.735.246.441/figure-installation-utility-scale-according-source-kwthousands-installations.webp)
![Figure 23: Technological Maturity of Storage Technologies, source: [ 7 ]](https://thumb-eu.123doks.com/thumbv2/123doknet/3041187.85694/37.892.194.598.771.1003/figure-technological-maturity-storage-technologies-source.webp)