O
pen
A
rchive
T
OULOUSE
A
rchive
O
uverte (
OATAO
)
OATAO is an open access repository that collects the work of Toulouse researchers and
makes it freely available over the web where possible.
This is an author-deposited version published in :
http://oatao.univ-toulouse.fr/
Eprints ID : 19565
To link to this article : DOI:
10.1021/acs.iecr.7b02125
URL
http://dx.doi.org/10.1021/acs.iecr.7b02125
To cite this version : Seihoub, Fatima-Zohra and Benyounes, Hassiba
and Shen, Weifeng and Gerbaud, Vincent : An Improved Shortcut Design
Method of Divided Wall Columns Exemplified by a Liquefied Petroleum
Gas Process (2017), Industrial & Engineering Chemistry Research, vol.
56, n°34, pp.9710 - 9720
Any correspondance concerning this service should be sent to the repository
administrator:
[email protected]
An Improved Shortcut Design Method of Divided Wall Columns
Exempli
fied by a Liquefied Petroleum Gas Process
Fatima-Zohra Seihoub,
†Hassiba Benyounes,
†Weifeng Shen,
*
,‡and Vincent Gerbaud
§,∥†Laboratoire physico-chimie des matériaux, catalyse et environnement, USTO, Oran 31000, Algérie ‡School of Chemistry and Chemical Engineering, Chongqing University, Chongqing 401331, China
§Université de Toulouse, INP, UPS, LGC (Laboratoire de Génie Chimique), 4 allée Emile Monso, F-31432 Cedex 04 Toulouse, France
∥CNRS, LGC (Laboratoire de Génie Chimique), F-31432 Cedex 04 Toulouse, France
ABSTRACT: Designing a sustainable and economical distillation system is a big global challenge in the industrial chemicalfield. To address this issue, one of most promising solutions is the so-called dividing wall columns addressed in this work, which not only can cut energy cost but also use limited installation space. An improved shortcut design approach is developed in this work to provide accurate models for each section of dividing wall columns; meanwhile Underwood’s and Gilliland’s equations are employed to determine minimum reflux ratio and total number of stages in different column sections in terms of corresponding design specifications and operating conditions. This proposed approach has been applied to separations of mixtures of hydrocarbons and alcohol with different values on the ease of separation index. To test its effectiveness, the preliminary design parameters obtained through the improved proposed shortcut
method are further validated by a rigorous simulation in Aspen HYSYS. Furthermore, the results indicate that this method could provide much more accuracy of average interconnecting stream composition of the prefractionator and main column than those of other methods. In practice, this method has been applied to a case of liquefied petroleum gas (LPG) separation with three targeted products in an industrial liquefied petroleum gas plant. The applications and efficiency of the shortcut method in this study lay a theoretical foundation for designing the separation of ideal mixtures involving dividing wall columns.
1. INTRODUCTION
Distillation remains one of the most widely used and reliable separation processes in the chemical engineering industry. The efficient designs and operations of separation systems play crucial roles in the chemical process industry.1−3Therefore, it is particularly necessary to develop sustainable and economic distillation systems based on thermodynamic efficiency studies. The most promising system, dividing wall columns (DWCs), is proposed in this respect. It comes along with a single condenser and a single reboiler and one or even more longitudinal dividing walls packaged in a single shell. This tight integration makes the design and simulation tougher in comparison to conventional distillation columns.
The DWCs have frequently been applied to the separation of various systems including hydrocarbons, alcohols, aldehydes, ketones, amines, and other kinds of mixtures.4−9Furthermore, DWCs can also be extended to azeotropic, extractive, and reactive distillation without any major changes to the types of internal configurations.8,10 Despite the fact that DWC technology promises a significant reduction in both operation and investment costs compared to conventional two column systems,11−14its application is still rare in real industry due to the complexity in their design and simulation.8
To simplify the design procedure, some design methods have been proposed based on the sequence of conventional distillation columns; however, one major concern among these design approaches is the interconnecting streams between the prefractionator and the main column. The compositions of two interlinked column sections are assumed to be identical, and the trays in these sections are selected in order to ensure the similarity of compositions as much as possible. The mismatching between the compositions of interlinking streams and interlinking trays is the main reason for inefficiency of design of DWC processes.15
Based on the compositions of interconnecting streams estimated solely upon the prefractionator, Triantafyllou and Smith16 calculated the minimum vapor flow rates of each section in the main column through the extended Underwood equation,17 while Ramirez-Corona et al.18 gave priority to determining interconnect flow compositions rather than minimum vapor flow rates. Hosanna19,20 determined the number of stages, without using Fenske and Gilliland equations,
in every column section on the basis of its operating conditions and product specifications. When it comes to a group of stages, the K-value of the key component in the stream is assumed to be constant, and it has been estimated according to functionalities of column sections.19,20 However, the studies mentioned above neither linked two columns through interconnecting stream compositions nor calculated the minimum vapor flow rate in the side draw. Based on the Fenske, Underwood, Gilliland, and Kirkbride equations, our previous study, Benyounes et al.,21developed a novel shortcut method involving the establishment of systematically different equation profiles to assess feasible design parameters such as reflux ratio, interlinking vapor and liquid streams, and liquid and vapor split ratios to minimize energy consumptions. The approach of differential composition profiles in each column section is achieved by considering some feasible key design parameters. Chu et al.22presented a novel design method that could be applied to all three types of DWCs. They applied the
shortcut method of Fenske, Underwood, Gilliland, and Kirkbride to determine the total number of stages of each section. The values of RLand RVare chosen to obtain the same number of trays in the prefractionator and side section. However, it suggests iterative adjustments in the design of the sections of the main column, which makes the method a little tedious. The design procedure for DWC using shortcut methods published by Benyounes et al.21 and Chu et al.22 confirmed only the accuracy of minimum operating conditions. The shortcut method proposed in this study is able to provide more accurate and more effective prediction of composition of interlinking streams. Some research progress on shortcut methods for designing DWC processes is summarized in
Table 1.
The study mentioned above presents a black-hole deficiency in design of DWCs restricting terribly the ability to reach the desired specifications.16,18−21,23,24To overcome this dilemma, in this work, we attempt to ascertain the accuracy of minimum Table 1. Summary of Some Shortcut Design Methods for Divided Wall Columns
references mode method assumptions
Triantafyllou and
Smith16 3-column se-quence model FUGK method; Minimum cost Constant relative volatilities; Constant molar overflow
Amminidin et al.25 2-column
se-quence model
Semirigorous equilibrium stages method Constant relative volatilities; Constant molar overflow; Product distribution Estimation at Rmin
Young Han Kim
et al.26 2-column se-quence model Fenske equation; FUG equations; NTotal= 2NTotal,min Equilibrium is assumed to be reached the vapor and liquid ofinterlinking streams
Halvorsen and
Skogestad27,28 2-column se-quence model Underwood’s equation; Vmindiagram method Constant relative volatilities; Constant molar overflow; Infinitenumber of stages
Sotudeh and
Shahraki29,30 3-column se-quence model Underwood’s equation; Ncalculation of Interconnection streamsTotal,pre= NTotal,side; Composition Constant relative volatilities
Ramirez Corona
et al.18 3-column se-quence model FUGK method; Composition calculation of Interconnectionstreams; TAC minimization. Constant relative volatilities; Constant molarinterconnecting streams are assumed to be saturated.flow rate; The
Kai Ti Chu et al.22 6-section model Components netflow model; FUGK method. Constant relative volatilities; Constant molarflow rate; Symmetric column
Hosana et al.19,20 5-section model Fenske equation; Component netflow model; Kremser group method
Constant relative volatilities; Constant molarflow rate; Symmetric column
Benyounes et al.21 5-section model Component netflow model; FUGK method; Systematic
calculation using differential equation profiles Constant relative volatilities; Constant molarcolumn flow rate; Symmetric
operating conditions and reduce the average composition difference between the interconnecting streams of the prefractionator and those of the main column simultaneously. We propose an improved shortcut approach that combines the advantage of some typical popular shortcut methods,16,18,20 which allows accurate determination of the composition of liquid and vapor interlinking streams and at the same time satisfying of the minimum vaporflows.
The separation of ternary mixtures of hydrocarbons and an alcohol mixture is taken as an illustrative case to explain the proposed approach. The obtained initial design parameters are then validated by a rigorous simulation using Aspen HYSYS. Then, the proposed design procedure is further applied to a complex process of liquefied petroleum gas (LPG) fractiona-tion in actual Algerian industrial gas manufacture.
2. SHORTCUT DESIGN METHOD
The schema of the proposed design method for DWCs is described in this section. The shortcut design procedure is based on the fully thermally coupled distillation column configuration (FTCDC) for the separation of a ternary mixture of components A, B, and C, where A refers to a light component recovered at the top of the column, B is the middle boiling component recovered in the side draw, and C represents a heavy component recovered as the bottom product. The schematic diagram of applied DWC model and component netflow in FTCDC is illustrated inFigure 1.
The configuration of the applied DWC model is divided into six sections. The outputflows from the prefractionator feed the main column through upper and lower interlinking trays, while the vapor and liquid flows going into the prefractionator are from the main column. The feed split the prefractionator of DWCs into two column sections, S1_1 and S1_2. The main column is divided into four sections: column sections S2 and S3_1 are coupled around the upper interlinking stages, while column S3_2 and S4 are coupled around the lower interlinking stages.
The design method for FTCDC is proposed in this section. Since there are two interlinking streams between the prefractionator and main column in this configuration, the conventional column design procedure can be executed only if the compositions of interlinking streams are specified. In this work, the design problem is carried out in two steps: conceptual design and rigorous simulation. In this approach, we established to build a new component net flow model, which is applied to find the product compositions of each column section. The structure equations are then developed to compute the total number of each column section stage.
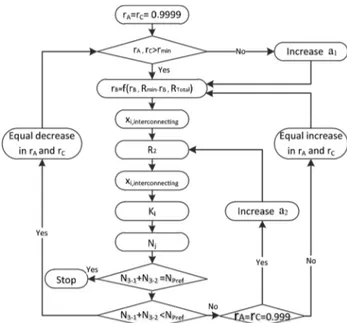
The shortcut procedure for designing DWCs is summarized inFigure 2. In the first step of this design procedure, we set maximum recovery ratio values of light product component (rA) and heavy product component (rC) in the prefractionator. Then the recovery ratio of intermediate component (rB) at a specified reflux ratio in the prefractionator can be obtained by linear interpolation combining recovery ratios at the minimum (rB,Rmin) and total reflux (rB,Rtotal). After a preliminary estimation of the compositions of interconnecting streams (xi), the obtained value of recovery ratio of intermediate component is applied to get operating conditions. Afterward, to get the accurate number of stages for each column section, the composition of the interconnecting streams should be calculated accurately by solving the operating line of the main column and the feed line equations of the prefractionator.
Finally, in order to satisfy the DWC design condition of equal number of stages of the prefractionator with those of section 3 of the main column, the recovery ratio of A and C have to be updated in both ends of the prefractionator, and these recovery ratios are limited in terms of minimum and maximum values. If the recovery ratios are outside this range, we vary the reflux ratio by modifying the values of a1or a2.
2.1. Column Operating Conditions. The minimum operating conditions arefirst defined in each column section, which are based on an initial estimation of the interconnecting stream compositions in the main column.
2.1.1. Prefractionator. To obtain the operating conditions, the recovery ratios of the light component (rA) and the heavy component (rC) in the prefractionator of the DWCs (sections S1_1 and S1_2) are specified. The minimum vapor flows into column sections S1_1 and S1_2 are obtained through the substitution of the roots θl from eq 1 into eq 2 using the recovery ratio of the intermediate components, and eq 2 is solved simultaneously for all values ofθj. The recovery ratio of the intermediate component at the minimum reflux (rB,min) is determined by the given value ofθj.
∑
α α θ − = − q z 1 i i i j F (1)∑
α α θ = = − ‐ ‐ = V V z r i i i i j i min,1 2 min,1 1 1 3 ,t (2)The liquid and vapor flow rates of two sections of the prefractionator are defined before proceeding to that of the main column. The reflux ratio of section S1_1 is determined by
eq 3. = ‐ ‐ R1 1 a R1 1 1,min (3) = − ‐ ‐ R V D 1 1 1,min min,1 1 1 (4) = + = + = ‐ ‐ ‐ L1 2 L1 1 q FF R D1 1 1 F with qF 1 (5)
Following the statement of Treybal,31 the reasonable distribution estimation of the intermediate component atfinite
reflux can be obtained by linear interpolation of rBbetween Rmin (rB,Rmin) and total reflux, Rtotal(rB,Rtotal), according to the slope of the rectifying section profile in distillation column R/(R + 1). The recovery ratio of the middle key component at total reflux can be calculated via the Fenske equation (i.e., eq 6), while the minimum number of theoretical stages of the prefractionator is calculated using the Fenske equation (i.e.,eq 7).32 α α = + − − ⎡ ⎣⎢ ⎤⎦⎥ r ( ) 1 ( ) r r N r r B C N B,Rtotal 1 B,C 1 , C C min C C min (6) α =
(
)
N log log x x x x min A,C A,D C,D C,W A,W (7)2.1.2. Main Column. Since the main column is divided into four sections, the two sections S2 and S3_1 contribute to the separation between A and B, while the amount of C that at the top of section S1_1 is assumed to go completely to the bottom of section S3_1. The separation of B and C is implemented by the remaining sections (S3_2 and S4), while the amount of A at bottom of section S1_2 is assumed to go to the top of section S3_2. That is why they are considered as two different columns in the calculation of the minimum vaporflow rate.
Before proceeding to calculate the minimum vaporflow rate, the compositions of interconnecting streams should be first estimated. These compositions are only applied to calculate the minimum operating conditions of the main column usingeqs 8−11. The liquid and vapor flows at both top and bottom sections of prefractionator are assumed in equilibrium at the top and bottom of prefractionator.
α = ∑α ‐ x y / i i i y ,L ,D ,C i i 1 1 1 ,D1 ,C (8) = + ‐ ‐ ‐ ‐ y D V [(R x ) y ] i,V i i 1 1 1 1 1 ,L ,D 1 1 1 1 1 (9) α α = ∑ ‐ y x x i V i w i i w i , , ,C , ,C 1 2 1 1 (10) = + ‐ ‐ ‐ ̅ ‐ x w L x V L y i,L 1 i w i V 1 2 , 1 2 1 2 , 1 2 1 1 (11)
2.1.2.1. Section 2. The minimum vaporflow rate in the flow of the side draw is calculated through the extended Underwood equation,eq 13, after solvingeq 12.
∑
α α θ − = − = q ix i q 1 i 0 j 2 ,V 2 1 (12)∑
α α θ = + − ‐ ‐ V i d L x i ( i i L ) j min,2 ,2 1 1 , 1 1 (13)2.1.2.2. Section 3_1. The reflux flow that is sent back to section 2 is divided into two parts: one covers the need for liquid in section 1_1, and the rest of the liquid supplies section 3_1.
= −
‐
Lmin,3 1 Lmin,2 L11
1 (14)
2.1.2.3. Section 3_2. The minimum vaporflow rate could be calculated through the extended Underwood equations in the side draw usingeqs 15and16.
∑
α α θ − = − = ‐ q ix i q 1 i L with 1 j 3 , 3 2 1 2 2 (15)∑
α α θ = − + − ‐ ‐ V i W V y i ( i i ) j min,3 2 ,4 1 ,V2 1 2 (16)2.1.2.4. Section 4. Since the liquidflow of section 4 comes from section 3_2 and section 1_2, the minimum liquid flow will be easily calculated if one knows these twoflow rates, L3‑2 and L1‑2.
= ‐ + ‐
Lmin,4 Lmin,3 2 L1 2 (17)
Once the minimum operating conditions are calculated, the selection of the operating value is then carried out. The liquid descending from the top of section 2, which represents its reflux, serves to feed all other sections of the DWCs. The optimal reflux ratio fromeq 18is normally set higher than that for the other sections of the DWC. The optimal reflux ratio coefficient, a, is usually be set between 1.2 and 1.5.31
=
R2 R2,min 2a (18)
To ensure the requirement mentioned above, theeq 19gives the value of reflux for section 2.
α α = + + + − ‐ ‐ ‐ ⎡ ⎣ ⎢ ⎢ ⎢ ⎢ ⎛ ⎝ ⎜ ⎞ ⎠ ⎟ ⎤ ⎦ ⎥ ⎥ ⎥ ⎥ R L D L S L L D a max / ( 1) / 2 2,min 2 min,3 2 1 1 2 1 2 2 2 2 (19)
Once the value of R2is determined, the values of liquid and vaporflow rates in each section will be easily calculated by the following equations: = L2 R D2 2 (20) = + V2 L2 D2 (21) = − ‐ ‐ L3 1 L2 L1 1 (22) = − ‐ ‐ V3 1 V2 V1 1 (23) = − − ‐ ‐ L3 2 L2 L1 1 S (24) = ‐ ‐ V3 2 V3 1 (25) = + − L4 L2 F S (26) = − = V4 L4 W4 V2 (27)
2.2. Column Structural Design. To get the accurate stage number of each column section, the final composition of the interconnecting streams needs to be calculated correctly. In addition to the compositions of the interconnecting streams, to determine the number of stages, the equations require the preliminary setting values of liquid and vaporflow rates in each column section. Furthermore, to get more accuracy for design parameters, the relative volatility is assumed constant throughout each section. For that, the average value of the relative volatility between top and bottom of each column section is calculated.
2.2.1. Compositions of Interconnecting Streams Determi-nation. These compositions are estimated by solving the operating line equations of the main column (i.e., eqs 28and
30) and the feed line equations of the prefractionator (i.e.,eqs 29and31) to reduce the interconnecting stream composition difference (Δx) between these two columns to the minimum possible. = + + + ‐ ‐ y R R x x R 1 1 i i L i D ,V 2 2 , , 2 1 1 1 1 2 (28) = + ‐ ‐ ‐ ‐ V y1 1 ,Vi L x1 1 ,Li D x1 ,Di 1 1 1 1 1 (29) = + ‐ ‐ y L V x W V x i,V i i 4 4 ,L 4 4 ,W 1 2 1 2 4 (30) = + ‐ ‐ ‐ ‐ L1 2xi L, V y1 2 ,Vi W x1 ,Wi 1 2 1 2 1 (31)
Combining operating and feed line equations, one would get vapor and liquid composition equations of interconnection streams at top and bottom of the prefractionator as below,
= − − ‐ ‐ ‐ y y R x R i i i L D L D ,V ,D 2 ,D 2 1 1 1 2 1 1 1 1 1 1 (32) = + − + − ‐ ‐ ‐
(
)
x y R x R ( 1) 1 i L i i L D L D , ,D 2 ,D 2 1 1 1 2 1 1 1 1 1 1 (33) = + − + − ‐ ‐ ‐(
)
(
)
y x 1 x 1 i V i V W i V W V W V W , ,W ,W 1 2 2 1 2 1 1 4 4 1 2 1 4 4 (34) = − − ‐ ‐ ‐ x x x i L i V W i V W V W V W , ,W ,W 1 2 2 1 2 1 1 4 4 1 2 1 4 4 (35)2.2.2. Total Number of Stages. Total number of stages is determined by establishing a material balance of the key component at stage N in each section. To develop the design equations, it is necessary to screen the components that are expected to be absorbed throughout the rectifying section or be stripped within stripping section.19,20Equations 36−41give the total number of stages in the prefractionator and main column, upper and lower interlinking stages, and side draw stages.
= = ≥ ‐ − + − − ‐ ‐ ‐ ‐ ‐ ‐ ‐ ‐ ‐ ‐ ‐ N a a L K V ln ln with 1 y a x K y a y x K 1 1 (( ) ( 1)) ( ) 1 1 1 1 1 1 C,1 1 1 1 C,V 1 1 C,L C,1 1(L1 1) C,F 1 1 C,V C,L C,1 1(L1 1) (36) = = ≥ ‐ − + − − ‐ ‐ ‐ ‐ ‐ ‐ ‐ ‐ ‐ ‐ ‐ ‐ ‐ ‐ ‐ ⎛ ⎝ ⎜⎛⎝⎜ ⎞⎠⎟ ⎞ ⎠ ⎟ ⎛ ⎝ ⎜ ⎞⎠⎟ N a a K V L ln ln with 1 x a x a x 1 2 ( 1) 1 2 1 2 A,1 2 1 2 1 2 y K y K A,L1 2 1 2 A,V1 2 A,1 2(V1 2) A,F 1 2 A,L1 2 A,1 2(V1 2)A,V1 2
(37)
Since the two sections S1_1 and S1_2 have the same feed stage, the following equations can be obtained:
= ‐ + ‐ − Npref N1 1 N1 2 1 α = = ≥ − + − − ‐ ⎜ ⎟ ⎜ ⎟ ⎛ ⎝ ⎜⎛ ⎝ ⎜ ⎛⎝ ⎞⎠ ⎞ ⎠ ⎟ ⎞ ⎠ ⎟ ⎛ ⎝ ⎜ ⎛⎝ ⎞⎠ ⎞ ⎠ ⎟ N a L K V ln ln with 1 x a x y a x x 2 ( 1) 2 2 2 B,2 2 L K V L K V B,D2 B,D2 22 2 B,D2 B,V1 1 2 B,D2 B,D2 22 B,D2 (38) α = − = ≥ ‐ − − + − − ‐ ‐ ‐ ‐ ‐ ‐ ‐ ‐ ‐ ‐ ‐ ⎜ ⎟ ⎜ ⎟ ⎛ ⎝ ⎜⎛⎝⎜ ⎛⎝ ⎞⎠⎞⎠⎟ ⎞ ⎠ ⎟ ⎛ ⎝ ⎞⎠ N a K V L ln ln 1 with 1 x a x x a x A 3 1 ( 1) 3 1 3 1 ,3 1 3 1 3 1 x K V L x K V L A,S 3 1 A,S A,S A,S 3 1 / 3 1 A,L 3 1 A,S A,S A,S 3 1 / 3 1 (39) α = − = ≥ ‐ − + − − ‐ ‐ ‐ ‐ ‐ ‐ ‐ ‐ ′ ‐ ‐ ‐ ⎜ ⎟ ⎜ ⎟ ⎛ ⎝ ⎜⎛⎝⎜ ⎛⎝ ⎞⎠ ⎞ ⎠ ⎟ ⎞ ⎠ ⎟ ⎛ ⎝ ⎜ ⎛⎝ ⎞⎠ ⎞ ⎠ ⎟ N a L K V ln ln 1 with 1 y a y y a y y 3 2 ( 1) 3 2 3 2 3 2 C,3 2 3 2 L K V L K V C,S 3 2 C,S 3 2 3 2 C,S C,V 3 2 C,S 3 2 C,S 3 2 C,S (40) α = − = ≥ − + − − ‐ ⎜ ⎟ ⎜ ⎟ ⎛ ⎝ ⎜⎛⎝ ⎞⎠ ⎞ ⎠ ⎟ ⎛ ⎝ ⎞⎠
(
)
(
)
N a K V L ln ln 1 with 1 x a x x a x x 4 ( 1) 4 4 B,4 4 4 K V L K V L B,W4 B,W4 44 4 B,W4 B,1 2 4 B,W4 B,W4 44 B,W4 (41)2.2.3. Adjustment of Stage Number. In this work, the column is assumed to be symmetric, that is, it has the same number of stages on both sides of the dividing wall. Since rB varies with the change of rAand rC, the recovery ratio change of both product A and C is subject to the minimum values defined by the eqs 42and43. In the case that the recovery ratios of both products are higher or lower than their maximum and minimum values, the reflux ratio is varied by modifying the values of a1or a2. = − − − − − ×
(
)
r F r r F F 1 (1 ) ((1 ) ) x r x A,min (1 ) B B C C A B,S B,S B,S (42) = − − − − ×(
)
r F r r F F 1 ((1 ) ) x r x C,min (1 ) B B A A C B,S B,S B,S (43)3. DESIGN METHOD VALIDATION
To validate the efficiency of the proposed methodology, we made a comparison between DWC processes designed via our shortcut method and those completed using rigorous simulation in Aspen HYSYS. In this work, all the systems investigated are ideal mixtures; therefore, their relative
volatilities are seldom affected by temperature, and for this reason, the values of relative volatilities could be assumed constant along the column section. The designs are based on three-component systems assuming constant values of the relative volatilities, with different ease of separation index (ESI), and a particular choice of a real case involves a DWC process from an Algerian industrial gas manufacturing plant.
3.1. Example Systems with Different ESIs. Six multi-component feed systems with different ease of separation index (ESI) arefirst applied to investigate its usability. The degree of difficulty for the separation is characterized by the ease of separation index (ESI), as defined ineq 44. According to the definition, if ESI < 1, the A/B split is harder than the B/C split; if ESI > 1, the A/B split is easier than the B/C split.
α α
=
ESI AB
BC (44)
The characterizations and feed compositions of six feed systems are summarized in Table 2. The mixtures are fed at
saturated liquid thermal condition at 2 atm, and the feedflow rate is set at 100 kmol/h. The recovery ratio of the intermediate component product is set up to 95% with a purity of 99% in the side draw.
3.2. Application to LPG. In this section, the proposed shortcut design method is applied to the liquefied petroleum gas (LPG) fractionation in an Algerian industrial gas manufacturing plant. The average molar composition of LPG feed is summarized in Table 3.33 The target of the LPG fractionation is to achieve a specified recovery ratio of propane and butane based on the standards of Algerian conventional propane gas (seeTable 4).
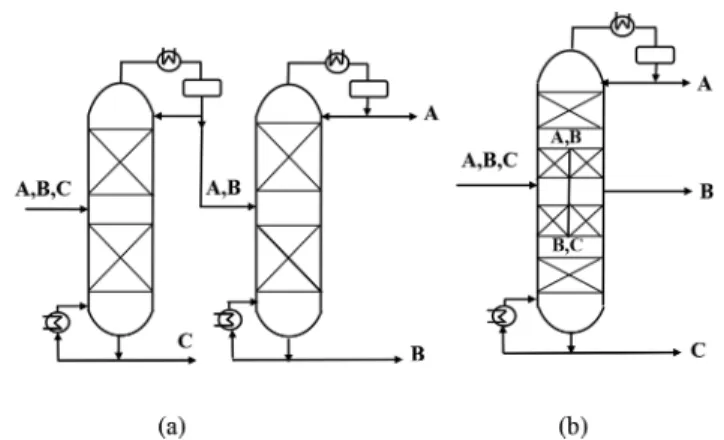
In the Algerian industrial gas manufacturing plant, the LPG is fed at boiling temperature directly to the fractionation column, where the propane product is obtained at the top while the butane product is gained at the bottom. The overhead products containing a high content of ethane are then sent to the next deethanizer column to meet the Algerian industrial speci fica-tion. In the study, the alternative DWC arrangement (Figure
3b) is proposed to replace the conventional two-column flowsheet (Figure 3a). The reliability of the shortcut method is
confirmed in the first step, and then the suitability to this industrial requirement of the DWC arrangement is tested.
The design parameters, the final product purities, and the total required reboiler and condenser duties in the industrial plant are presented inTable 5.33Later on, this data is compared
with the results obtained by the implementation of the shortcut method of DWC configuration parameters in rigorous simulation. For the separation of three-products system using the DWC flowsheet, the seven components in the feed are divided into three representative key components: ethane, propane, and butane.
Table 2. Ease Separation Index and Feed Compositions of Six Cases Studied
feed mixtures ESIs
F1 n-pentane/hexane/heptane 1.04 F2 benzene/toluene/m-xylene 1.01 F3 ethane/propane/isobutane 1.79 F4 isopentane/hexane/heptane 1.26 F5 pentane/hexane/octane 0.46 F6 ethanol/propanol/butanol 0.91 ZA/ZB/ZC 0.33/0.33/0.34
Table 3. Average Molar Composition of LPG Feed33 component composition (mol %)
methane 0.33 ethane 1.38 propane 59.79 isobutane 12.87 n-butane 25.41 isopentane 0.19 n-pentane 0.03
Table 4. Standard Propane Gas in Algeria
component content (mol %)
C2 in C3 4.80
C4 in C3 2.50
C3 in C4 25.00
C3 in C2 12.00
C5 in C3 2.00
Figure 3. (a) Conventional two-column flowsheet and (b) DWC arrangement.
Table 5. Design Parameters, Final Product Qualities, and Total Required Reboiler and Condenser Duties of the Industrial LPG Plant33 parameters fractionation column deethanizer NT 55 25 NF 23 17 F (kmol/h) 2101.0 -Lr(kmol/h) 3110.0 294.5
composition of bottom products (% mol)
C1 0.00 0.01 C2 0.00 0.98 C3 04.22 98.07 i-C4 32.37 0.84 n-C4 63.02 0.10 i-C5 0.20 0.00 n-C5 0.19 0.00 QC,total(kW) 13883.33 QB,total(kW) 21133.33 total duty (kW) 34716.66
4. RESULTS AND DISCUSSION
4.1. Six Feed Systems with Different ESIs. Using the proposed shortcut design procedure, the operating conditions
involving total number of stages in each section, productflow rates, interlinking stages, and side product draw stage are determined. The processes are then simulated rigorously through Aspen HYSYS simulator. The procedure is carried out for the six different feed systems with different ESIs as summarized inTable 2.
The operating and design parameters of DWC separation for six cases using the proposed shortcut procedure are summarized in Table 6. Assuming 98% of product recovery
ratio at the top, 99% of that in the side stream, and 96% of that at the bottom, the obtained product purities of six cases are shown in Table 7. Table 8 presents the compositions of the interconnecting streams.
Compared to the case with the value of ESI close to 1, the case feed F3 with the ESI > 1 and the case feed F5 with the ESI < 1 require fewer total number of stages and lower reflux ratio values using the proposed shortcut method in this study. In addition, it can be noted that the number of stages in the prefractionator for the case feed F5 is less important compared to other investigated feed streams, as in this case the separation of A/B split is harder than B/C split. For the case feed F3 with the ESI > 1, the number of stages in the rectifying section is very small and a higher product purity of component A could be obtained in the distillate.
In this section, to make a comparison between the results obtained by the implementation of our method and other Table 6. Design Parameters Obtained by the Proposed
Shortcut Method Feed specifications F1 F2 F3 F4 F5 F6 N1‑1 10 10 8 8 7 12 N1‑2 16 17 17 17 13 16 N1 25 26 24 24 19 27 N2 5 6 2 4 7 9 N3‑1 12 14 8 11 13 14 N3‑2 13 12 16 13 6 13 N4 8 8 5 8 4 8 NTotal 38 41 31 36 30 44 R2 3.66 4.05 2.39 3.45 2.2 4.11 L1‑1 26.57 30.83 4.49 20 10.52 37.46 D2 33.40 33.39 33.15 33.31 33.52 33.51 S 31.67 31.67 31.67 31.67 31.67 31.67 W4 34.93 34.94 35.19 35.02 34.81 34.83
Table 7. Product Composition for Six Cases feed
purities F1 F2 F3 F4 F5 F6
xA,D 0.9851 0.9854 0.9945 0.9884 0.9809 0.9814 xB,S 0.9900 0.9900 0.9900 0.9900 0.9900 0.9900 xC,W 0.9670 0.9667 0.9583 0.9639 0.9710 0.9705
Table 8. Compositions of Interconnecting Stream Obtained by Proposed Shortcut Method
feed xi,L1‑1 xi,V1‑1 xi,L1‑2 xi,V1‑2 F1 0.6485 0.7208 0.0024 0.0029 0.3481 0.2765 0.5437 0.6586 0.0034 0.0027 0.4539 0.3385 F2 0.6582 0.7231 0.0022 0.0027 0.3385 0.2743 0.5416 0.6469 0.0033 0.0026 0.4562 0.3504 F3 0.7191 0.7797 0.0013 0.0017 0.2786 0.2185 0.5513 0.6729 0.0023 0.0018 0.4474 0.3254 F4 0.7205 0.7806 0.0009 0.0012 0.2779 0.2181 0.5516 0.6732 0.0016 0.0013 0.4475 0.3256 F5 0.5547 0.6881 0.0022 0.0029 0.4424 0.3099 0.548 0.7167 0.0029 0.002 0.4498 0.2804 F6 0.5806 0.6589 0.0018 0.0021 0.4171 0.3392 0.5323 0.6344 0.0023 0.0019 0.4659 0.3635
Table 9. Design Parameters Obtained by Three Other Shortcut Methods Method specifications Triantafyllou and Smith16 Rami ́rez-Corona et al.18 Hosanna et al.,20 N1‑1 11 6 29 N‑ 11 11 28 N1 21 17 56 N2 7 6 6 N3‑1 11 11 11 N3‑2 10 13 46 N4 11 7 11 Ntotal 39 37 72 R2 3.17 2.8 2.7 L1‑1 24.44 27.01 24.6 D2 33.39 33.39 33.39 S 31.67 31.67 31.67 W4 34.94 34.94 35.94
Table 10. Compositions of Interconnecting Streams Obtained by the Three Shortcut Methods and Our Proposed Method
method xi,L1‑1 xi,V1‑1 xi,L1‑2 xi,V1‑2 Triantafyllou and Smith16 0.5822 0.7015 0.0024 0.0035
0.4122 0.2956 0.5155 0.6089 0.0056 0.0029 0.4821 0.3875 Rami ́rez-Corona et al.18 0.6059 0.7056 0.0002 0.0001
0.3940 0.2943 0.5927 0.7466 0.0001 0.0001 0.4071 0.2533 Hosanna et al.20 0.6180 0.7173 0.0001 0.0001
0.3819 0.2826 0.5932 0.7515 0.0001 0.0001 0.4067 0.2484 proposed method in this study 0.6485 0.7208 0.0024 0.0029 0.3481 0.2765 0.5437 0.6586 0.0034 0.0027 0.4539 0.3385
Table 11. Product Purities Obtained in Six Cases by Rigorous Simulation feed purities F1 F2 F3 F4 F5 F6 xA,D 0.9885 0.9901 0.9881 0.9839 0.9763 0.9861 xB,S 0.9834 0.9891 0.9814 0.9756 0.9768 0.9862 xC,W 0.9598 0.9637 0.9534 0.9537 0.9641 0.9624
shortcut ones, three other proposed shortcut methods16,18−20 are also tested in this same condition and the same way. The design parameters obtained by these three shortcut methods for the system n-pentane−hexane−heptane representing the feed F1 (see Table 2) are summarized in Table 9. Meanwhile, compositions of the interconnecting streams are summarized in
Table 10. These parameters could serve as initial values for the rigorous simulation.
As it can be seen fromTable 9, under the same specification of product purities, the proposed shortcut method in this study leads to fewer total number of stages and lower reflux ratio than those of other methods.16,18,20
Since the design of DWC columns presented above is based on the proposed shortcut method, to check whether the process could achieve the desiredfinal product purities given in
Table 7, the obtained results are subjected to a validation by rigorous simulations in Aspen HYSYS simulator. Table 11
shows the rigorous simulation results of product purities in six
cases using the design parameters obtained from the proposed shortcut method.
It noticed that the rigorous simulation leads to approximately the same product specifications imposed in the applied shortcut method. It is not very remarkable on the effects of the different ease of separation indexes (ESIs) to different feeds; it may due to the Ki values in both ends of each section of the DWC having been taken into account. And it confirms that the proposed method works well for systems with different ESIs.
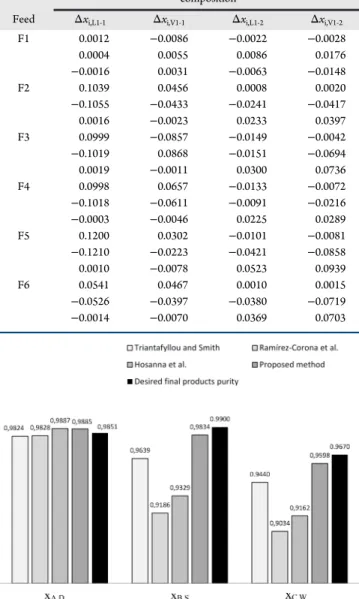
Moreover, the comparison between the compositions of interlinking streams obtained by the shortcut method (Table 12) and those deduced from rigorous simulation confirms the importance of interlinking streams. The mismatching between the interlinking stream compositions of the prefractionator and those of the main column is the main reason for the reduction of thermodynamic efficiency. The target of decreasing average difference compositions of interconnecting streams is achieved by attempting to achieve accuracy of the compositions of interconnecting streams, total number of stages, and minimal operatingflows rates in the procedure proposed in this study. To reduce the maximum difference, Δx, between the interconnecting stream compositions, the calculation procedure of interconnecting stream compositions is employed in this Table 12. Composition Difference between Interlinking
Steams Obtained from the Proposed Shortcut Method and Rigorous Simulation
composition
Feed Δxi,L1‑1 Δxi,V1‑1 Δxi,L1‑2 Δxi,V1‑2 F1 0.0012 −0.0086 −0.0022 −0.0028 0.0004 0.0055 0.0086 0.0176 −0.0016 0.0031 −0.0063 −0.0148 F2 0.1039 0.0456 0.0008 0.0020 −0.1055 −0.0433 −0.0241 −0.0417 0.0016 −0.0023 0.0233 0.0397 F3 0.0999 −0.0857 −0.0149 −0.0042 −0.1019 0.0868 −0.0151 −0.0694 0.0019 −0.0011 0.0300 0.0736 F4 0.0998 0.0657 −0.0133 −0.0072 −0.1018 −0.0611 −0.0091 −0.0216 −0.0003 −0.0046 0.0225 0.0289 F5 0.1200 0.0302 −0.0101 −0.0081 −0.1210 −0.0223 −0.0421 −0.0858 0.0010 −0.0078 0.0523 0.0939 F6 0.0541 0.0467 0.0010 0.0015 −0.0526 −0.0397 −0.0380 −0.0719 −0.0014 −0.0070 0.0369 0.0703
Figure 4. Comparison of the product purities with the operational parameters using the shortcut method in this study and in the open literature.
Table 13. Compositions Difference between Interconnection Streams Computed by the Shortcut Method in This Study and in the Open Literature
composition Triantafyllou and Smith16 Rami ́rez-Corona et al.18 Hosanna et al.20 proposed method L1‑1 ΔxA 0.2572 0.1864 0.0627 0.0012 ΔxB 0.2566 0.1835 0.0618 0.0004 ΔxC 0.0006 0.0028 0.0009 0.0016 V1‑1 ΔxA 0.1098 0.0777 0.029 0.0086 ΔxB 0.1001 0.0723 0.0591 0.0055 ΔxC 0.0096 0.0054 0.0222 0.0031 L1‑2 ΔxA 0.0056 0.0039 0.0024 0.0022 ΔxB 0.0818 0.0302 0.0504 0.0086 ΔxC 0.0875 0.0262 0.0481 0.0063 V1‑2 ΔxA 0.0026 0.0033 0.0029 0.0028 ΔxB 0.1510 0.054 0.0913 0.0176 ΔxC 0.1536 0.0507 0.0884 0.0148 Table 14. Design Parameters Obtained by the Proposed Shortcut Method parameters values N1‑1 13 N1‑2 10 N1 22 N2 3 N3‑1 4 N3‑2 18 N4 15 NTotal 40 R2 137.4 L1‑1 926.53 D2 31 S 1243.66 W4 826.34
shortcut method by solving simultaneously the operating line of the main column and the feed line equations of the prefractionator. It turns out that this approach could lead to a decent result after the rigorous simulation, and it alleviates the
bothersome and tedious iterations encountered in composition matching with the interlinking trays in a rigorous simulation.
Figure 4summarizes the product purities in the separation of system pentane−hexane−heptane obtained by rigorous simu-lation with the parameters calculated in the proposed shortcut method and other methods proposed in open literature. This comparison confirmed that the proposed method in this study provides better optimal results compared to three other methods.
The comparisons of the interconnection stream composi-tions computed by the shortcut method in this study and in the open literature are listed in Table 13. The imprecise determination of interconnection stream composition and minimum operating flow rates results in inefficiency in the Hosanna et al.19,20 method. Even though a little composition difference of interconnection streams using the Rami ́rez-Corona18method as compared to our method can be observed, the purities offinal products are far from the requirements. The fundamental cause of such difference lies in a precision calculation of minimal operating flow rates for different sections of the DWCs in this study.
4.2. LPG Fractionation Process Using DWCs. The design parameters achieved by applying the shortcut method are summarized inTable 14. These design parameters are then subjected to a validation by rigorous simulations through the Aspen HYSYS. The purities of final products are given first, followed by the required composition of the interconnecting streams and reboiler and condenser duties. Theflow-chart for the complete rigorous simulations is shown inFigure 5.
It could be noted that in LPG fractionation, there is only a small amount of ethane in the feed. The target product is not ethane that is obtained from the top of the DWC; for this reason a large amount of liquid from the condenser is required
Figure 5.Configuration of the complete LPG fractionation process: (a) conventional two-column; (b) DWCs.
Table 15. Comparison between the Shortcut Method and the Rigorous Simulation for LPG Fractionation Using DWC Alternative
parameters shortcut method rigorous simulation
D, xA,D 0.8600 0.8868 S, xB,S 0.9807 0.9801 W, xC,W 0.9539 0.9737 L1−1 xA 0.0705 0.1390 xB 0.9226 0.8576 xC 0.0069 0.0034 V1−1 xA 0.0756 0.1147 xB 0.9176 0.8761 xC 0.0068 0.0092 L1−2 xA 0.0027 0.0008 xB 0.6021 0.5918 xC 0.3952 0.4074 V1−2 xA 0.0032 0.0005 xB 0.7043 0.7249 xC 0.2925 0.2746 QC(kW) 13833.33 QB(kW) 13500.00 total duty (kW) 27333.33
to be returned to top of the column as reflux, and more important products are recovered in intermediate and bottom parts of the DWC. This is why the value of the reflux ratio is higher than the average value.
From Table 15, it could be observed that the result of product purities is in excellent agreement with those imposed by the proposed shortcut method. It also proved that the shortcut method works well as an initialization method to provide general design estimation, and it could be effectively applied to setting up rigorous simulation. The comparison between the conventional and DWC configuration is made to test the suitability of the DWC alternative for this industrial plant. FromTables 15and5, it can be concluded that the DWC configuration in the industrial plant can save energy by 36.1% in total reboiler duty and 0.36% in total required condenser duty as compared to that of conventional ones.
From the comparison of results from Tables 5 and15, the total energy consumption decreases from 34716.66 kW in the conventional configuration to 27333.33 kW in the DWC alternative. The implementation of the DWC arrangement demonstrates 21.27% energy savings. Moreover, a significant reduction of capital cost involving installation space, reboilers, condensers, reflux pumps, and heat exchangers could be achieved.
5. CONCLUSIONS
The methodology proposed in this work has been proven to be effective and efficient in designing dividing wall columns (DWCs). To eliminate the difficulties of the efficient design of DWCs, some improvement has been made in the proposed shortcut procedure. One of the achievements is a new calculation method of composition difference of the inter-connecting streams between the prefractionator and the main column. The novel method alleviates the bothersome and tedious iterations encountered in composition matching of interlinking stages in rigorous simulation, and it indicates that this method could provide much more accuracy of average composition of the interconnecting streams between prefrac-tionator and main column than those of other methods.
In practice, this method has been applied to a case of LPG separation using DWCs with three targeted products in an industrial liquefied petroleum gas plant. The proposed shortcut method is presented for the separation of ternary ideal mixtures assuming a constant relative volatility with different separation indexes (ESIs). This method is not applicable to nonideal azeotropic systems because their relative volatilities could not be kept constant along the column sections. The applications and high efficiency of the shortcut method in this study lay a theoretical foundation in designing separation processes involving dividing wall columns.
■
ACKNOWLEDGMENTSWe acknowledge thefinancial support provided by Grant PNE (Programme National Exceptionnel, Ministère de l’Enseigne-ment Supérieur et de la Recherche Scientifique Algérie), the National Natural Science Foundation of China (No. 21606026), the Fundamental Research Funds for the Central Universities of China (No.106112017CDJQJ228809), and the Natural Science Foundation of Chongqing, China (No. cstc2016jcyjA0474).
■
NOMENCLATUREαij = relative volatility of component i with respect to component j
D = top productflow rate (kmol/h) Dk = top productflow rate of section k F = feed flow rate (kmol/h)
Ki,k= equilibrium constant of component i in section k Lk = liquidflow of section k
Lmin,k = minimum liquidflow rate of section k LPG = liquefied petroleum gas
NF = feed stage
Nk= number of trays of section k
Nmin,k= minimum number of trays of section k NTotal= total number of trays
NTotal,pre= number of stages in the prefractionator NTotal,side= number of stages in the side section θ = root of Underwood’s equation
QB= reboiler heat duty (kW) QC= condenser heat duty (kW) qk= feed thermal condition of section k
ri,t= recovery of the component i in the overhead product ri,j= recovery of the component i in stream j
Rk= reflux ratio of section k
Rk,min= minimum reflux ratio of section k S =flow rate in the side draw (kmol/h) Vk = vaporflow of section k
Vmin,k= minimum vaporflow of section k W = bottom productflow rate (kmol/h) Wk= bottom product flow rate of section k
xij= liquid mole fraction of component i in stream j yij= vapor mole fraction of component i in stream j Zi= mole fraction of component i in feedflow
■
REFERENCES(1) Zhu, Z. Y.; Li, X.; Cao, Y. J.; Liu, X. Z.; Wang, Y. L. Design and Control of a Middle Vessel Batch Distillation Process for Separating the Methyl Formate/Methanol/Water Ternary System. Ind. Eng. Chem. Res. 2016, 55, 2760−2768.
(2) Shen, W. F.; Benyounes, H.; Gerbaud, V. Extension of thermodynamic insights on batch extractive distillation to continuous operation, 1. Azeotropic mixtures with a heavy entrainer. Ind. Eng. Chem. Res. 2013, 52, 4606−4622.
(3) Shen, W. F.; Gerbaud, V. Extension of thermodynamic insights on batch extractive distillation to continuous operation, 2. Azeotropic mixtures with a light entrainer. Ind. Eng. Chem. Res. 2013, 52, 4623− 4637.
(4) Dejanović, I.; Matijasevic, Lj.; Olujic, Z. Dividing wall column application to platformate splittera case study. 20th European Symposium on Computer Aided Process Engineering; Elsevier: Amsterdam, 2010; pp 655−660.
(5) Dejanović, I.; Matijašević, Lj.; Olujić, Ž. Dividing wall column- a breakthrough towards sustainable distilling. Chem. Eng. Process. 2010, 49, 559−580.
(6) Dejanović, I.; Matijašević, Lj.; Halvorsen, I. J.; Skogestad, S.; Jansen, H.; Kaibel, B.; Olujić, Ž. Designing four-product dividing wall columns for separation of a multicomponent aromatics mixture. Chem. Eng. Res. Des. 2011, 89, 1155−1167.
(7) Duc Long, N. V.; Lee, M. Reduce costs and energy consumption of deethanizing and depropanizing fractionation steps in NGL recovery process. Comput.-Aided Chem. Eng. 2011, 29, 1658−1662.
(8) Yildirim, O.; Kiss, A. A.; Kenig, E. Y. Dividing wall columns in chemical process industry: A review on current activities. Sep. Purif. Technol. 2011, 80, 403−417.
(9) Long, H.; Clark, J.; Benyounes, H.; Shen, W. F.; Dong, L. C.; Wei, S. A. Novel approach for optimal design and economic evaluation of dividing-wall columns. Chem. Eng. Technol. 2016, 39 (6), 1077− 1086.
(10) Olujic, Z.; Kaible, B.; Janson, H.; Reitfort, T.; Zich, E.; Frey, G. Distillation column internals/ configuration for process intensification. Chem. Biochem. Eng. 2003, 301−309.
(11) Gómez-Castro, F. I.; Rodríguez-Ángeles, M. A.; Segovia-Hernández, J. G.; Gutiérrez-Antonio, C.; Briones-Ramírez, A. Optimal Designs of Multiple Dividing Wall Columns. Chem. Eng. Technol. 2011, 34, 2051−2058.
(12) Barroso-Muñoz, F. O.; Hernández, S.; Hernández-Escoto, H.; Segovia-Hernández, J. G.; Rico-Ramírez, V.; Chavez, R. H. Experimental study on pressure drops in a dividing wall distillation column. Chem. Eng. Process. 2010, 49, 177−182.
(13) Premkumar, R.; Rangaiah, G. P. Retrofitting conventional column systems to dividing-wall columns. Chem. Eng. Res. Des. 2009, 87, 47−60.
(14) Kiss, A. A.; Ignat, R. M.; Flores Landaeta, S. J.; de Haan, A. B. Intensified process for aromatics separation powered by Kaibel and dividing-wall columns. Chem. Eng. Process. 2013, 67, 39−48.
(15) Ruiz-Marín, L. E.; Ramírez-Corona, N.; Castro-Agüero, A.; Jiménez-Gutiérrez, A. Short-cut design of fully thermally coupled distillation systems with post-fractionator. Ind. Eng. Chem. Res. 2011, 50, 6287−6296.
(16) Triantafyllou, C.; Smith, R. The design and optimization of fully thermally coupled distillation columns. Chem. Eng. Res. Des. 1992, 70, 118−132.
(17) King, C. J. Separation Processes, 2nd ed.; McGraw-Hill: New York, 1980.
(18) Ramirez-Corona, N.; Jimenez-Gutierrez, A.; Castro-Aguero, A.; Rico-Ramırez, V. Optimum design of Petluk and divided-wall distillation systems using a shortcut model. Chem. Eng. Res. Des. 2010, 88, 1405−1418.
(19) Uwitonze, H.; Han, S.; Kim, S. K.; Hwang, K. S. Structural design of fully thermally coupled distillation column using approximate group methods. Chem. Eng. Process. 2014, 85, 155.
(20) Uwitonze, H.; Han, S.; Hwang, K. S. New design method for fully thermally coupled distillation column using group and approximate methods. Ind. Eng. Chem. Res. 2014, 53, 11979−11988.
(21) Benyounes, H.; Benyahia, K.; Shen, W.; Gerbaud, V.; Dong, L.; Wei, S. Novel procedure for assessment of feasible design parameters of dividing-wall columns: Application to non-azeotropic mixture. Ind. Eng. Chem. Res. 2015, 54, 5307−5317.
(22) Chu, K. T.; Cadoret, L.; Yu, C. C.; Ward, J. D. A new shortcut design method and economic analysis of divided wall columns. Ind. Eng. Chem. Res. 2011, 50 (15), 9221−9235.
(23) Nguyen, T. D. Conceptual design, simulation and experimental validation of dividing wall columns: Application non-reactive and reactive mixture. Ph.D. Thesis, Institut national polytechnique de Toulouse, Toulouse, France, 2015.
(24) Benyahia, K. Etude de faisabilité de séparation des mélanges non ideaux dans des colonnes thermiquement couplées. Ph.D. Thesis, Université des sciences et de technologie d’Oran, Oran, Algérie, 2016. (25) Amminudin, K. A.; Smith, R.; Thong, D. Y. C.; Towler, G. P. Design and optimization of fully thermally coupled distillation columns Part 1: Preliminary design and optimization methodology. Chem. Eng. Res. Des. 2001, 79, 701−715.
(26) Kim, Y. H. Structural design and operation of a fully thermally coupled distillation column. Chem. Eng. J. 2002, 85 (2), 289−301.
(27) Halvorsen, I. J.; Skogestad, S. Minimum energy consumption in multicomponent distillation. 2. Three-product Petlyuk arrangements. Ind. Eng. Chem. Res. 2003, 42 (3), 605−615.
(28) Halvorsen, I. J.; Skogestad, S. Energy efficient distillation. J. Nat. Gas Sci. Eng. 2011, 3 (4), 571−580.
(29) Sotudeh, N.; Hashemi Shahraki, B. H. A method for the design of divided wall columns. Chem. Eng. Technol. 2007, 30 (9), 1284− 1291.
(30) Sotudeh, N.; Shahraki, B. H. Extension of a method for the design of divided wall columns. Chem. Eng. Technol. 2008, 31 (1), 83− 86.
(31) Treybal, R. E. Mass Transfer Operations, 3rd. ed.; McGraw-Hill, 1980.
(32) Fenske, M. R. Fractionation of Straight-Run Pennsylvania Gasoline. Ind. Eng. Chem. 1932, 24, 482.
(33) Seihoub, F.; Benettayeb, A.; Kessas, R.; Bounach, S. Apport de l’application contrôle avancé du procédé (APC) dans l’optimization de l’énergie et des paramètres opératoires au complexe GP1/Z. Master Thesis, Algerian University of sciences and technologies, 2013.