To cite this version : Nguyen, Anh Son and Musiani, Marco and
Orazem, Mark E. and Pébère, Nadine and Tribollet, Bernard and
Vivier, Vincent
Impedance analysis of the distributed resistivity of
coatings in dry and wet conditions
. (2015) Electrochimica Acta, vol.
179. pp. 452-459. ISSN 0013-4686
To link to this article : doi:
10.1016/j.electacta.2015.02.109
URL : http://dx.doi.org/10.1016/j.electacta.2015.02.109
O
pen
A
rchive
T
OULOUSE
A
rchive
O
uverte (
OATAO
)
OATAO is an open access repository that collects the work of Toulouse researchers and
makes it freely available over the web where possible.
This is an author-deposited version published in :
http://oatao.univ-toulouse.fr/
Eprints ID : 14432
Any correspondance concerning this service should be sent to the repository
administrator:
[email protected]
Impedance
analysis
of
the
distributed
resistivity
of
coatings
in
dry
and
wet
conditions
Anh
Son
Nguyen
a,
Marco
Musiani
b,
Mark
E.
Orazem
c,
Nadine
Pébère
a,*
,
Bernard
Tribollet
d,
Vincent
Vivier
daUniversitédeToulouse,CIRIMAT,UPS/INPT/CNRS,ENSIACET,31030Toulousecedex4,France bIstitutoperl'EnergeticaeleInterfasi,CNR,CorsoStatiUniti4,35127Padova,Italy cDepartmentofChemicalEngineering,UniversityofFlorida,Gainesville,Florida32611,USA dLISECNRS,UniversitéPierreetMarieCurie,75252,Pariscedex05,France
Keywords: aluminiumalloy corrosionprotection constantphaseelement(CPE) Youngimpedancepermittivity wateruptake
ABSTRACT
Acommercialcoating(epoxy-polyaminoamidewaterbornepaint)depositedona2024aluminiumalloy wascharacterizedbyimpedancemeasurements,firstindryconditionsandthenasafunctionofthe immersiontimeinNaClsolutions(wetconditions).Thebehaviourofthedrycoatingwasclosetothatof anidealcapacitorandcouldbeaccuratelymodelledwiththepower-lawmodelcorresponding toa constantphaseelement(CPE)behaviour.UponimmersioninNaClsolutions,thebehaviourofthewet coatingbecameprogressivelylessideal,i.e.fartherfromacapacitivebehaviour.Thisresultprovided supporttothehypothesisthataninhomogeneousuptakeoftheelectrolytesolutionwasthecauseofthe oftenobservednon-idealresponsesofwetcoatings.TheexperimentalEISdatarecordedforimmersion timesupto504hourswerecomparedwithmodelsassumingeitherapower-laworanexponential variationofthecoatingresistivityalongitsthickness,respectivelyimplyingaphaseangleindependentof frequencyorslightlydependentonit.
1.Introduction
Intworecentpapers[1,2]ourgrouphasproposedthattheCPE behaviourobservedintheimpedanceofmetal/coating/electrolyte systemswastheresultofpower-lawdependencesofthecoating resistivity(
r
)andpermittivity(e
)alongtheirthickness.Inturn,theresistivity and permittivity variations were attributed to an inhomogeneousuptake ofelectrolytic solutionintothecoating, stronger in proximity of the coating/electrolyte interface and progressively weakeralong the coatingthickness asthe metal/ coatinginterfacewasapproached.Accordingly,localresistivityand permittivitywerecalculatedasafunctionofthelocalelectrolyte volumefraction,usingeffective-mediumformulascorresponding toparallelcombinationsofcoatingmaterialandelectrolyte.The proposedmodel,henceforthcalled“power-lawmodel”,tookinto accountboththroughpores,directlyconnectingthemetal/coating and coating/electrolyte interfaces via low-resistivity paths, and pores less deepthan thecoating thickness.In relatedprevious work [3,4], it had been shown that the variation of the local
permittivity,byafactorof10to100atmost,hadanegligibleeffect, andsotheCPEbehaviourcouldbeentirelyascribedtoapower-law resistivity profile. The power-law model was used to analyse experimentaldataobtainedwithhybridsol–gelcoatingsdeposited ontoa2024aluminiumalloyandexposedtoelectrolyticsolutions
[1].Itwasshownthataninaccurateknowledgeoftheresistivityof thecoatingmaterial
rc
didnotaffectthequalityoftheagreement between model and experimental data, nor the values of the regressedparameters,aslongasrc
waslarge[2].Instead,thelack ofanaccurateknowledgeoftheresistivityoftheelectrolyte(rw
) within the coating pores, which could not be assumed to be identicaltothatofthebulkelectrolyte,preventedthecalculation ofaccuratewateruptakevaluesfromtheresistivityprofiles[2].Astrongimplicitassumptionunderlyingtheuseofthe power-law model, previously developed [3,4] and applied tofilms of variouschemicalnatures[5,6],intheanalysisoftheimpedanceof anti-corrosion coatings was that the non-ideally capacitive behaviourwastheresultoftheuptakeoftheelectrolyticsolution, not of a pre-existing variation of resistivity along the film thickness. Heterogeneities in the pristine coating morphology, e.g.somenano-scaleporosity,werenotexcluded.However,aslong asthecoatingwasnotexposedtoasolution,theair-filledpores hadnoeffectontheconductivity.Onlytheingressofanelectrolytic *Correspondingauthor.Tel.:+33534323423;fax:+33534323499.
E-mailaddress:[email protected](N.Pébère).
solutioncouldproduceconductivedomainsandrevealastructural inhomogeneity, as well as induce the formation of additional defectsortheincreaseoftheirsize.Theprimaryaimofthiswork hasbeentestingthishypothesisbymeasuringtheimpedanceof thesamecoatingunderdryandwetconditions,i.e.inthemetal/ coating/metal configuration, and then in the commonly used metal/coating/electrolyteconfiguration,thelatter forincreasing immersiontimes.Thecoatingchosentoperformtheexperiments wasatwo-componentwater-basedanticorrosiveprimer contain-ingseveralpigments,knowntoprovideaneffectiveanti-corrosion protection to the 2024 aluminium alloy [7]. The dry coating properties (
e
c andrc
) were first determined by impedancespectroscopy. Then, the impedance evolution upon immersion ofcoatedsamplesin either0.5Mor 0.05MNaClsolutions was followed.
Thereisnoaprioriphysicalreasonwhytheelectrolyticsolution uptakemustleadtoaresistivityprofileaccuratelydescribedbya powerlaw,which would cause a strictlyconstant phase angle. Therefore, an exponential variation of the coating permittivity alongitsthicknesswasconsideredasapossiblealternative,whena CPE did not account for the observed behaviour. Such an exponentialdependenceresultsinthewell-knownYoung imped-ance [8] characterized bya phase angle slightly dependent on frequency[9].
The present study is part of a wider program aimed at developing and characterizing chromate-free coatings for 2024aluminiumalloy. Studiesonthesame epoxy-polyaminoa-midewaterbornepaint,withoutchromates,areinprogressand investigations on coatings containing environmentally friendly inhibitorsareplanned.
2.Experimental
The coating samplesused and theimpedance measurement protocolarepresentedinthissection.
2.1.Thecoatingsamples
Thecoatingwasatwo-componentwater-basedpaintusedas an anticorrosive primer. The base was a polyaminoamide (Versamid1 type) andthe hardenerwasa bisphenolA epoxy polymer. The coatings were manufactured by Mapaero SAS. Differentpigmentswereaddedtotheorganicmatrix:titanium oxide (12wt.%), talc (11wt.%), silica (1wt.%) and strontium chromate(16wt.%).Theratioofthepigmentvolume concentra-tion(PVC)tocriticalpigmentvolumeconcentration(CPVC)was equalto0.61.The CPVCis thepigmentconcentrationatwhich thereisjustenoughbinderinthedrycoatingtocompletelyfillall thevoidsbetweenthepigmentparticles[10,11].ThePVCtoCPVC
ratioisanimportantparameterwhichcontrolsthefilmbarrier properties.
Thecoatingsweredepositedontoa2024T3aluminiumalloy (henceforth called “AA2024”) currently used in the aerospace industry. The chemical composition in weight percent of the alloywas:Cu:4.90; Mg:1.31;Mn:0.56;Si:0.08;Fe:0.26;Zn: 0.10; Ti: 0.01 and Al to balance. The specimens consisted of 125mm80mm1.6mmplatesmachinedfromarolledplate. Before painting, the samples were degreased at 60 C (pH=9) for15min,rinsedtwicewithdistilledwater,thenetchedin an acid bath at 52 C for 10min, and rinsed again with distilled water.Theliquidpaintswereappliedbyairsprayingandcured at roomtemperature. Thecoatings were 20–21
m
mthick. 2.2.ElectrochemicalimpedancemeasurementsForthedrycoating,atwo-electrodeconfigurationwasused. A cylindrical Plexiglass tube was fixed on top of the coated sample,exposingasurfaceareaof5.94cm2.Thewellwas
filled with mercury (1cm height) and the electric contact was done with a copper wire. Impedance measurements were performedwitha Solartron1255FrequencyResponse Analyzer connectedwitha1296DielectricInterface.Impedancediagrams wereobtainedatadcpotentialof0Voverafrequencyrangeof 1Hz to105Hz with 10points per decade and using a 100mV
peak-to-peak sinusoidalvoltage.
Fortheimpedancemeasurementsintheconventionalmetal/ coating/electrolyte configuration,a classical three-electrodecell was usedinwhich thecoated specimenservedastheworking electrode. A cylindrical Plexiglas tube was fixed on top of the coatedsample,exposingasurfaceareaof24cm2,and
filledwith either 0.5M or 0.05M NaCl solutions. A saturated calomel electrode and a large platinum sheet were used as reference andcounterelectrode,respectively.Theelectrochemicalcellwas opentoairandwas keptatroomtemperaturewithanaverage valueof17 Cwhichmayhaveundergonefluctuationsby!2 C. Electrochemicalimpedancemeasurementswerecarriedoutusing aBiologicVSPapparatus.Theimpedancediagramswereobtained, forexposuretimesrangingfrom2to504h,underpotentiostatic conditions,atthecorrosionpotential,overa frequencyrangeof 65kHzto1Hzwith8pointsperdecade,usinga30mV peak-to-peaksinusoidalvoltageperturbation.Toconfirmconsistencywith theKramers–Kronig relations,themeasurement modelanalysis describedbyAgarwaletal.[12–14]wasused.Alldatawerefound to satisfy the Kramers–Kronig relations. A relatively good reproducibilityof theresultswas observedinthepresentwork andtheresultsshownforasinglecoatingweretypicalofother nominally identical coatings. Nevertheless,as observed by Tait
[15],variabilityisobservedforindustrialcoatings.Theconcepts
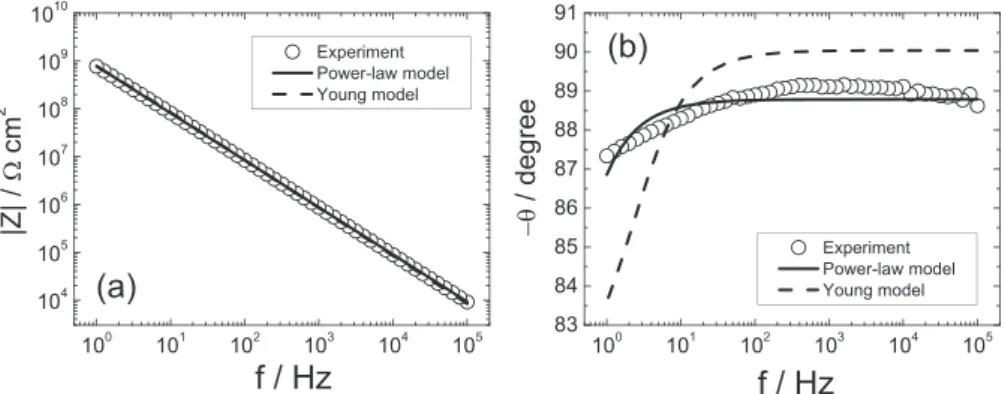
Fig.1.Theimpedancemodulus(a)andphaseangle(b)obtainedforthedrycoating(21mmthick)asfunctionsoffrequency.Theexperimentaldata(o)arecomparedwiththe regressionresults:power-lawmodel,Eq.(2)(solidline)andYoungmodel,Eq.(5)(dashedline).
developedinthepresentworkmaybeusedtofacilitatearefined statisticalanalysisofcoatings.
The impedance data analysis was performed using a non-commercial softwaredeveloped at the LISECNRS, Paris,which allowsthecomparisonoftheexperimentaldiagramswiththose calculated using a combination of passivecircuitelements and analyticalexpressions.
3.ResultsandDiscussion
3.1.Analysisoftheimpedancedataforthedrycoating
The experimental impedance diagram (Bode coordinates) obtainedforthedrycoatingis presentedinFig.1.Thediagram is characterized by a single time constant attributed to the dielectricpropertiesofthecoating,andisveryclosetoanideal capacitivebehaviour.Iftheexperimentaldataobtainedinthe1– 105Hz frequency range are analysed in terms of a parallel combination ofcoating resistance(Rc)and capacitance(Cc), the
bestfittedRcandCcvaluesare1.11010
V
cm2and1.910"10Fcm"2,andthecoatingpermittivity,calculatedas
e
c¼Ccde
0A (1)is
e
c=4.5. However,theseCcande
cvalues arenotfullyreliable.Indeed,inspectionofthephaseangle(
u
)plotshowsthatu
was lower than 90, the value expected for an ideally capacitive response, and varied slightly, between 87 and 89 in a wide frequencyrange.Therefore,todeterminethesephysicalquantities, thepower-lawmodel,knowntocorrespondtoaCPEbehaviour, wasregressedtotheimpedancedata,usingthefollowingformula[3] Zð
v
Þ¼gdr
ð1"aÞ d ðr
"1 c þjve
ce
0Þa (2)where
r
disthecoatingresistivityatthecoating/solutioninterface and gisanumericalcoefficientthathasavalueverycloseto1 whena
is close to 1 [3]. The best-fitted curve, shown as a continuous linein Fig.1, provides a good agreementbetween model and data. The expanded phase angle scale in Fig. 1b emphasizes the minor discrepancy. The regression procedure providednumericalvaluesoftheadjustableparametersa
,e
c,rc
and
r
d,reportedinTable1.Fig.1balsoshowsthatapplicationofa Young model, described in a subsequent section, yielded an inadequatefittothedata.Theresistivityprofileinthedrycoating,showninFig.2,was calculatedaccordingto[3]
r
r
d ¼r
dr
c þ 1"r
dr
c !j
g " #"1 (3) usingtherc
andr
dvaluesinTable1andthepower-lawexponentg
calculatedfromtheCPEexponenta
[3]asg
¼ 11"
a
(4)InEq.(3),
j
¼x=d
isthedimensionlesspositionalongthecoating thickness,measuredfromthemetal/coatinginterface.InFig.2,it canbeseenthat,throughoutmostofthecoatingthickness,theresistivityhasaconstantvalueof1.01013
V
cm,henceforthusedas
rc
value,i.e.asresistivityofthedrycoatingmaterial.Inathin layerofthecoating,ca.1m
mthick,nexttothecoating/mercury interface,theresistivitydecreasesapproximatelybyafactorof10. Thisdecreasecouldbeduetoavariationofthecoatingproperties initsoutermostpartortosomepenetrationof mercuryin the defects and irregularities of the coating surface which were observedbySEM.Thefittedresistivityvalueof thedrycoating,rc
=1.01013V
cm, wasmuch higherthanthat assumedin our[1,2]andotherstudies[16],
rc
=21011V
cm,andwellabovethethresholdvalueatwhichitsincorrectestimatebecomes unimpor-tant[2].Thecoatingcapacity,calculatedaccordingtoEq.(1),was 2.010"10Fcm"2, 5.3% larger than the value obtained by
modelling the coating with a Rc//Cc parallel combination, and
the dielectric constant was 4.9, slightly larger than the value obtainedbyaRc//Ccparallelcombination.Table2summarizesthe
resistance,capacityandpermittivityvaluesobtainedbyanalysing theimpedanceresponseofthedrycoatingintermsofanRc//Cc
parallelcombination orwiththepower-lawmodel.Inthelatter case,thecoatingresistanceisgivenbythereallowfrequencylimit oftheimpedance[3].Thesimilarvaluesobtainedwiththetwo methodsshowthat thedry coatingbehaves almostasan ideal capacitor.
3.2.Evolutionofthecoatingbehaviouruponimmersioninthe electrolyte
Fig.3showsthevariationofthecorrosionpotential(Ecorr)of
coatedsamplesasafunctionoftheimmersiontimeineither0.5M or0.05MNaClsolution,between2and504h.Atimmersiontimes shorterthan2h,Ecorrundergoesrapid,uncontrolledvariationsand
cannotbeaccuratelymeasuredduetothehighresistivityofthe coating,i.e.duetotheabsenceofadirectcontactbetweenmetal and electrolyte penetratedthrough the coating. After 2h, Ecorr
Table1
Best-fittedvaluesoftheadjustableparametersinEq.(2)obtainedbyregressingthe power-lawmodeltoexperimentaldataforthedrycoating.
a ec rc
(Vcm)
rd
(Vcm)
0.987 4.9 1.01013 1.11012
Fig.2.ResistivityasafunctionofdistancecalculatedaccordingtoEq.(3)forthedry coating.
Table2
Resistance,capacityandpermittivityvaluesobtainedbyanalysingtheimpedance responseofthedrycoatingintermsofRc//Ccparallelcombinationorwiththe
power-lawmodel. a Rc (Vcm2) Zf(0)a (Vcm2) Cc (Fcm"2) ec Rc//Cc 1 1.11010 – 1.910"10 4.5 Power-lawmodel 0.987 – 2.01010 2.010"10 4.9 aZ f(0)iscalculatedas:Zfð0Þ¼gdr ðg"1Þ=g d r 1=g 0 withg¼1þ2:88g"2:375 andg givenbyEq.(4).
becamemeasurable,andalmostidenticalforbothNaClsolutions. From2to20h,Ecorrprogressivelyshiftedtowardspositivevalues
(by ca. 0.1V, from its initial value). Then, after remaining essentiallyconstant from 20 to80h, Ecorrslowly declineduntil
theendofthetest,toreachasignificantlylowervalueinthemore concentratedNaClsolution.ThebehaviourshowninFig.3maybe rationalizedas follows: (i) Atthe beginning of immersion, the coatingisfreefromthroughporesthatwouldallowanimmediate contactbetween metaland electrolytic solution. (ii),thewater penetratesfastintothecoatingand a metal/solutioncontact is establishedafterca.2h,butNa+andCl–ionsdonotdiffuseatthe
samerate[17–23];therefore,theionscontentatthemetal/coating interfaceisduetostrontiumchromateincorporatedinthecoating. (iii)From2to24h,Ecorrincreasesduetotheoxidizingeffectof
chromates.(iv)Around24h,significantamountsofNa+orCl"ions
starttoreachthemetalandEcorrstopsincreasingbecausetheCl–
ionsinterferewiththepassivatingactionofchromates.(v)From 80h onwards, Ecorr undergoes a progressive decrease, more
pronouncedin themoreconcentrated NaClsolution.Theeffect of NaCl concentration on Ecorr becomes stronger at longer
immersiontimes,whenlargerquantitiesofCl–ionshavereached
themetal/coatinginterface.Independent measurementscarried outwithbareAA2024samplesshowedwell-definedstableEcorr
valuessoonafterexposure;after2himmersion,Ecorrwas"0.63V/
SCEand "0.52V/SCE in0.5Mand 0.05MNaCl,respectively, in qualitativeagreementwiththeEcorrdifferencesobservedinFig.3,
forlongimmersiontimes.TheEcorrvaluesaresignificantlymore
positiveforcoatedsamples,afterlongimmersion,thanforbare ones.
The impedance of the coated sample was measured after variousimmersiontimes,from2to504h,in0.5Mand0.05MNaCl solutions.ThecompleteBodeplotsarepresentedanddiscussedin thefollowingsection.Wefocushereontheevolutionofthephase angle, measured in the high frequency range (100Hz–65kHz), withtheimmersion time, shownin Fig.4a, for the0.5MNaCl solution.Twofactsareevident:(i)
u
isnotrigorouslyconstantbut becomesslightlysmallerfordecreasingfrequency,i.e.astrictCPE behaviour is not observed; (ii) theu
vs. frequency curves are progressivelydisplacedtowardsloweru
valuesastheimmersion time increases. Point (i) is discussed in the following section.Fig.4bpresentsaplotof
u
,measuredatanarbitraryfrequencyof 1kHz,asafunctionoftheimmersiontime(logarithmicscale).The phaseanglerelevanttothedrycoatingisindicatedonthefigure.It canbeseenthatthephaseanglemonotonicallydecreasesfrom89 to78 upon prolongingtheimmersion,withonlyminor differ-encesbetweenthe two NaClsolutions. Thedecrease ofu
withincreasingimmersiontimesprovesthattheprogressivedeparture fromaquasi-ideallycapacitiveresponseiscausedbytheingressof theelectrolyticsolutioninthecoating,inducingadistributionof itspropertiesalongitsthickness.
3.3.Analysisoftheimpedancedataforthewetcoating
Inthissection,impedanceplotsarepresentedanddiscussed, starting fromthe longerimmersion times ('48h). Taking into account that the impedance diagrams undergo progressive, monotonicvariations,asanticipatedintheprevioussection,the data obtained at immersion times of 2 to 24h, are then analysedbyadoptingamodelthatcombinesthefeaturesofthe drycoatingandthoseofthewetcoatingafterlong immersion.
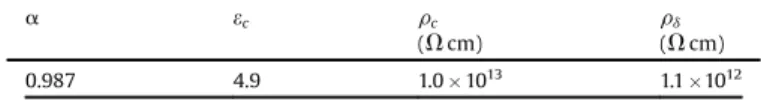
Fig. 5 presents the impedance diagrams (Bode coordinates) obtainedwiththecoatedsamplesfor immersion timesvarying from48to504h.Asmentionedabove,norealCPEbehaviouris observedandthereforetheanalysisoftheexperimentaldatawith the power-law model cannot yield a satisfactory agreement. Therefore,thedatawerecomparedwiththeYoungimpedance[8], whichmaybewritten
Z¼"
l
jve
we
0ln 1þjve
we
0r
0e"d=l 1þjve
we
0r
0 ! (5) and is knowntocorrespondtoan exponentialvariation of the coatingresistivityalongitsthickness,i.e.:Fig.3.Corrosionpotential(Ecorr)asafunctionofimmersiontimeforthecoated
AA2024samplesintwoNaClsolutions(concentrationsareindicatedonthefigure).
Fig.4. Phaseangle(highfrequencyrange)oftheimpedancefortheAA2024coated sampleina0.5MNaClsolution(a)andphaseanglevaluesmeasuredat1kHzas functionsofimmersiontimefortwoNaClsolutions(concentrationsareindicated onthefigure)(b).
r
ðxÞ¼r
0expð"x
l
Þ (6)In both Eqs. (5) and (6),
e
wandr0
respectively denote thepermittivityofthecoatingunder“wetconditions”andthecoating resistivityatthemetal/coatinginterface,whichmaybeequalor notto
e
candrc
,respectively,andtheparameterl
indicateshowsharply the resistivity changes with position (a larger
l
correspondstoasmootherresistivityprofile).
ByregressingEq.(5)totheexperimentaldata,thevaluesofthe adjustableparameters
l
,e
w,r0
wereobtained.TheyarereportedinTable3,togetherwith
r
dvaluescalculatedas:r
d¼r
0expð"d
l
Þ (7)The goodquality ofthe agreementbetweendataand model is shown by Fig. 5, where the best fitted curves are drawn as continuouslines.InspectionofTable3showsthat(i)
l
remains fairlyconstant,around1.5 10"4cm;(ii)thepermittivityofthewetcoating(
e
w)isabouttwicelargerthanthatofthedrycoatingfor 48h of immersion, and increases when the immersion is prolonged; (iii) at 48h immersion time,
r0
is close to, but somewhatlowerthanrc
,thenitprogressivelydecreases;(iv)ther
dvaluesareca.6ordersofmagnitudelowerthanther0
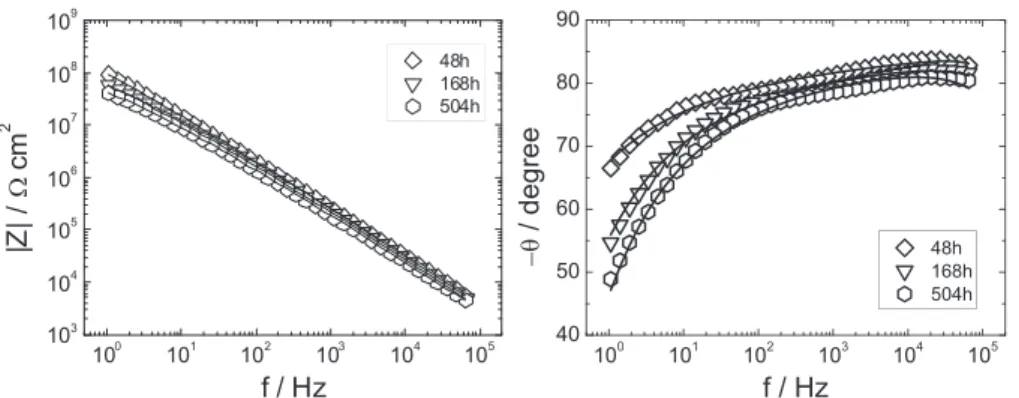
values,at eachimmersiontime.Fig. 6 presents the impedance diagrams (Bode coordinates) obtainedwiththecoatedsamples forimmersion timesvarying from2to24h.Takingintoaccounttheresistivityprofileofthedry coating (Fig. 2), as well as the fitted
r0
andr
dvalues at 48h immersion time and later (Table 3), it is hypothesizedthat for shortertimes(2–24h)thecoatingconsistsoftworegions:aninner region,nexttothemetal/coatinginterface,wheretheresistivityis thatofthedrycoating,andanouterregionwheretheresistivity varies exponentially with x. The permittivity is assumed tobe identical in both inner and outer layers, and independent of position.Thishypothesisimplieswatertobeuniformlydistributed along thecoatingthicknessandtheionstobenot.Assuminga uniformwaterdistributionisprobablyjustaroughapproximation.However, it has been shown that a moderate dependence of permittivityonpositionhasnegligibleeffectsonimpedance[3].
Two-layermodelswerealreadyconsideredbyseveralauthors
[20,24–26].Inthepresentstudy,theinner/outerlayerdistinction existsfromthepointofviewofresistivitybecauseNa+andCl–ions
aresupposedtobepresentintheouterlayerbutnotintheinner layer. Due to their penetration, the inner layer progressively disappears.Themodelforintermediateimmersiontimes(2–24h), is sketched in Fig. 7. Since the resistivity at x(d (where d represents the thickness of the inner part of the coating) is assumedidenticalto
rc
(i.e.1.01013V
cm),theimpedanceofthesystemisgivenby Z¼d
r
c ð1þjve
we
0r
cÞ"l
jve
we
0ln 1þjve
we
0r
ce"ðd"dÞ=l 1þjve
we
0r
c ! (8) wherethefirstandsecondtermsontherighthandsidearethe impedancesoftheinnerandouterlayersrespectively,connected inseries.By regressing Eq. (8) to the experimental data, the values reportedinTable4wereobtainedfortheadjustableparameters
l
,e
w,d.Thesametablealsoreportsr
dvalues,calculatedaccordingtoEq.(7).Thenumberofadjustableparametersisthesameasforthe longerimmersiontimes(Eq.(5)),sincetheresistivityatx=dneeds nottobeadjusted.Thegoodqualityoftheagreementbetweendata andmodelsketchedinFig.7isshownbyFig.6,wherethebest fittedcurvesareshownascontinuouslines.It istonotethat if Eq.(5)wereusedtoregressthe2–24himpedancedatainsteadof Eq.(8)thebestfittedvalueof
r0
wouldbemuchhigherthanrc
, whichhasnophysicalmeaning.Inspectionof Table 4 shows the following trends.(i) The
l
valuesincreasewithimmersiontimeandaresmallerthan,butof thesameorderas,thosemeasuredatimmersiontimes'48h.(ii) Thepermittivityofthecoating
e
wafter2himmersionisalreadysignificantlylargerthanthatofthedrycoating;thenitincreases slightlywithimmersiontime.(iii)Thethicknessoftheinner,more resistive part of the coating, decreases as immersion time increases,andbecomes almostcompletelynegligible at24h(it mustbepointedoutthattheexperimentaldataobtainedat24h immersion time may be equally well fitted with both short-immersionandlong-immersionmodels);(iv)
r
dvaluesundergo minorvariationswhentheimmersiontimeincreases.Thereisa substantial continuity in the variation of the parameters that appearinbothTables3and4,i.e.l
,e
wandr
d,withtheimmersiontime.
Fig.8 showsthe dependence of thecoating permittivity on immersiontime. The observedtrendsaresimilarfor both NaCl concentrations. However, in agreement with previous authors
[17,23],Fig.8showsthatpermittivityishigherin0.05Mthanin 0.5MNaCl.Thisresultmaysuggestthatwateruptakeishigherin Fig.5. ImpedanceresponseinBodeformatfortheAA2024coatedsampleobtainedafter48,168and504himmersionin0.5MNaClsolution(asindicatedonthefigure).The solidlinesarethebestfittedcurvescalculatedaccordingtoEq.(5).
Table3
Dependenceofthefittedparametersontheimmersiontimeina0.5MNaClsolution (longimmersiontimes–resistivityprofilesdescribedbytheYoungmodel).
Time (h) l (cm) ew r0 (Vcm) rda (Vcm) 48 1.4 10"4 10.6 7.1 1012 2.5 106 168 1.5 10"4 11.5 1.31012 1.3106 504 1.5 10"4 12.2 5.71011 5.7105 aCalculatedaccordingtoEq.(7).
the less concentrated NaCl solution, but may also reflect the decrease in the permittivity of NaCl solution with increasing concentration[27–29].Thewaterpartialvolume,estimatedfrom permittivity values,by using a linear combination formula [1],
wouldincreasefromca.4.5%at2htoca.9.7%at504h.Suchawater uptakewouldprobablycauseswellingofthecoating,butthiseffect wasneglected.
ThefittedparametersinTables3and4wereusedtocalculate the resistivity profiles shown in Fig. 9a. The resistivity was calculatedaccordingto 0<x(d
r
ðxÞ¼r
c d<x<dr
ðxÞ¼r
cexp "ðx"dÞl
! 8 < : (9)for immersion timesof 2 to24h, and accordingtoEq. (6),for immersiontimesof48to504h.Fig.9bshowsacomparisonofthe resistivityprofiles forthe twoNaCl concentrations,after 2and Fig.6. ImpedanceresponseinBodeformatfortheAA2024coatedsampleobtainedafter2,10and24himmersionin0.5MNaClsolution(asindicatedonthefigure).Thesolid linesarethebestfittedcurvescalculatedaccordingtoEq.(8).
Fig.7.Schematicrepresentationofthetwo-layermodel.Thecoatingisassumedto consistofaninnerlayerwithuniformresistivityr=rcandanouterlayerwithan
exponentialdependenceofresistivityonposition.
Table4
Dependenceofthefittedparametersontheimmersiontimeina0.5MNaClsolution (shortimmersiontimes: Innerregionwhere theresistivityis thatof thedry coating+outerregiondescribedbytheYoungmodel).
Time (h) l (cm) ew d (mm) rda (Vcm) 2 0.910"4 8.3 8.3 4.6106 10 1.2 10"4 9.5 3.0 4.3 106 24 1.4 10"4 10.2 0.6 3.4 106 aCalculatedaccordingtoEq.(7).
Fig.8.ThewetcoatingpermittivityasafunctionofimmersiontimeintheNaCl solutionsindicatedonthefigure.
Fig. 9.Coatingresistivity profiles inferred fromthe impedance analysis as a function ofposition: (a)withimmersion timein a0.5M NaCl solutionasa parameter;and(b)comparisonofthecoatingresistivityprofilesinthetwoNaCl concentrationsat2hand504hofimmersion.
504h. Minor differencesare observedand both sets of profiles suggestthesamephysicalphenomena:
-As described in Section 3.1, the dry coating has essentially homogeneouspropertiesalong itsthickness,withamoderate variation of resistivityonly in theoutermost, ca. 1
m
mthick layer. Therefore, its impedance is close to that of an ideal capacitor, although the power-law model accounts for the observedbehaviourmoreeffectively.-Uponimmersionintheelectrolyte,thecoatingstartstouptake waterand,moreslowly,ions.Itsresistivityintheregioncloseto thecoating/solutioninterfacesignificantlydropsinashorttime. Thesolutionuptakeoverridestheinitiallyexistingpower-law profileoftheresistivity,andcausesthedevelopmentofamuch morepronouncedexponentialprofile(sixordersofmagnitude insteadofone).Theevolutionoftheimpedanceresponse(e.g.,
Fig. 4b) reveals the increasing spatial heterogeneity of the coatingproperties.
-Alreadyafter2h,thecoatingpermittivitybecomesmuchhigher than thatof thedrycoating, suggestingthat wateruptake is extensiveoverthewholecoatingthickness,inagreementwith thefactthat,atsuchimmersiontime,Ecorrbecomesmeasurable.
However,duringthefirst24h,aninnerlayerofthecoating,as resistiveasthedrycoating,coexistswithanouterlayerwitha lower,position-dependentresistivity,becausethethicknessof thelayeraffectedbyNa+andCl–penetrationisnotaslargeasthe
wholecoatingthickness.Then,between24and48htheNa+and
Cl–ionsreachthemetal/coatinginterfaceandthethicknessof
theinnerlayerbecomeszero.Inthesameperiodoftime,the corrosionpotentialstopsincreasingandstartstomoveslowlyin thenegativedirection. Penetrationofionsisfaster whenthe coatingisexposedtothemoreconcentratedNaClsolution,as observed in Fig. 9b: for the same time, d is largerand the resistivityishigherwhenNaClconcentrationislower. -Atimmersiontimes'48h,afurtherwateruptakeisindicatedby
the minor increase in permittivity, and a more marked ion penetration by the continuous decrease of resistivity, at all positionsandnotablyatthemetal/coatinginterface.
-Evenafter504himmersion
r0
iscloseto1012V
cm2,avalueapttoensuregoodcorrosionprotection.
TheevolutionofbothimpedanceandEcorrwithimmersiontime
provides a coherentpicture of the phenomena occurringupon penetrationofwaterandionsintothecoatingmaterial.Sincethis pictureisnotthesameasthatproposedinourpreviouspapers
[1,2],somedifferencesdeserveacomment.
Thereare major differences in experimental systems,which haveastrongimpactontheresults.Thecoatingsstudiedin[1]and
[2]didnotcontainanypigment,whiletheonesdescribedinthe present paper are heavily loaded with inorganic fillers and pigments.Thesechemicalsmarkedlyenhancethecoating imped-ance. Due to the better barrier properties of the pigmented coatings, the analysis of their impedance does not require consideringafiniteresistanceof throughpores, inparallelwith thecoatingimpedance,atvariancewith[1,2].Sincethethicknesses andthecapacitiesofthedifferentcoatingsareofthesameorder, the response of thepigmented coatings is dominated by their capacityoveramuchlargerfrequencyrange,wheretheanalysisof thefrequencydependenceofthephaseangleallowsrecognizing evenaminordeparturefromastrictCPEbehaviour.This,inturn, allowstheassessmentofrelativemeritsofmodelsbasedoneither power-laworexponentialdependencesoftheresistivityonthe position along the coating thickness. However, power-law and exponential
r
(x)-xdependencesmustbeconsideredonlyassimple mathematical descriptions of physical situations which, in practice,maybemanifoldandmorecomplicated.Both Ecorr and impedance data in this work suggest that
penetrationofwaterandionsoccursondifferenttimescales.The formerprocessisfasterandaffectspermittivitymorestronglythan resistivity; the latter is slower and affects almost exclusively resistivity. Sucha decoupling of the effects of water and ionic penetrationdoesnotallowthecalculationoflocalresistivityand permittivity,using similareffectivemedium formulas,basedon thelocalpartialvolumeofsolutionwithinthecoating,asproposed in[1],andinpreviousworkbyothers[16].Inthemodelproposed in[1],theresistivityprofilewastheresultofavariation,alongthex axis,ofthepartialvolumeofasolutioncontainingionsata(not known)concentrationindependentofx.Inthepresentpaper,the resistivityprofileisdiscussedastheresultofaposition-dependent concentrationofionsinthewaterpresentwithinthecoatingata partial volume assumed independent of x. Again, the physical situationmayinvolvedistributionofboth waterpartialvolume (within thecoating) and ion concentrations(within thewater) alongthethickness.
4.Conclusions
The impedance of pigmented coatings deposited onto AA2024wasstudiedunderdryandwetconditions.Intheformer configuration,theoutercoatingsurfacewasputincontactwith mercury, in the latter with NaCl solutions. The dry coating behaviourwasclosetothatof acapacitorand didnotreveala significantdependence ofthecoatingresistivityontheposition alongitsthickness,exceptforsomevariationintheoutermost,ca. 1
m
m thick layer. The behaviour of wet coatings progressively departedfromthequasi-ideallycapacitiveresponse,provingthat penetration of water and ions caused the development of a resistivityprofilemuchmoremarkedthanthatobservedwiththe dry coatings. The frequency dependence of the phase angle suggestedtheresistivity-positiondependencetobeclosertoan exponential than to a power-law relationship. Impedance and corrosionpotentialvs.immersiontimedataconvergedtosuggest thatwaterpenetrationoccurredonashortertimescalethanionic penetration.Theresistivityprofilewasthereforeascribedmainly toagradientofthelocalionconcentrationinthewaterpenetrated withinthecoating.Acknowledgments
The authorsgratefully acknowledge thecompany MAPAERO (Pamiers,France)forthepreparationofthecoatedsamplesand moreparticularlyPaulineCôteandPierre-JeanLathièreforfruitful discussiononcoatingtechnologies.ThePhDthesisofNguyenAnh Sonispreparedintheframeworkoftheassociatedinternational laboratory“FunctionalCompositeMaterials(FOCOMAT)”between FranceandVietnam.
References
[1]S.Amand,M.Musiani,M.Orazem,N.Pébère,B.Tribollet,V.Vivier, Constant-Phase-ElementBehaviorCausedbyInhomogeneousWaterUptakein Anti-CorrosionCoatings,Electrochim.Acta87(2013)693–700.
[2]M.Musiani,M.Orazem,N.Pébère,B.Tribollet,V.Vivier,Determinationof ResistivityProfilesinAnti-CorrosionCoatingsfromConstant-Phase-Element Parameters,Prog.Org.Coat.77(2014)2076–2083.
[3]B.Hirschorn, M.E.Orazem,B. Tribollet, V.Vivier, I. Frateur,M.Musiani, Constant-Phase-Element Behavior Caused by Resistivity Distributions in Films:1.Theory,J.Electrochem.Soc.157(2010)C452–C457.
[4]M.Musiani,M.Orazem,N.Pébère,B.Tribollet,V.Vivier, Constant-Phase-Element Behavior Caused by Coupled Resistivity and Permittivity DistributionsinFilms,J.Electrochem.Soc.158(2011)C424–C428. [5]B.Hirschorn, M.E.Orazem,B. Tribollet, V.Vivier, I. Frateur,M.Musiani,
Constant-Phase-Element Behavior Caused by Resistivity Distributions in Films:2.Applications,J.Electrochem.Soc.157(2010)C458–C463. [6]M.E.Orazem,I.Frateur,B.Tribollet,V.Vivier,S.Marcelin,N.Pébère,A.L.Bunge,
Constant-Phase-Element(CPE)ImpedanceResponse,J.Electrochem.Soc.160 (2013)C215–C225.
[7]C.LePen,C.Lacabanne,N.Pébère,Characterisationofwater-basedcoatings byelectrochemicalimpedancespectroscopy,Prog.Org.Coat.46(2003) 77–83.
[8]L.Young,Anodicoxidefilms,AcademicPress,NewYork,1961.
[9]C.A.Schiller,W. Strunz,Theevaluationofexperimentaldielectricdataof barriercoatingsbymeansofdifferentmodels,Electrochim.Acta46(2001) 3619–3625.
[10]W.K.Asbeck,M.V.Loo,Criticalpigmentvolumerelationships,Industrialand EngineeringChemistry41(7)(1949)1470–1475.
[11]G.P.Bierwagen,CPVC(criticalpigmentvolumeconcentration)calculations,J. PaintTechnol.44(1972)46–55.
[12]P. Agarwal, M.E. Orazem, L.H. García-Rubio, Measurement Models for ElectrochemicalImpedanceSpectroscopy:1.DemonstrationofApplicability, J.Electrochem.Soc.139(1992)1917–1927.
[13]P.Agarwal,OscarD.Crisalle,M.E.Orazem,L.H.García-Rubio,Applicationof Measurement Models to Electrochemical Impedance Spectroscopy: 2. Determination of the Stochastic Contribution to the Error Structure, J. Electrochem.Soc.142(1995)4149–4158.
[14]P. Agarwal,M.E. Orazem,L.H. García-Rubio,Applicationof Measurement Models to Electrochemical Impedance Spectroscopy: 3. Evaluation of Consistencywith the Kramers–KronigRelations, J. Electrochem.Soc.142 (1995)4159–4168.
[15]W.S. Tait, Using electrochemical measurements to estimatecoating and polymerdurability,J.Coat.Technol.75(2003)45–50.
[16]B.R. Stafford,Electrochemical impedance spectroscopyresponseof water uptakeinorganiccoatingsbyfiniteelementmethods,Electrochim.Acta52 (2006)1339–1348.
[17]H.Leidheiser Jr.,D.J. Mills,W.Bilder, Thepermeabilityofpolybutadiene coatingtoions,waterandoxygen,in:M.W.Kendig,H.LeidheiserJr.(Eds.), Corrosionprotection by organiccoatings, Vol.87-2, TheElectrochemical SocietyInc.,Pennington,1987,pp.23–36.
[18]J.R.Scully,Electrochemicalimpedanceoforganic-coatedsteel:correlationof impedanceparameterswithlong-termcoatingdeterioration,J.Electrochem. Soc.136(1989)979–989.
[19]B.N.Popov,M.A.Alwahaibi, R.E.White,Usingelectrochemicalimpedance spectroscopyasatoolfororganiccoatingsolutesaturationmonitoring,J. Electrochem.Soc.140(1993)947–951.
[20]V.B.Miškovic-Stankovic,D.M.Dražic,M.J.Teodorovic,Electrolytepenetration throughepoxycoatingselectrodepositedonsteel,Corros.Sci.37(1995) 241–252.
[21]V.B. Miškovic-Stankovic, D.M. Dražic, Z. Ka9carevic-Popovic, The sorption characteristicsofepoxycoatingselectrodepositedonsteelduringexposureto differentcorrosiveagents,Corros.Sci38(1996)1513–1523.
[22]J.M.Hu,J.Q.Zhang,C.N.Cao,Determinationofwateruptakeanddiffusionof Cl– ion in epoxy primer on aluminum alloys in NaCl solution by
electrochemicalimpedancespectroscopy,Prog.Org.Coat.46(2003)273–279. [23]Q.Zhou,Y.Wang,ComparisonofclearcoatingdegradationinNaClsolution
andpurewater,Prog.Org.Coat.76(2013)1674–1682.
[24]U. Rammelt, G. Reinhard, Application of electrochemical impedance spectroscopy(EIS)forcharacterizingthecorrosion-protectiveperformance oforganiccoatingsonmetals,Prog.Org.Coat.21(1992)205–226. [25]B.R.Hinderliter,S.G.Croll,D.E.Tallman,Q.Su,G.P.Bierwagen,Interpretationof
EISdatafromacceleratedexposureofcoatedmetalsbasedonmodelingof coatingphysicalproperties,Electrochim.Acta51(2006)4505–4515. [26]G.Bouvet,D.D.Nguyen,S.Mallarino,S.Touzain,Analysisofthenon-ideal
capacitivebehaviourforhighimpedanceorganiccoatings,Prog.Org.Coat.77 (2014)2045–2053.
[27]W.Ellison,A.Balana,G.Delbos,K.Lamkaouchi,L.Eymard,C.Guillou,C.Prigent, Newpermittivitymeasurementsofseawater,RadioSci.33(1998)639–648. [28]X.Yang,K.Huang,Theempiricalformulaforcalculatingthecomplexeffective
permittivityofanaqueouselectrolytesolutionatmicrowavefrequency,IEEE Trans.Geosci.RemoteSens.43(2003)315–320.
[29]A.Peyman,C.Gabriel,E.H.Grant,Complexpermittivityofsodiumchloride solutionsatmicrowavefrequencies,Bioelectromagnetics28(2007)264–274.