1 1
Enhancing Knowledge for Renewed Policies against Poverty
Working Paper n° 11
Women political leaders, corruption and
learning: Evidence from a large public
program in India
Farzana Afridi, Vegard Iversen, M.R. Sharan
CDE
This project is funded by the European Union under the 7th Research Framework Programme (theme SSH) Grant agreement nr 290752. The views expressed in this press release do not necessarily reflect the views of the European Commission.
2
Women Political Leaders, Corruption and Learning: Evidence from a Large
Public Program in India*
Abstract:
We exploit randomly assigned political quotas for women to identify the impact of women’s political leadership on corruption and on the governance of India’s largest poverty alleviation program to date. Using survey data, we find more program inefficiencies and leakages in village councils reserved for women heads: political and administrative inexperience make such councils more vulnerable to bureaucratic capture. This is at odds with claims of unconditional gains from women assuming political office. A panel of official audit reports enables us to explore (a) whether newly elected women leaders in reserved seats initially perform worse; (b) whether they partly catch up, fully catch up or eventually outperform (male) leaders in unreserved seats and (c) the time it takes for such catch up to occur. We find that women leaders in reserved seats initially underperform but rapidly learn and quickly and fully catch up with male politicians in unreserved seats. Over the duration of their elected tenure, we find no evidence of overtake. Our findings suggest short term ‘costs’ of affirmative action policies but also that once initial disadvantages recede, women leaders are neither more nor less effective local politicians than men.Keywords: political reservations, gender, NREGA, India JEL codes: P26, I38
____________________
*The authors would like to thank the Government of Andhra Pradesh, particularly Sowmya Kidambi and R. Subrahmanyam for vibrant discussions, for facilitating the survey and access to the audit reports. This paper has benefitted from interactions with and comments from Karuna Aakella, Jens Chr. Andvig, Robin Burgess, Dilip Mookherjee, K. Raju, Vijayendra Rao, Kunal Sen and participants at the International Growth Centre’s (IGC) South Asia Growth Conference (Lahore, 2014), the IGC–Indian Statistical Institute (ISI) conference (2011, 2012), Centre for Policy Research conference (IIM, Bangalore), the International Growth Week (LSE, 2012), the Goldman School of Public Policy – JSGP conference (Delhi), seminars at the World Bank (New Delhi) and ISI (Delhi), the Journal of Public Economic Theory workshop on governance (Mysore) and NEUDC (Harvard). We are grateful to the International Growth Centre (IGC), the Planning and Policy Research Unit (PPRU) at the ISI, Delhi and NO-POOR grant for financial support.
a
7, S.J.S. Sansanwal Marg, Indian Statistical Institute, Economics and Planning Unit, New Delhi-110016; Email: [email protected]
b Institute for Development Policy and Management (IDPM), University of Manchester;
3
Introduction
Political reservations for women offer prospects of diversity and other governance dividends (e.g. Page, 2007; Swamy et al., 2001). Yet, in settings where gender discrimination affects the attributes and attitudes of candidates for political office, female representatives are likely to assume office with less political and administrative experience. Thus, even if women political leaders were intrinsically more development-oriented than their male counterparts, extant disparities might initially blur and significantly delay the onset of governance gains.
Using cross-sectional survey data and a panel of official social audit reports, we present rigorous analysis of the impact of village council headship quotas for women on corruption and on the quality of delivery of a large scale, rural poverty alleviation program in India. Our paper is the first to shed light on how governance and corruption evolve from the time women elected leaders in reserved seats assume office (2006) and towards the end of their tenure (up to 2010) and thus as newly elected women leaders accumulate political and administrative experience. The timing of the relevant election overlaps almost exactly with the roll out of the public program (2006) and enables us to study short and long term program implementation with the characteristics of the village council (including the council head) unchanged. Specifically, we are able to demonstrate (a) whether newly elected women leaders in reserved seats initially perform worse; (b) whether they partly catch up, fully catch up or eventually outperform (male) leaders in unreserved seats and (c) the time it takes for such partial catch up, full catch up or overtake to occur.
Recent research has exploited the national policy of randomly reserving one-third of village council headships for women in India to study the difference in governance outcomes between male and female political leaders using cross-sectional, village council level data. In a pioneering study in the Indian states of Rajasthan and West Bengal, Chattopadhyay and Duflo (2004) found that public investments in village councils with a female reserved head reflected the preferences of female voters, exemplified by drinking water and roads, more strongly. Others have questioned such differences in male and female leadership behavior (Rajaraman and Gupta, 2012) and its consequences for governance. Ban and Rao’s (2008) study of four South Indian states found that “(village councils) led by women are no worse or better in their performance than those with male
leaders, and women politicians do not make decisions in line with the needs of women.” Bardhan et
al. (2010) find reservations of village council headship for women in West Bengal to be associated with a significant worsening of within-village targeting of public programs to disadvantaged households, and no improvement on other targeting dimensions. They interpret these findings as consistent with a more complex hypothesis of ‘capture-cum clientelism’ which may be weakened by the election of politically inexperienced women into reserved posts.1 Bardhan and Mookherjee (2012) formalize capture and clientelism in a theoretical model and speculate that such adverse effects of reservations may attenuate as women accumulate experience.
In an influential paper, Beaman et al. (2009) study voter prejudice and how exposure to women leaders (in first and second time reserved village councils) in West Bengal affect the electoral prospects of women candidates and the likelihood that women will stand for office. They also report cross-sectional survey findings on average investments in public goods in reserved and non-reserved village councils. Residents in female reserved village councils were less likely to have paid a bribe to be deemed eligible to receive various public program benefits or get a water connection. This was independent of whether the council had been reserved once or twice and parallels our survey but with different corruption findings. While Beaman et al. (2009) focus on the attitude and response of the electorate to first time or repeat exposure to women political leaders, we study performance from the start towards the end of tenure of newly elected women leaders and whether accumulating political and administrative experience impact on corruption and the delivery of a large poverty alleviation program.
To sum up, empirical evidence on the impact of gender headship quotas on the quality of public
1 Mansuri and Rao (2012), chapter 6, review research on the effects of political reservations for women in
4
service delivery is ambiguous. Moreover, robust evidence on the impact of women’s leadership on
corruption in public programs is very limited.Our research addresses this void and is of immediate
policy relevance given the renewed global commitment to boosting women’s presence in political life (WDR, 2012) and the debate within India about whether to reserve state and national legislature seats for women or not.2
At the outset, governance outcomes may diverge because of systematic differences in the preferences of male and female political leaders.3 Early evidence from cross-country survey data attest to women’s greater honesty and commitment to ethical conduct (Dollar et al., 2001) and suggest that women, on average, are less tolerant of corruption than men (Swamy et al., 2001).4 Experimental studies also indicate that women are more risk-averse and thus less likely to engage in risky behavior than men (Eckel and Grossman, 2008; Fletschner et al., 2010). Juxtaposing these findings to political life would make women less willing to accept bribes or to indulge in corrupt practices provided that such acts are perceived as illegal.5 If political power is captured from the de-facto leader, which may be more likely under female headship, risk aversion could make female leaders more inclined to let public funds leak and avoid confronting and punishing pilferers. Thus whether, and the ‘channels’ through which female leadership impacts on corruption and governance in real world settings has yet to be convincingly unpacked.
We identify the causal impact of female leadership on corruption over the tenure of the village council head by studying the interaction between the nation-wide policy of randomly reserving one-third of village council headships for women and the implementation of India’s most ambitious poverty alleviation program to date - the National Rural Employment Guarantee Act (NREGA) - in the state of Andhra Pradesh. First, using cross-sectional survey data we analyze whether corruption in program registration and the quality of program delivery differ by village council reservation status. Second, we use official audit reports covering a five year period to build a village-level panel dataset with in-depth information on corruption in program delivery. We can thus explore whether any early setbacks, evident in the cross-section, recede and improve through learning-by-doing and the accumulation of experience over the duration of women reserved council heads’ time in office. Unlike any previous study, we measure a variety of corruption outcomes, including irregularities in the receipt of wage payments by beneficiaries (e.g. bribes and impersonations) and in material expenditures on program projects (e.g. ghost projects and bribes).
Our analyses of household survey data, in village councils within a sub-district, suggest that households in village councils reserved for women are more likely to have experienced corruption and sub-standard NREGA administration, particularly at program inception. Although this result does not hold for every program process, all significant coefficients point in the same direction. These conclusions hold both for processes for which the village council is primarily responsible and for those where responsibilities are shared with other program functionaries.
Turning to the audit panel data, which allow for performance variation over time, we find more
2 In 2004, 8 per cent of India’s national assembly seats were held by women (Election Commission of India:
http://eci.nic.in/eci_main1/index.aspx). A 2009 constitutional amendment which increased reservation of
village council headships for women to 50 per cent has been implemented in a few states.
3 The literature on intra-household resource allocation suggests that men and women’s preferences differ
(Alderman et al, 1995): women are more likely to be ‘socially-oriented’ while men tend to be ‘individually-oriented’ (Eckel and Grossman, 2008).
4 Cross-country findings of greater female political representation being associated with lower corruption
(Dollar et al. 2001; Swamy et al. 2001) may be driven by omitted variables that correlate positively with corruption and negatively with women’s political representation. Using panel data, Cheung and Hernández-Julian (2006) find no significant relationship between female representation and government corruption in the U.S. Branisa and Ziegler (2010) use an index of civil liberties as a proxy for the omitted variable and argue that both corruption and the fraction of female representatives may be explained by this indicator.
5In Alolo’s (2006) ‘experiment’ in Ghana, women were less susceptible to use public office for individual gain
and more likely to ‘misuse’ public office to promote family interests. Booth and Nolen (2012) and Alatas et al. (2009) report experimental evidence suggesting that women’s risk-aversion may be context specific.
5
irregularities in female reserved village councils at the onset of the program and a significant decline in irregularities with the duration of the female council head’s time in office. This progress is not only remedial but involves rapid and complete catching up. Our results are robust to unobserved sub-district characteristics, overall time trends and sub-district specific time trends.
We do not find evidence of reporting biases, gender stereotypes or differences in the probability of re-election of male and female leaders as alternative explanations for these results. However, the audit data indicate that sub-district level bureaucrats are more likely to be responsible for NREGA discrepancies in female reserved village councils, suggesting a greater vulnerability to bureaucratic capture in such councils. This vulnerability is likely to be exacerbated by women’s political and administrative inexperience. Indeed, in instances where female heads have prior political experience and do not require assistance in executing their day to day duties, NREGA governance is significantly better.
Given that women’s status in south India (viz. Andhra Pradesh) is relatively favourable, our estimates are likely to represent a lower bound of the ‘costs’ of political reservations: catching up may take considerably longer in settings where gender disparities are more deeply entrenched e.g. in large, north-Indian states. The variation in women’s performance during their tenure highlights the importance of timing of measurement of relevant outcomes in efforts to evaluate the impacts of political reservations using cross-sectional data. Our study also highlights the need for more research addressing the dynamic aspects of political gender quotas in developing countries. These findings underline the need for capacity building and institutional support to reduce corruption and make women’s political participation and affirmative action policies more effective.
The remainder of the paper is organized as follows. Section 2 describes the NREGA program. Section 3 discusses the data and our estimation methodology. Our results are discussed in section 4 while section 5 concludes.
1.
Background
A. The National Rural Employment Guarantee Act
The NREGA (2005) provides a right based, legal guarantee of 100 days of annual work to rural households willing to volunteer adult labor to public works.6 The Act was initially implemented in the country’s poorest 200 districts in February 2006, an additional 130 districts in 2007 and national coverage thereafter (2008). In 2011-12, employment was provided to almost 40 million households at an annual expenditure of nearly Rs. 40,000 crores (more than $8 billion), 70 per cent comprising expenditure on wages.7
Several steps need to be followed for a household to obtain NREGA work. The first is to apply to the village-council - the Gram Panchayat (GP) - for ‘registration’, in writing or orally.8 Once registered, the GP is required to issue a free of cost ‘Job Card’ with regular updates on days worked and wages earned by each adult household member on all NREGA projects. Thereafter, a household in need of work is expected to submit a written application to the GP. Employment is then to be provided within 15 days of the application. If this deadline is exceeded, the household is entitled to a daily unemployment allowance. NREGA wages should be paid weekly and not beyond a fortnight.9 The cost of the material component of NREGA projects should not exceed 40 per cent of total project costs. Hence, the bulk of expenses are earmarked for labor wages.
Under India’s system of decentralized governance, locally elected governments have a leading role in
6
http://nrega.nic.in/rajaswa.pdf
7 There may have been an up to three-fold increase in public funds allocated to rural workfare programs
between 2004-05 and 2008-09 with the introduction of the NREGA (Afridi, 2008).
8 Households register once, usually during the early years of the program. See footnote 30 below.
9 Works permitted under the NREGA include water conservation, drought proofing, flood protection,
6
NREGA implementation. The directly elected village council is responsible for planning and the subsequent execution of at least 50 per cent of all NREGA works in villages (between one and three) within its purview. Further, the portfolio of projects should be prepared and follow the priority expressed by the adult GP residents. The sarpanch, the village council leader, is directly elected by GP residents and overall responsible for decisions made by the GP. The list of projects recommended by the GP is then forwarded to the sub-district program officer and from there to the district program officer for final technical and financial approval.
A novel feature, distinct from previous workfare programs in India, is the mandatory ‘social’ audits of NREGA projects. The Act envisages, somewhat naively, that competent audits will be organized by beneficiary households at regular intervals. The guidelines thus make participatory audits the main instrument to ensure transparency and the accountability of those responsible for program implementation.
B. The administration of NREGA projects in Andhra Pradesh
Andhra Pradesh (AP) ranks fifth in population (Census, 2011) and is among India’s leading states in NREGA implementation for two main reasons. First, AP has consistently generated high NREGA employment with more than 4 million households on the payrolls in 2011-12.10 Second, the state uniquely tackled the challenge of credible auditing of NREGA projects by vesting the responsibility for conducting regular and systematic audits (unlike other Indian states where audits are either not conducted or conducted in an ad-hoc manner) within an autonomous arm of its Department of Rural Development (the Society for Social Audits, Accountability and Transparency (SSAAT)). The state, therefore, claims to maintain high standards of accountability and transparency in program implementation.11
As for other public programs, there are three tiers of administration of NREGA projects – district, sub-district and village. District level bureaucrats oversee project implementation. At the sub-district or mandal level, the Mandal Parishad Development Officer (MPDO) is assisted by the Assistant Program Officer (APO) in administering the program monitoring and sanctioning of all financial payments (labor and materials related) for projects undertaken in the mandal (see Figure A1 in appendix).
While village councils in AP are typically less mature and less powerful than in states like Kerala and Rajasthan (Ban and Rao, 2008), they maintain a crucial role in managing and executing NREGA projects.12 First, the Field Assistant (FA), a resident of the GP who assists the village council in NREGA implementation, is appointed on the sarpanch’s recommendation. The FA represents the direct interface of beneficiary households with the program. Thus the village council has the main say in the selection of this vital program functionary.13 Second, the sarpanch selects suppliers of material inputs to NREGA projects and is therefore well positioned to fudge material expenditures in connivance with other staff (viz., Assistant Engineers, Technical Assistants and/or the suppliers). Hence, the village council and its leader are accountable both for ensuring efficient delivery of program benefits and for the labor and material expenditures on NREGA projects.
GP elections in AP were last held in July 2006 after which new village council heads (sarpanches) and
10
Only two other states, Uttar Pradesh (6 million households) and Tamil Nadu (5 million households) generated more employment under NREGA than AP during this period (http://nrega.nic.in/)
11 Aiyar et al. (2013) provide a fuller account of the AP ‘social audit model’. 12
The administrative functions relating to the implementation of all projects under the NREGA were devolved to Panchayati Raj institutions in AP in December 2007 (G.O. Ms. No. 571) (www.rd.ap.gov.in).
13
Data from our GP survey show that for the first and the most recent FA, the village council had the main say in FA appointments in at least 80 per cent of the GPs. In about 40 per cent of appointments, village councils controlled the entire selection process with no mandal level bureaucracy involvement. The FA registers households, distributes job cards to registered households, receives applications for employment, informs applicants about work availability, maintains attendance records at work sites and verifies and closes labor records for weekly wage payments. See Figure A2 in Appendix for further details.
7
other elected members assumed office for a five-year term. The timing of this election overlaps almost exactly with the phasing-in of the NREGA in AP in February, 2006 and presents us with the opportunity to study short and long term program implementation (up to 2010) with the characteristics of the village council (including the sarpanch) unchanged.
AP also presents a unique opportunity to use data from official social audit reports of NREGA projects. Since late 2006, auditors have been trained at the state, district and village level in how to audit NREGA public works (Aakella and Kidambi, 2007). All GPs within a mandal are covered by a single audit team during a one week period. In conjunction with Right to Information legislation, information about expenditures on any NREGA work in a mandal is accessed by the audit team (residents of the audited GP are barred from team membership) and verified first through visits to laborers listed in the worksite logs and subsequently through worksite inspections to verify materials expenditures.14 Complaints by individuals, groups of individuals and by the audit team itself are recorded and attested in audit reports prepared for each GP. The audits are followed by a “public hearing” where findings are discussed, accused officials have an opportunity to defend themselves and the responsibility for each upheld violation is pinned on one or multiple program functionaries.15 The risk of frivolous complaints is therefore minimized. The membership of the audit team is deliberately varied across audit rounds in each mandal or GP to prevent auditors from developing biases or getting corrupted. Systematic and standardized audits have been carried out in all 23 districts of the state with an average of over two rounds of audits completed per mandal/GP between 2006 and 2010.
2.
Data and methodology
A. Data
We use two sources of data in our empirical analysis. First, the primary surveys conducted at three levels - households, gram panchayats and mandals - in eight of the 23 districts in rural AP during April-June 2011.16 100 mandals were randomly selected across these districts (either 12 or 14 mandals in each district). In each randomly chosen mandal, three gram panchayats were selected in the following manner –
1. the GP which was the administrative headquarter of the mandal.17 2. one randomly selected GP from the list of all GPs reserved for a female sarpanch in that mandal in
2006 and
3. one randomly selected GP from the list of all GPs NOT reserved for a female sarpanch in that mandal in 2006.
In each GP, we randomly sampled five beneficiary households in the main village. This gives a total sample of 1,500 beneficiary households across 300 GPs. Note that beneficiary households were selected on the basis of ‘ever’ having worked in the program since its inception in the GP.
The mandal questionnaire was administered to the MPDO and the APO. Data on the composition of the village council, NREGA implementation, sarpanch characteristics, the history of political leadership in the sarpanch’s family, details of the sarpanch elections (list of contestants, votes
14
Since material expenditure verification requires technical expertise, only qualified members of the audit team (i.e. state or district level auditors) undertake this task.
15
Audit timings are determined by the SSAAT, which has put in place meticulous checks and balances to prevent NREGA functionaries from corrupting social audit team members (see Figure A3 in Appendix).
16
Mahbubnagar, Medak, Nizamabad, Warangal and Khammam (north or Telangana region), Anantpur and Kurnool (south or Rayalseema region) and Guntur (west or coastal region) districts. NREGA was implemented in February, 2006 in all, except Kurnool and Guntur, which implemented the program from April, 2007 onwards.
17 In case the headquarter GP was not designated as ‘rural’ we randomly selected one GP that was not
8
obtained) and questions including assistance received in the day-to-day execution of sarpanch duties were gathered in each GP.18 The household survey gathered information on households’ socio-economic characteristics, their awareness of NREGA entitlements and extensive details of their experience with obtaining work and wages under the program since its implementation in their GP. Our second source is data extracted and codified from the original, social audit reports for each GP.19 These GP audit reports have two sections: a standardized audit report card which records the date of the audit along with the demographic characteristics of the GP, and more importantly, the audit team’s summary of the audit findings. The latter is informed by the second section of the audit report – the list of all registered complaints and discrepancies uncovered during door to door verification and project site visits. In our analysis we use data on irregularities verified during the public hearing and recorded in the Decision Taken Report. 20
Each of these two sources of data is linked to the village census abstracts for 2001 and the State Election Commission data on reservation of sarpanch seats in 2006.21 We, therefore, utilize two data sets in our analyses – cross-sectional household level data and panel data on audits of NREGA projects at the GP level.
B. Summary statistics
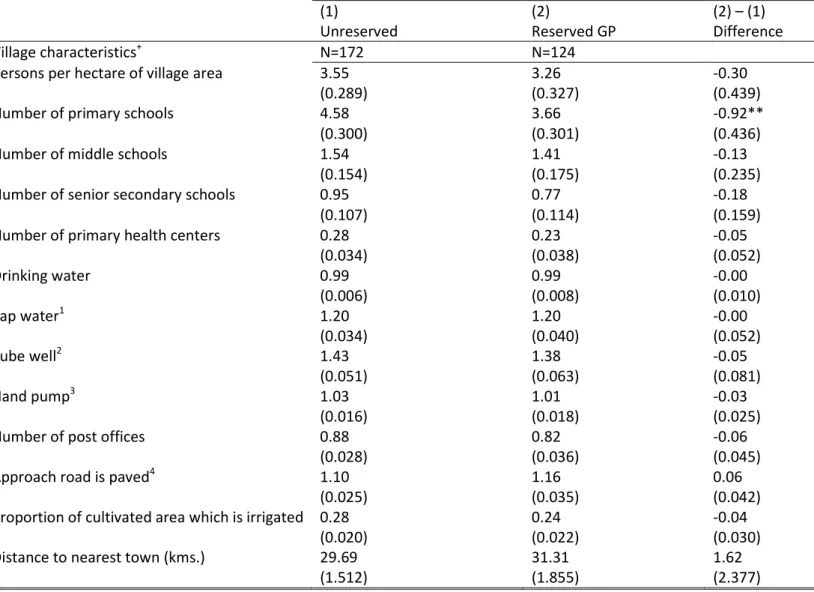
Table 1 shows the village level characteristics of the sampled GPs by sarpanch reservation status using village level census data for 2001. We find no statistically significant difference in the provision of public goods by reservation status except in the number of primary schools. The population density, availability of irrigated land, the distance to an urban center and the level of public goods provision are comparable between these GPs. The statistics, thus, suggest that the reservation of the post of sarpanch for women was indeed random in AP. 22
The insignificant differences in village characteristics are accompanied by significant differences in the characteristics of elected sarpanches as shown in the top panel in Table 2. Reserved village council heads are likely to be younger, less educated, have no prior political experience and more likely to receive assistance with their day to day sarpanch work. 23 There is no difference between the reserved and unreserved GPs in the low proportion of village council heads with previous
18 Data on the sarpanch elections were cross-checked with multiple sources – elected sarpanch, rival
contestant whose political party affiliation differed from that of the winner, political party workers (other than the winner’s) and, if available, the GP secretary.
19 In instances where the original audit reports were missing we used information from the abridged versions
of the audit reports available from the SSAAT website: http://125.17.121.162/SocialAudit/ . 11 GP-audit reports are missing – both in hard copy and online.
20
We coded the audit findings as follows: each complaint was first classified as labor, material or worksite facilities related. The former two were then disaggregated by complaint type. For each complaint we recorded whether any misappropriated amount was mentioned; if yes, the amount was recorded; the functionaries held responsible for the complaint; and the type of complainant – individual, group or audit team along with gender composition of the former two.
21
Using administrative data from the National Panchayat Directory, National Informatics Centre (http://panchayatdirectory.gov.in/) for AP we created a single dataset with information on both the GP name and all villages within that GP in our sample. The villages in the administrative dataset were then matched with census villages by name. The data shown here are only for the main village of the GP. Almost 80 per cent of GPs in the sample have only one village. Our conclusions from Table 1 are unaffected for a population weighted average of all villages in the GP.
22
Female sarpanches held office almost exclusively because of reservations: 6.5 per cent of sarpanches in unreserved GPs in our sample were women.
23
‘Prior political experience’ is defined as a dummy variable with value 1 if the current sarpanch had previously held an elected position in a gram, mandal or district panchayat or had experience of leadership of a political party. The variable ‘receives assistance with day to day work’ is coded 1 if the elected sarpanch’s response to the survey question “Does any family member or any other relative/friend assist you in your day to day work as sarpanch?” was “Yes”. We find no difference in age or education of assisted reserved and unreserved sarpanches. The latter, however, are more likely to belong to GPs reserved for SC and ST heads.
9 sarpanch experience.
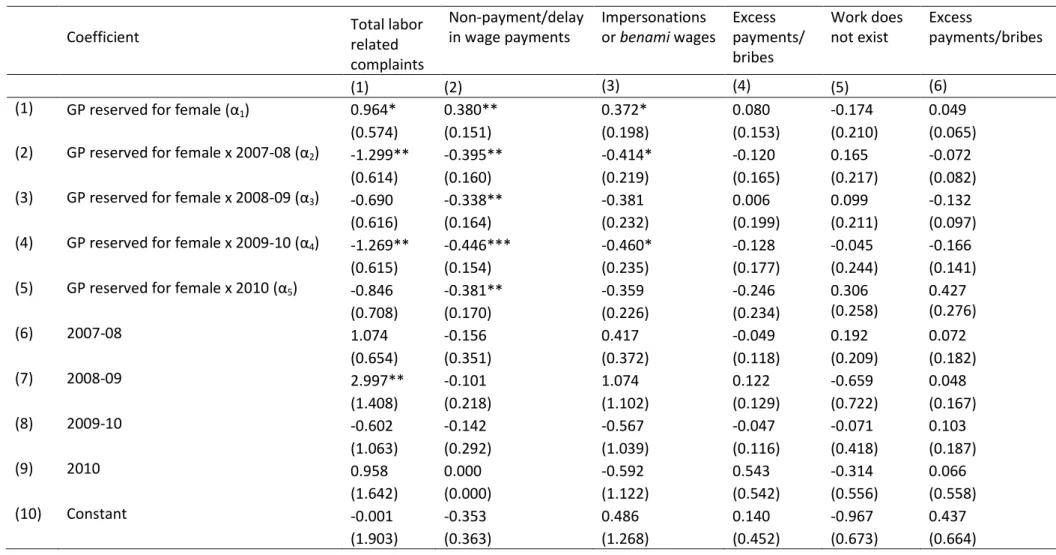
The bottom panel of Table 2 describes the audit data for the period 2006 to 2010. We find no difference in the number of audits or total complaints filed per audit in reserved and unreserved GPs. More than 80 per cent of all complaints were labor related and this share was significantly higher in reserved GPs. While irregularities related to non-payment or delays and bribes in wage payments differed insignificantly, reserved GPs exhibited marginally more impersonation and
benami related irregularities. Complaints of irregularities related to bribes in materials expenditures
were significantly higher in unreserved GPs.
The household summary statistics suggest that while sampled households are comparable on observables between the two types of GPs,24 households in female reserved GPs were more likely to have experienced leakages or misappropriation of program funds than in unreserved GPs (Table A1 in Appendix). These include, greater likelihood of being asked to pay to register with the program (or receive the free job card); to have been paid less than the due wage; delayed wage payments; wage paymentsin cash (instead of direct transfer into the beneficiary’s post office or bank account) and discrepancies in wage payments conditional on official verification of labor records.
C. Estimation methodology
We conduct two separate analyses: the first at the level of the household using our cross-sectional survey data, and the second at the level of the GP using panel data extracted from the social audit reports.
The main estimating equation for the household level analysis is given by: NREGA_outcomeijk = β0+β1 Rjk+ β2 Xjk +β3 Zijk + β4 Dk +εijk (1)
where the outcome for household i in GP j in mandal k is a function of whether GP j in mandal k is reserved (R) for a female sarpanch, a vector of characteristics Xjk of the GP including the attributes of
the GP sarpanch. The latter includes the age, the square of age, caste (a dummy variable each for SC, ST, OBC or upper caste), level of education (dummy variables for illiterate, less than primary, primary, middle, secondary, higher secondary, graduate, diploma) and a dummy for own prior political experience. To account for the impact of any village level characteristics on our outcomes of interest, vector Xjk also includes a dummy variable for whether the GP is the mandal headquarter
and village census attributes (number of primary schools, presence of paved road, number of post offices and proportion of irrigated land). Zijk is a vector of characteristics of the household (dummy
variables for SC, ST, OBC, Hindu, female-headed, age and age-square of household head, levels of head’s education as for sarpanch above and landed household).
The MPDO plays a major role in the implementation of NREGA projects in AP (Figures A1 and A2 in Appendix). We, therefore, abstract from the impact of mandal characteristics on outcomes of interest by confining ourselves to variation in program implementation across GPs within a mandal by including the dummy variable Dk whichequals 1 if the mandal is k and 0 otherwise. Our main
coefficient of interest is β1 - the average effect of having a female GP head on the outcome variable
under scrutiny. εijk is the idiosyncratic error term. The dependent variable NREGA_outcomeijk spans
the gamut of household experiences with the program - from registering for work, to obtaining and finally, receiving payments for work.
Our second line of inquiry makes use of the panel, audit data. We pool data on all the verified complaints filed during each audit in each GP between 2006 and 2010 using the following specification:
24 Differences in all average household attributes, including awareness about program entitlements, are
insignificant, except the proportion of scheduled tribe (ST) households which is significantly higher in unreserved GPs. Hence, any conclusions regarding average differences in the process of program implementation in the two types of GPs should not be driven by differences in average household characteristics.
10
Auditjklt = α0+α1Rjkl + Σt αt (Rjkl*Yeart)+α6Xjkl +α7 Dk + Σt δt Yeart + Σt γt (Dl * Yeart)+µjklt
(2)
The findings of the audit for GP j in mandal k in district l in audit year t, Auditjklt, is a function of
whether the GP is reserved for a female sarpanch, Rjkl; a vector of GP characteristics, Xjkl (as in
equation 1); mandal fixed effects and time trends for each audit year. We define each audit year in terms of the financial year in which funds are allocated to NREGA projects – from April of a calendar year to March of the next calendar year. Thus our specification includes dummy variables for audits in 2006-07, 2007-08, 2008-09, 2009-10 and 2010-11. For the last financial year the data include audits until December, 2010. Hence t takes values from 2007-08 (t=2) to 2010 (t=5).
Our dependent variable is the number of a complaint type filed in GP j in mandal k in district l in audit year t. It is, therefore, the total number of complaints of a specific type registered during an audit in a GP, as elucidated in the second panel of Table 2. To explore the effects of women leaders gaining experience and learning by doing, we interact each audit year with the dummy for female reservation. The first audit year, 2006-07, represents our benchmark year. α0+α1 is the coefficient for
reserved GPs while α0 is the coefficient for unreserved GPs. α1 is, thus, the difference in the outcome
between reserved and non–reserved GPs in 2006-07. For t=2, α1+α2 measures the difference in the
outcome between reserved and unreserved GPs, and so on for later years.25
A possible confounding factor is the presence of region specific trends in the implementation and performance of NREGA which are correlated with GP reservation status. For instance, biometric identification of beneficiaries was introduced in some districts before others. To address this possibility we include linear, district specific trends (Dl * Yeart) in equation 2 above. Note that there
is no variation in the timing of audits within mandals since all GPs within a mandal are audited within the same week and by a single audit team.
3.
Results
A. Cross-sectional analysis - household survey
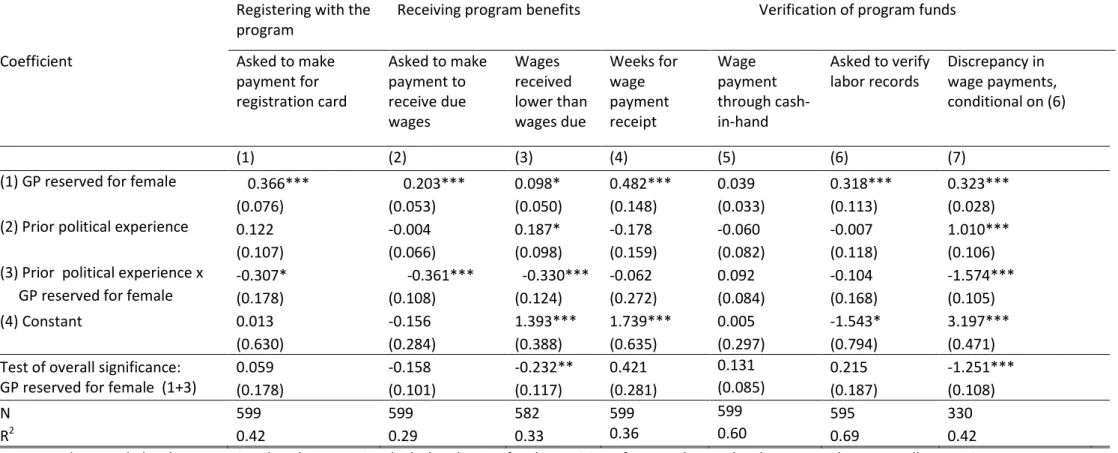
Table 3 reports results from estimating equation (1).26 We report the coefficient on the dummy for female reserved headship for two alternative specifications with household and sarpanch attribute controls (column 1) and with household, sarpanch and village attribute controls, the latter available from the census data (column 2). Both specifications account for unobservable mandal characteristics.
As seen in row 1, the likelihood that a beneficiary household was asked to pay to receive a job card is strongly significant in female reserved GPs although the amount paid (conditional on payment) is unaffected by GP reservation status.In female reserved GPs, the probability of being asked for a bribe for a job card was more than 6 percentage points higher than in unreserved GPs in column 1 and almost 8 percentage points higher when we control for village level characteristics in column 2. These are large effects – between 44 and 51 per cent higher than the average probability of being asked to pay a bribe in non-reserved GPs.27
We next consider households’ experience with receiving wage payments. The coefficient on female headship is positive but insignificant on whether the household was asked to pay a bribe to receive due wages or whether wages received were below the wages due in (rows 3 and 4,
25 Note that α
t reflects the difference in the difference between the outcome of reserved and unreserved GPs
between 2006-07 and year t.
26
See Table A2 in Appendix for the coefficient on ‘GP reserved for female’ when control variables are gradually introduced in Table 3. Controls for sarpanch characteristics, given their correlation with reservation status, affect the significance and magnitude of the point estimates.
27 See panel II in Table A1 in Appendix for summary statistics used in calculating these effects. For instance, 15
per cent of households reported being asked to pay a bribe in non-reserved GPs. Hence, (7.7 / 15)*100 = 51 per cent higher probability of a household in a reserved GP being asked to pay a bribe for a job card.
11
respectively). 28 However, delays in wage payments, a strong hint of administrative inefficiency, are more common in female headed GPs and significant for both specifications (row 5). This is almost 4 per cent higher than the average number of weeks for receipt of wage payments in unreserved GPs. The coefficient on wage payments through cash-in-hand is positive but insignificant once we control for mandal level unobservables and household, sarpanch and GP characteristics (row 6).
Recall that household awareness levels in the two types of GPs were not significantly different (Table A1 in Appendix). However, we find that a beneficiary household in a female reserved GP had more than 8 percentage point higher probability of being asked to verify its labor records, as shown in row 7 in both specifications. Since the audit team typically approaches beneficiary households for record verification and audits often do not cover all beneficiary households, this difference may reflect greater concern by auditors about irregularities in program benefits received by households. Alternatively, more comprehensive labor record verifications could suggest better quality of social audits in these GPs. In either case, conditional on being asked to verify records, households are almost 6 percentage points more likely to find discrepancies between actual and official records of wage payments in reserved GPs as indicated by the coefficients in row 8, although the coefficient is insignificant in column 2.
Overall, the analyses suggest that households in female reserved GPs are more likely to have experienced corruption and/or sub-standard NREGA administration, particularly during their initial program interaction, such as registration. Households register with the program only once. While the survey recall period for households’ experience with registration was the time since NREGA inception until the previous year (i.e. from 2006 to 2010), most households will have registered at the initiation of the program itself.29 This conclusion is most robust for processes for which the GP is almost entirely responsible, i.e. registration of households in panel 1. We do not find evidence of unreserved GPs performing significantly worse on any program process relative to female reserved GPs.
To disentangle the determinants of the average impacts in Table 3, we explore the effects of having a sarpanch with prior political experience on our outcomes of interest. The election of a sarpanch with prior political experience could potentially be correlated with other GP characteristics which in turn affect the quality of public program delivery. We do not find any significant difference in observable characteristics (except for the proportion of cultivated area which is irrigated – Table A3 in Appendix) of GPs with and without an experienced sarpanch. If at all, GPs with an experienced sarpanch have inferior development indicators compared to GPs where sarpanches have no experience (Table A3). Evidence suggests that corruption is more rampant in less developed regions (Transparency International, 2012). In our sample less developed GPs are more likely to have an experienced sarpanch. Thus, one would expect more, not less corruption in GPs with experienced sarpanches. This goes against our finding lower corruption in GPs with experienced sarpanches. Hence, unobservables are unlikely to drive our results.
Nevertheless, to address any potential differences in GP level unobservables, we restrict our sample to GPs where the sarpanch election in 2006 was closely contested for two reasons – first, we expect such GPs to be more likely to be comparable on observable and unobservable characteristics. This is held up by the data – we find no significant differences in observable characteristics of these GPs by sarpanch experience.30 Second, the election of an experienced sarpanch in a closely contested election is more likely to be a random event: the closest rival, who lost the election, may have had characteristics similar to those of the winning candidate. Thus, when we compare governance outcomes between GPs by the prior political experience of the sarpanch, the differences in program
28
In more than 80 per cent of the instances where households report being asked to pay a bribe to receive due wages, the bribe was asked for at the bank or post office, with no difference between reserved and unreserved GPs.
29
Administrative data from the Department of Rural Development, AP,
(http://nrega.ap.gov.in/Nregs/Home_eng.jsp) shows that for the period 2006-07 and 2010-11, almost 60 per
cent of all job cards in our sample were issued in 2006-07 itself.
30
12
delivery are less likely to be systematically correlated with unobserved characteristics of the GP and more likely to be driven by differences in sarpanch experience.
We define a closely contested election as one where the winning candidate received 0.1 to 8 per cent more votes than the nearest rival. Hence, we drop GPs where the sarpanch was elected unanimously or by a large electoral margin since such elections (or other GP characteristics) may be systematically related to our outcomes of interest.31
Using the specification from column (2) in Table 3, we report the coefficient on female reserved sarpanch, prior political experience of sarpanch and the coefficient on the interaction of the two for each outcome variable in Table 4. The coefficient on ‘GP reserved for female’ across columns 1 to 7 is in line with the results in Table 3 but the coefficients on the interaction of reservation status with experience are significantly negative suggesting that experienced sarpanches in reserved GPs perform better on corruption (column 1) and on the quality of governance (columns 2 and 3) than the average sarpanch in a reserved GP.
To elaborate, the negative coefficient on the interaction term in column 1 suggests that in reserved GPs with experienced sarpanches, the probability of being asked for a bribe for a job card is almost 31 percentage points lower than in a reserved GP with a sarpanch with no prior political experience. Note, moreover, that prior political experience does not improve governance (coefficients on prior political experience in columns 1-2 and 4-6) and even worsens it in some cases (columns 3 and 7) in unreserved GPs.32 The positive effects of political experience on corruption and governance are thus confined to women village council heads in reserved seats.
When summing up the total effect of being in a GP reserved for females (rows 1 + 3), the results in Table 4 suggest that women sarpanches perform at least on par with males once we account for prior political experience. For instance, in all columns (except 3 and 7), the point estimate on the total effect of a reserved GP on program delivery is insignificant. We reach very similar conclusions for the full sample, suggesting that our results are not driven by systematic differences in the characteristics of GPs with and without an experienced sarpanch (Table A4 in Appendix).
B. Panel data analysis - social audit reports
The results of the audit data analysis are reported in Table 5. The data have been restricted to GPs which had at least two rounds of NREGA audits between 2006 and 2010. The analysis is reported for a panel of two audits per GP.33
Concerns with reporting bias in registration of complaints are likely when households know that their grievances will be made public, as is the case with the audit process. For instance, if households perceive women sarpanches to be less able or less likely to retaliate if audit complaints are filed, there could be more such complaints in female reserved GPs even when the actual incidence of program irregularities is lower. To address possible reporting bias in the audit data, we analyze the number of discrepancies and complaints registered by the audit team alone. Since audit teams comprise of non-residents of the audited GP and its composition varies for each audit round, their complaints are unlikely to suffer from such biases.
The dependent variable(s), thus, is the number of each type of complaint filed by the audit team in that GP in an audit. Each column in Table 5 classifies the audit irregularity into those related to labor (columns 1 to 4) and material (columns 5 and 6) components of NREGA projects. Results are reported for equation (2).
Aggregating all labor-related irregularities, we find that the coefficient on female reservation in
31
An alternative would be to use previous reservation for woman sarpanch as instrument for experience of female leaders re-elected on reserved seats in 2006. Gender reservation of 1/3rd of GPs was introduced in AP in 1996 and each GP is reserved once in every three election cycles. Since there have been only three village council elections since (1996, 2001 and 2006) this instrument is unavailable for our context.
32 We omit results for ‘bribe amount conditional on payment’ in Table 4 due to a very small sample in the
restricted data.
33
13
column 1, row 1 is positive but insignificant. However, the incidence of labor complaints in female reserved GPs declines over time, as indicated by the negative coefficients on the interaction of female reservation with audit year (2007-08 and 2009-10). Column 2 refers to complaints related to non-payment or delays in wage payments. The coefficient in row 1 is positive and significant. Given that the average number of such complaints per audit during 2006-10 was 1.67 in female reserved GPs, these irregularities were more than 22 per cent higher (0.38/1.67) in these GPs in 2006-07 than the average for this period. These complaints decline significantly in subsequent years as indicated by the negative coefficients on the interaction terms in column 2, rows 2 to 5.
There is also a significant effect of female reservation on the number of complaints related to impersonation or benami wage payments in 2006-07, as shown in column 3 and a similar decline in these irregularities over time as indicated by the interaction terms in rows 2 to 4. These irregularities were over 28 per cent higher (i.e., 0.36/1.28) in 2006-07 in female reserved GPs than the average number of impersonation complaints per audit during 2006-10 in these GPs.
We do not find a significant effect of women’s reservation on the number of complaints filed related to excess wage payments and bribes in wage payments in female reserved GPs in 2006-07 as indicated in column 4. But the point estimates, including those of the interaction terms, are of the expected sign. These results are consistent with the hypothesis that as female leaders accumulate political and administrative experience, governance improves.
The coefficients on female reservation and the interaction terms in columns 5 and 6 are insignificant indicating that this characteristic of the GP did not have a bearing on misappropriation of material related expenditures in the program in 2006-07 or thereafter. However, the direction of the interaction terms in column 6 indicate that excess payments and bribes in material components of the program declined over time in reserved GPs, albeit insignificantly.34
The significantly negative coefficients for ‘GP reserved for female’ interacted with year in columns 1, 2 and 3 suggests that as women council heads gain experience, the initial disadvantages manifested in their poor program delivery (α1) disappears. This progress in reserved GPs is not just remedial but
involves rapid and complete catching up. This is indicated by the fact that the interaction coefficients (α2 in columns 1-3) are comparable in size to α1, suggesting that women leaders rapidly learn and
compensate for their poor governance in early years. Moreover, after the first year women political leaders perform on par with men since α1+αtis insignificantly different from zero for each t.
Recall that two districts in our sample did not introduce the program until 2007-08 (footnote 16). To address the concern that our results above may not only capture time differences in reservation but also differences in the levels of corruption between early (poorly governed) and late (better governed) program implementing districts, we drop these two districts and re-run the analysis with results reported in Table 6. While other results are unchanged, the coefficient on ‘GP reserved for female’ in column (1) is now significant at the 10 per cent level. Hence, differences in governance (or that late program implementers had better program delivery) between districts are not driving our results.35
To sum up, findings from the household survey and the audit data show higher labor related misappropriations in GPs reserved for women, but only during the early program years. While households responded to questions on whether they had “ever” experienced a particular irregularity since the NREGA inception (excepting questions on wage payments which were with reference to
34 We do not find any systematic relationship between village characteristics and the number of program
irregularities. However, implementation is likely to be significantly worse, particularly for the labor component, if the sarpanch is SC, ST or OBC as opposed to upper caste. There are no systematic effects of sarpanch education on irregularities.
35 A potential concern is that audit teams may themselves be biased, albeit less so than households. If so the
coefficient on ‘GP reserved for female’ should be positive and larger in magnitude for materials related complaints in Tables 5 and 6 since materials related expenditures are almost exclusively investigated by audit teams. However, the coefficients in columns 5-6 in Tables 5-6 are not statistically different from zero. This suggests that audit teams were not systematically biased against women leaders.
14
2009-10), the most robust result from Table 3 indicates corruption in obtaining a job card, which typically occurs at the onset of the program. The panel audit data show that program leakages reduce over time and that learning and the accumulation of experience matters only for women council heads elected to reserved GPs and does not affect program performance elsewhere.
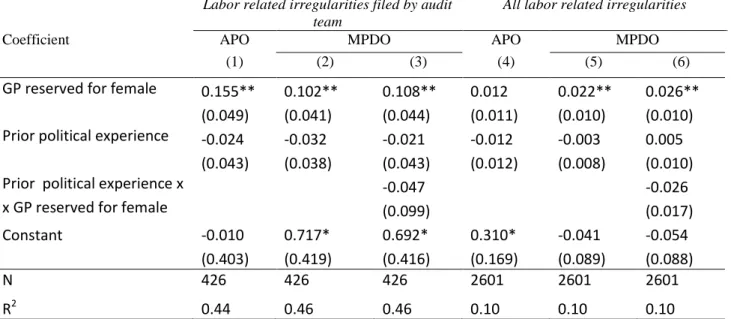
To explore whether our results indicate that the program is more vulnerable to capture by other program functionaries in reserved GPs, we use the audit data to investigate which NREGA functionaries are more likely to be held responsible for program irregularities. If there is capture, the data should indicate that malfeasance is higher among certain program functionaries in female reserved GPs. Our results are reported in Table 7. We restrict the analysis to labor related irregularities since these account for more than 80 per cent of all irregularities in our audit data.36 The dependent variable is a dummy variable that takes a value 1 if the MPDO (APO) was held responsible for the labor related irregularity and 0 otherwise. In columns 1-3 we restrict the data to complaints filed by the audit teams. The coefficient on ‘GP reserved for female’ suggests that bureaucrats (APO and MPDO) are indeed more likely to be held responsible for malfeasance in the labor component of NREGA projects. These results are held up when we analyze complaints filed by both beneficiaries and auditors in columns 4 to 6. Consistent with our earlier results, the probability of bureaucratic capture declines, albeit insignificantly, with prior political experience of the reserved female sarpanch as indicated by the negative coefficient on the interaction of experience with female reservation in columns 3 and 6. We do not find any significant differences in the probability of malfeasance responsibility being pinned on other NREGA functionaries, such as the Technical Assistant, Assistant Engineer or Branch Post Master, by reservation status (results not reported here).
C. Discussion of results
There are three possible confounding explanations of the observed average differences in governance between reserved and unreserved GPs. Starting with the household survey data, the foremost concern is that villagers may report poor governance if they perceive the GP leader to be weak and less likely to retaliate against complainants. If female reserved sarpanches are more likely to be perceived as weak, the differences between reserved and unreserved GPs could reflect reporting biases rather than genuine differences in governance. This may be more likely when the sarpanch lacks prior leadership experience. We do not find evidence supportive of this hypothesis. Reporting bias is a concern when information is publicly provided. Our household survey was conducted in the privacy of their homes: consistent with good social science practice, respondents were assured of anonymity and that their responses, including on sensitive issues like corruption, would be treated as strictly confidential. We also asked households about their perceived ‘effectiveness’ of the elected sarpanch.37 There is no statistically significant difference in the response of households in reserved and unreserved GPs. This suggests that, on average, households in both types of GPs did not differ in their perception of the political and administrative effectiveness of the council head. For these reasons, any perceived retaliation threats were unlikely to differ between the two types of GPs.
A second and related confounder is the presence of gender stereotypes - villagers may perceive women as more incompetent than men which may be reflected both in the household survey and the audit data. We do not, as noted, find any differences in households’ perceptions of the ‘effectiveness’ of the elected sarpanch between reserved and unreserved GPs. This is plausible given the higher levels of gender parity in AP when compared to the national average. Adding to this, the
36 Our results hold when we analyze data for all irregularities as well. However, we do not find any significant
effects of female reservation status on officials held responsible for irregularities in materials expenditure only. This could reflect the small sample of materials related complaints in the audit data.
37 Respondents in the household survey were asked whether they ‘strongly agree’, ‘agree’, ‘disagree’ or
15
discrepancies filed by audit teams, which are more likely to be bias-free point in the same direction. In addition, if gender stereotypes were responsible for the observed differences in NREGA governance, we should not observe better governance outcomes for female sarpanches with prior political experience or better administrative ‘ability’ relative to unreserved sarpanches with similar characteristics as discussed above.
Finally, our summary statistics suggest that, on average, sarpanches in female reserved GPs are less likely to have prior political experience, more likely to need assistance with day to day work and less likely to be educated. These observable characteristics, in addition to cultural stereotypes (Beaman et al., 2009), could imply that voters perceive women sarpanches as less able. They may, therefore, be less likely to vote for them once the village council headship reservation ceases. Thus, a woman sarpanch in a reserved GP is more likely to perceive her re-election odds, once reservation ceases, to be low irrespective of her performance in office. Research suggests that political leaders with slimmer re-election prospects are more likely to be corrupt (Ferraz and Finan, 2011). Thus the NREGA governance differences between the two types of GPs could reflect differences in the probability of re-election and thereby the ‘incentives’ of the incumbent sarpanch.
In our survey, before the next village council election, we first asked all sarpanches to rank their expected probability of being re-elected irrespective of the village council’s reservation status. We find no statistical difference in this probability between reserved and non-reserved GPs, although the former is lower.38 Next, reserved women sarpanches were asked to rank their probability of re-election if the GP was no longer reserved for women. Again, there was no statistical difference in their stated re-election probability compared to their response to the previous general question on re-election chances.
To sum up, our results, across both the household survey data and the audit data, suggest that female reserved sarpanches accumulate experience through learning by doing which in turn, translates into governance improvements. These conclusions resonate with but also substantially nuance Ban and Rao (2008) and Bardhan et al. (2010) who have drawn attention to the potential negative implications of the political and administrative inexperience of women council heads in reserved seats. Providing the first rigorous evidence on the time it may take for women political leaders in reserved seats to become effective, we are able to show that catching up occurs quickly and is not just remedial but complete. We also point to the higher possibility and risk of capture of power in GPs governed by reserved female heads in the early days of their tenure.
Conclusions
In this paper we focus on whether and how political reservations for women in village councils impact on the governance of India’s most ambitious anti-poverty program to date – NREGA - using data from Andhra Pradesh. Drawing on cross-sectional primary surveys and panel audit reports we are able to identify the impact of reserved female headship on a variety of dimensions of public program delivery, including measures of corruption.
Our results suggest that households in female reserved GPs are more likely to have experienced corruption and sub-standard administration in the early stages of program implementation. This conclusion holds both for implementation of those aspects of the program for which the GP is fully responsible and when responsibilities are shared with other program functionaries. The findings from the audit data confirm that irregularities are more likely to be prevalent in the initial years of
38 The survey question was “Please rank the chances of your being re-elected in the next sarpanch elections in
this Gram Panchayat on a scale of 0 to 5: (0) No chance of re-election (1)Very low (2)Low (3)Moderate (4)High (5)Almost certain to be re-elected. The average rank (excluding 12 non-responses) was 3.83 and 3.69 in unreserved and reserved GPs, respectively.
16 program implementation in GPs reserved for women.
We attribute these results to the lack of prior political and administrative experience of women sarpanches. Substantive backing for this explanation is obtained from the audit data analysis which shows that as experience accumulates, governance improves. The explanation is also supported by results which suggest that mandal level bureaucracy are more likely to be held responsible for malfeasance in the program in GPs reserved for a woman sarpanch. While there is no effect of experience on reducing bureaucratic capture of power per se, it is somewhat ameliorated in GPs where reserved sarpanches have had prior political experience.
Crucially, the progress made by women political leaders is not just remedial but involves rapid and complete catching up. Women political leaders do not perform better or worse than men once these initial, gendered disadvantages recede. Given the higher gender parity and female literacy in Andhra Pradesh relative to other parts of India, our estimates of learning effects and the time to catch up are likely to represent lower bounds.
17
References
Aakella, K. V. and S. Kidambi (2007), “Social audits in Andhra Pradesh: A process in evolution,”
Economic and Political Weekly, 42 (47): 18-19
Afridi, F. (2008), “Can community monitoring improve the accountability of public officials?”
Economic and Political Weekly, Mumbai, Vol. 43 (42).
Aiyar, Y., S. K. Mehta and S. Samji (2013): India: Implementing Social Audits, in K. Subarrao et al. (2013): Public Works as a Safety Net: Design, Evidence and Implementation’, Washington DC: The World Bank, Chapter 11, pp. 249-68.
Alatas, V., L. Cameron, A. Chaudhuri, N. Erkal and L. Gangadharan (2009), “Gender, culture and corruption: Insights from an experimental analysis,” Southern Economic Journal, 75(3): 663–680. Alderman, H., P.A. Chiappori., L. Haddad, J. Hoddinott, S.M.R. Kanbur (1995), “Unitary versus collective household models: Time to shift the burden of proof?” World Bank Research Observer, 10 (1): 1- 19.
Alolo, N. A. (2006), “Gendering public sector corruption: Are men from Mars and women from Venus where this vice is concerned?” Paper presented at the PSA Women and Politics Conference, University of Edinburgh.
Ban, R. and V. Rao (2008), “Tokenism or agency? The impact of women’s reservations on panchayats in south India.” Economic Development and Cultural Change, 56: 501-530.
Bardhan, P., D. Mookherjee and M. P. Torrado (2010), “Impact of political reservations in West Bengal local governments on anti-poverty targeting,” Journal of Globalization and Development, Vol. 1 (1).
Bardhan, P. and D. Mookherjee (2012), “Political clientelism and capture: Theory and Evidence from West Bengal, India,” working paper, Boston University.
Beaman, L., R. Chattopadhyay, E. Duflo, R. Pande and P. Topalova (2009), “Powerful women: Does exposure reduce bias?” Quarterly Journal of Economics, 124(4):, 1497-1540
Booth, A. L. and Nolen, P (2012), “Gender differences in risk behaviour: Does nurture matter?”
Economic Journal, 122(558): F56-F78.
Branisa, B and M. Ziegler (2010), “Reexamining the link between gender and corruption: The role of social institutions," Poverty, Equity and Growth - Discussion Papers 24, Courant Research Centre PEG.
Chattopadhyay, R. and E. Duflo (2004), “Women as policy makers: Evidence from a randomized policy experiment in India,” Econometrica, 72(5): 1409-43.
Cheung, A. and R. Hernández-Julián (2006), “Gender and corruption: A panel data analysis,” Available at SSRN: http://ssrn.com/abstract=691468
Dollar, D, R. Fisman and R. Gatti (2001), “Are women really the ‘fairer’ sex? Corruption and women in government,” Journal of Economic Behavior and Organization, 46(4):423–429.
Eckel, C. and P. Grossman (2008), “Men, women and risk aversion: Experimental evidence,”
Handbook of Experimental Economics Results, Chapter 13, Volume 1.
Ferraz, C. and F. Finan (2011), “Electoral accountability and corruption: Evidence from the audits of local governments,” American Economic Review, forthcoming.
Fletschner, D., C. L. Anderson and A. Cullen (2010), “Are women as likely to take risks and compete? Behavioural findings from Vietnam,” Journal of Development Studies, 46(8): 1459-79. Mansuri, G. and V. Rao (2012), “Localizing Development: Does Participation Work?” World Bank
Policy Research Report.
Transparency International (2012), Corruption perceptions index, 2012.
Page, S. E. (2007), The Difference: How the Power of Diversity Creates Better Groups, Firms, Schools and Societies, Princeton University Press.
18
Rajaraman, I. and M. Gupta (2012), “Public Expenditure Choices and Gender Quotas,” Indian Growth
and Development Review, forthcoming.
Swamy, A., S. Knack, Y. Lee and O. Azfar (2001), “Gender and corruption,” Journal of Development
Economics, 64(1): 25 – 55.
World Bank (2012), “World development report: Gender equality and development,” Washington DC.
19
Table 1: Village level characteristics by reservation status of gram panchayat
Note: Standard errors in parentheses. ***significant at 1% ** 5% and *10%.
1, 2, 3 and 4: 1= facility available, 2=facility not available; + census data missing for 4 GPs which we were unable to match with the census.
(1) Unreserved (2) Reserved GP (2) – (1) Difference Village characteristics+ N=172 N=124
Persons per hectare of village area 3.55 3.26 -0.30
(0.289) (0.327) (0.439)
Number of primary schools 4.58 3.66 -0.92**
(0.300) (0.301) (0.436)
Number of middle schools 1.54 1.41 -0.13
(0.154) (0.175) (0.235)
Number of senior secondary schools 0.95 0.77 -0.18
(0.107) (0.114) (0.159)
Number of primary health centers 0.28 (0.034) 0.23 (0.038) -0.05 (0.052) Drinking water 0.99 (0.006) 0.99 (0.008) -0.00 (0.010) Tap water1 1.20 (0.034) 1.20 (0.040) -0.00 (0.052) Tube well2 1.43 (0.051) 1.38 (0.063) -0.05 (0.081) Hand pump3 1.03 (0.016) 1.01 (0.018) -0.03 (0.025)
Number of post offices 0.88
(0.028)
0.82 (0.036)
-0.06 (0.045)
Approach road is paved4 1.10
(0.025)
1.16 (0.035)
0.06 (0.042) Proportion of cultivated area which is irrigated 0.28
(0.020)
0.24 (0.022)
-0.04 (0.030)
Distance to nearest town (kms.) 29.69
(1.512)
31.31 (1.855)
1.62 (2.377)