de !"#$%&'()%*+,-',('./'(./',01(%),2.%'$.'),'*,3'**(')4
PSL Research University
Préparée à !"#$%&'()%*+,-.(%)-Dauphine
/01-0234305,6#,7#89:;Soutenue le
par
!cole Doctorale de Dauphine < ED 543
SpécialitéDirigée par
Trois Essais en Private Equity
11.12.2018
Sara AIN TOMMAR
Serge DAROLLES
Université Paris-Dauphine M. Serge DAROLLES Université Lyon 3 Jean-François GAJEWSKI José-Miguel GASPAR ESSEC Business SchoolMme. Edith GINGLINGER Université Paris-Dauphine
M. Ludovic PHALIPPOU
Saïd Business School - University of Oxford
Sciences de gestion Directeur de thèse Rapporteur Rapporteur Présidente du jury Membre du jury
!"#$%&'()%*+, -.(%)-/.012%$', $"'$*'$3, 34$$'(, .050$', .11(46.*%4$7, $%, %81(46.*%4$, .09, 41%$%4$), émises dans cette thèse ; elles doivent être considérées comme propres à leur auteur.
i
Contents
INTRODUCTION GENERALE ... 1
1. DEVELOPPEMENT DES MARCHES PRIVES ET EVOLUTIONS RECENTES ... 3
2. AVANCEES DE RECHERCHE EN MATIERE DE PRIVATE EQUITY ... 5
3. PRESENTATION DES TRAVAUX DE RECHERCHE ... 6
CHAPTER 1 ... 12
ON THE PERFORMANCE OF LISTED PRIVATE EQUITY: HOW DOES THE TRANSITION TO PUBLIC EQUITY MARKETS IMPACT INVESTMENT OUTCOMES? ... 12
1.1. INTRODUCTION ... 13
1.2. BACKGROUND ... 17
1.3. DATA ... 20
1.3.1. Data issues in private equity research ... 20
1.3.2. Sample construction ... 21
1.3.3. Variable definition and descriptive statistics ... 24
1.4. METHODOLOGY ... 27
1.4.1. The evaluation problem and estimation techniques ... 27
1.4.1.1. Propensity score matching ... 27
1.4.1.2. Extended linear regressions ... 31
1.4.2. Theoretical explanations of why firms go public and definition of the instrumental and matching variables ... 32
ii
1.5. ... 35
1.5.1. Private equity performance and listing ... 35
1.5.2. Listed private equity performance and liquidity ... 37
1.6. CONCLUSION ... 38
1.7. REFERENCES FOR CHAPTER 1 ... 39
1.8. TABLES AND FIGURES ... 44
1.9. ADDITIONAL SUPPORTING INFORMATION ... 57
CHAPTER 2 ... 67
IS DESTINY WORTH THE DISTANCE? ON PRIVATE EQUITY IN EMERGING MARKETS ... 67
2.1. INTRODUCTION ... 68
2.2. BACKGROUND ... 72
2.2.1. Emerging markets and Private Equity performance ... 72
2.2.2. Geography, Culture, and Private Equity performance ... 73
2.2.2.1. Investment performance and geographical influences ... 73
2.2.2.2. Investment performance and cultural influences ... 74
2.3. DATA AND METHODOLOGY ... 74
2.3.1. Data and variable definitions ... 74
2.3.2. Descriptive statistics ... 78
2.3.3. A Multilevel linear model... 80
iii
2.4.1. The geography of private equity performance ... 82
2.4.1.1. Are there any crossed geographical and cultural effects between the GPs and the investment countries? ... 83
2.4.1.2. Does change in investment style when targeting emerging markets affect performance? ... 84
2.4.2. The geography of private equity performance and return predictability ... 85
2.5. CONCLUSION ... 87
2.6. REFERENCES FOR CHAPTER 2 ... 88
2.7. TABLES AND FIGURES ... 92
CHAPTER 3 ... 110
WHAT DOES THE INDIVIDUAL MOBILITY OF PRIVATE EQUITY PROFESSIONALS TELL US ABOUT PERFORMANCE? ... 110
3.1.INTRODUCTION ... 111
3.2.DATA AND DESCRIPTIVE STATISTICS ... 113
3.2.1. Sample description and variable definition ... 113
3.2.2. Descriptive statistics ... 118
3.3.EMPIRICAL RESULTS ... 119
3.3.1. The effect of mobility on performance ... 119
3.3.2. Does mobility affect performance differently across professional ranks? ... 120
3.3.3. Mobility and deal - fund lifecycles... 121
iv
... 124
3.5.REFERENCES FOR CHAPTER 3 ... 125
3.6.TABLES AND FIGURES ... 127
1
!"#$%&'(#)%"*+,",$-./
Le private equity est un investissement de long terme dans des entreprises privées, destiné à subvenir aux besoins de financement en capital de ces entreprises et susceptibles de réaliser par la même occasion des rendements sur investissement intéressants pour leurs investisseurs. Le private equity est souvent organisé en structures à responsabilité limitée (dites limited liability
partnerships), où les investisseurs, souvent institutionnels (dits limited partners ou LPs),
)"'$:.:'$*,;,&'()'(,3'),5.1%*.09,;,0$,40,1<0)%'0(),fonds gérés par une société de gestion (dite
general partner ou GP), dont la mission est de rentabiliser les fonds de ces investisseurs sur le
long terme. La structure de rémunération du GP comprend des frais de gestion (souvent 1 à 2% des fonds sous gestion), et une prime de performance (dite carried interest), qui revient au GP 3=), <4(), >0"%<, .**'%$*, <', *.09, 3', ('$*.6%<%*+, 8inimum exigé par les investisseurs (hurdle rate ? )40&'$*, @ABC, !., 1(%8', 3', 1'(D4(8.$5', ')*, 3"'$&%(4$, EFA, 3'), 1(430%*), 3', 5'))%4$, 3'), investissements du fonds, après retour des fonds initiaux. La durée dont dispose le GP pour ('$*.6%<%)'(, <'), D4$3), '$:.:+), 1.(, <'), !-), ')*, 3"'$&%(4$, GF, .$)C, H'**', 1+(%43', 54((')14$3, ;, <., 30(+',3',&%',<+:.<',30,D4$3),3"%$&')*%))'8'$*,'*,1'0*,'95'1*%4$$'<<'8ent être étendue de 2 à 4 ans supplémentaires. Le private equity est souvent entendu à deux catégories pricncipales 3"%$&')*%))'8'$* : les leveraged buyouts ou LBO, qui sont des prises de participation par des fonds 3"%$&')*%))'8'$*,3.$),3'),'$*('1(%)'),8.tures, souvent moyennant un fort effet de levier ; et le
venture capital ou VC, qui correspond à des prises de participation minoritaires dans des
entreprises très jeunes et plus risquées.
Jensen (1989) avait prédit que les LBO seraient la forme dominante des organisations futures. Il .&.%*,)40*'$0,>0', 5'**', D4(8', 3".5>0%)%*%4$,)'(.%*,<', 843=<', 3".DD.%('),3', (+D+('$5', 30, private
equity moderne, où les sociétés de private equity créeraient de la valeur en apportant leur
savoir-faire en matière de finances, d"41+(.*%4$),'*,3',:40&'($.$5',.09,'$*('1(%)'),3.$),<')>0'<<'),'<<'), investissent ; et où elles réussiraient, ce faisant, grâce à leur système de rémunération basé sur la performance, une optimisation des coûts <%+',;,<"0*%<%).*%4$,3' <"effet de levier et à un système fiscal avantageux. Selon Jensen (1989), ces structures 6+$+D%5%.$*, 3"0$, .5*%4$$.(%.*,
2
8.I4(%*.%('8'$*,0$%>0','*,3"0$,.55481.:$'8'$*,)*(.*+:%>0'7,)4$*,)01+(%'0('),.09,'$*('1(%)'), cotées en bourse, caractérisées par une faible gouvernance et un actionnariat dispersé. Ce 14)*0<.*7, .<4(), 54$)%3+(+, 24(), 54$*'9*'7, ')*, ('8%), .0I40(3"20%, .0, 5'$*(', 30, 3+6.*, 3.$), 0$, environnement marqué par le manque de dynamisme des marchés boursiers, une baisse des introductions en bourse et une diminution accrue des sociétés cotées (Doidge et al., 2018).
Le marché du private equity ')*,')*%8+,.0I40(3"20%,;,plus de 2.8 billions de dollars1. Quoique la
taille du marché reste faible comparée à la valeur des marchés boursiers dans le monde (estimée à 40 billions2), le priv.*', '>0%*J, 54$*%$0', 3', 6+$+D%5%'(, 3"0$, %$*+(K*, particulier de la part des
investisseurs, pour des raisons liées entre-autres (i) à des coûts de transaction de plus en plus élevés sur les marchés boursiers du fait de leur concentration accrue ? suite du déclin du nombre de sociétés cotées ?, (ii) à un manque de diversification sectorielle des indices de marché, combinée à leur volatilité plus importante, et (iii) au court-termisme qui caractérise les marchés boursiers et qui est incompatible avec les objectiD), '*, <'), 24(%L4$), 3"%$&')*%))'8'$*, 3'), investisseurs des marchés privés (Phalippou, 2018).
Cette thèse aborde ainsi des thématiques qui caractérisent les mutations que connait .0I40(3"20% le marché du private equity : une recherche de liquidité relative, une quête de rendements supérieurs dans de nouveaux marchés et une stabilité des ressources humaines qui restent un vecteur de communication important des discours de levées de fonds du private equity.
Il convient 3".64(3 de décrire le contexte de développement des marchés privés et ses évolutions récentes, de dresser les avancées de recherche en matière de private equity7,.&.$*,3"'914)'(,<'), trois pistes de recherche développées dans ce manuscrit.
1 Données Preqin.
3
1.
0,1/.%22/3/"#*&/4*3-$(5,4*2$)1,4*/#*,1%.'#)%"4*$,(/"#/4*
!"+largissement de la base des investisseurs du private equity aux investisseurs institutionnels, en plus des family offices et des riches individus (High Net Worth Individuals), conjugué au développement des méga-fonds, témoigne d0, )055=), >0', 54$$.%*, <"%$30)*(%', 8.<:(+, )., *.%<<', relativement faible comparée aux marchés boursiers. Selon les statistiques de la banque mondiale, il y aurait 43.036 entreprises intérieures (i.e. nationales) cotées en bourse dans le monde à fin 2017, alors que (%'$,>0"'$,M(.$5'7,<',$486(',3"'$*('1(%)'),1(%&+'),')*,3',<"4(3(',3', N,8%<<%4$)C,H"')*,3%(',<',(O<',>0',1'0*,.&4%(,<' private equity dans la réalisation du potentiel de croissance des entreprises privées. De plus, aux Etats-Unis, le nombre moyen de créations 3"'$*('1(%)'),1.(,.$,)'<4$,<'),3'($%'(),52%DD('),3',<.,PQR,SP8.<<,Q0)%$')),R38%$%)*(.*%4$7,EFGTB, ')*,3',<"4(3(',3',UGUCFFFC,!.,8K8',.$$+'7,'$&%(4$,GCVFF,'$*('1(%)'),4$*,6+$+D%5%+,3"0$,1('8%'(, financement de la part des fonds de private equity selon les données Preqin. Bien que 0,4% seulement des start-ups soient financées par les fonds de private equity, la recherche académique .,84$*(+,>0',5'),3'($%'(),54$*(%60'$*,3',1<0),3',N,;,U,D4%),;,<"%$$4&.*%4$,3'),'$*('1(%)'),>0',<'), ressources propres de ces dernières en R&D (Kortum et Lerner, 2000), et que plus de 50% des introductions en bourse étaient initiées par des fonds de private equity (Kaplan et Lerner, 2010).
Plusieurs changements réglementaires au cours des années 2000, notamment les lois
Sarbanes-Oxley en 2002 ou le Global Settlement en 2003, ont attisé le débat <"%$*+(K*,3',<.,54*.*%4$,140(,0$',
entreprise privée. Certaines ont argué que ces lois augmenteraient les coûts des entreprises 54*+'), '*, )'(.%'$*, 3'), D.5*'0(), 3+*'(8%$.$*), 3', <".<<4$:'8'$*, 3', <"W:', 84J'$, 3', <"'$*('1(%)', privée3. Les travaux académiques récents ont pourtant montré que le manque de dynamisme des
marchés publics était dû au progrès technologique (Gao et al., 2013), et que les changements (+:<'8'$*.%('),.&.%'$*,1'0,40,1.),3"%81.5*,)0(,<.,520*',30,$486(',3',)45%+*+),cotées (Doidge et
al., 2017).
3 X4%(,;,*%*(',3"'9'81<'Y,Z[2',3'8%)',4D,*2',\-]7,.$3,%3'.),4$,24^,*4,('&%&',%*_7,[2',`.<<,P*(''*,a40($.<7,EV,I0%$, 2010.
4
Ces transformations sont concomitantes aux mutations qui ont récemment marqué le private
equityC,/".64(37,<.,520*',3'),8.(52+),640()%'(),30(.$*,<.,5(%)',D%$.$5%=(',3',EFF@, a provoqué
une augmentation mécanique du niveau des allocations au private equity, au-delà des limites réglementaires. Cette forte demande, dite effet dénominateur, a provoqué des ventes forcées de la part des investisseurs en fonds de private equityC, H'5%, ., 54$*(%60+, .0, 3+&'<411'8'$*, 3"0$, marché secondaire de parts de fonds (Kleymenova et al. (2012), Bollen et Sensoy (2015), Nadauld
et al. (2017) et Albuquerque et al. (2017)).
Ensuite, les années récentes sont marquées par une maturité accrue des marchés développés, où <'), 4114(*0$%*+), 3"%$&')*%))'8'$*, )', D4$*, 1<0), (.(')7, '$:'$3(.$*, 0$', )1+5%.<%).*%4$, accrue (Gejadze et al., 2017, Hochberg et al., 2014), une concurrence plus importante entre fonds sur les deals disponibles et une valorisation plus élevée de ces derniers (Braun et Stoff, 2016). Les années récentes ont ainsi vu un nombre accru 3"%$&')*%))'0(), )', *40($'(, &'(), <'), 8.(52+), émergents, attirés par les perspectives de croissance de leur économie souvent sous-financés4 et
par une volatilité des rendements du private equity moins importante que celle des marchés développés (Lerner, 2017).
Enfin, comme le private equity est une industrie à forte intensité en capital humain, où les qualités et les qualifications des équipes de gestion sont largement mises en avant dans les prospectus de levées de fonds auprès des investisseurs, ces derniers ont exigé des clauses dites de keymen
provisions ou keymen clauses dans les contrats de gestion, qui assurent une stabilité des équipes
de gestion tout au long de la vie du fonds ; et les autorisent à sortir de leur investissement voire 3%))403(',<',D4$3),'$,5.),3',3+1.(*,3',1'()4$$'),5<+)C,b$,<".6)'$5',3"0$,6enchmark de mobilité des professionnels du private equity, et dans un contexte où les firmes de private equity )".((.52'$*,<'),8.$.:'()7,'*,4c,beaucoup 3"'$*(','<<'),4$*,&0,<',3+1.(*,3"0$,$486(',54$)+>0'$*, de leurs personnels5, l"%81.5*,>0',140((.%'$*,.&4%(,5'),3+1.(*),)0(,<'),1'(D4(8.$5'),.**'$30'),
4 Global Economic Prospects, The Turning of the Tide? The World Bank, June 2018
5
des fonds, et les relations futures des LPs avec leurs GPs est au centre des préoccupations des investisseurs.
Tous ces éléments constituent un terrain de recherche riche sur la pertinence du private equity 5488', &'5*'0(, 3', D%$.$5'8'$*, 3', <"'$*('1(%)', 1(%&+'7, '*, 5488', )40(5', 3', 3%&'()%D%5.*%4$, ;, rendement supérieur pour les investisseurs.
2.
61-"(,/4*&/*$/(5/$(5/*/"*3-#)7$/*&/*!"#$%&'(')*#&+
H4$*(.%('8'$*,;,3".0*('),5<.))'),3".5*%D)7,<',private equity $"')*,1.),)408%),.09,3%)14)%*%4$),3', <"\$&')*8'$*,H481.$J,R5*,3',GfUF7,5',>0%,<"'9'81*',3'),46<%:.*%4$),3"%$D4(8.*%4$,.09,.0*4(%*+), de marché. La problématique de la disponibilité de données a ainsi longtemps limité la recherche empirique en private equity6, ).$),D('%$'(,<"%$*+(K*,30,*(.&.%<,*2+4(%>0',>0%,J,*(40&.%*,0$,5.3(',
3".$.<J)',%3+.<,;,<"+*03',3',*2+8.*%>0'),%814(*.$*'),'$,corporate finance, notamment la théorie 3'),54$*(.*)7,<".)J8+*(%',3"%$D4(8.*%4$,'*,<"%$&')*%))'8'$*,en environnement incertainC,,H',$"')*, >0".&'5,<".((%&+',3'),D4$3),3',1'$)%4$,106<%5),3.$),<',*40(,3',*.6<',3'),%$&')*%))'0(),30,private
equity >0"4$*,+8'(:+'),<'),1('8%=('),34$$+')C,P408%),.0,FOIA ! Freedom Of Information Act, qui
confère aux contribuables des fonds de p'$)%4$,<',3(4%*,;,<"%$D4(8.*%4$,)0(,<'),%$&')*%))'8'$*), 3',5'),3'($%'()7,<'),:+(.$*),3',D4$3),-b,4$*,+*+,3.$),<"46<%:.*%4$,3',54880$%>0'(,106<%>0'8'$*, <'0(), 1'(D4(8.$5')C, !"+&4<0*%4$, *'52$4<4:%>0', '*, <', 3+&'<411'8'$*, 3'), 8+*243'), 3', communication des firmes de private equity, qui se signalent à leurs investisseurs notamment via 3'),1<.*'D4(8'),5488'(5%.<'),3',<'&+',3',D4$3)7,.,'$)0%*',54$*(%60+,;,<"+8'(:'$5',3',$40&'<<'), 6.)'),3',34$$+'),>0%,4$*,('$30,14))%6<',3".0*('),*(.&.09,3',('52'(52'C,b$D%$7,<.,)412%)tication des investisseurs du private equity '*, <".<<45.*%4$, .55(0', 3', 5.1%*.09 des investisseurs à cette 5<.))',3".5*%D,.,$+5'))%*+,<.,8%)','$,1<.5',3',3%)14)%*%D),3',)0%&%,%$*'($'),3',<'0(),%$&')*%))'8'$*)7, et une formalisation des reportings dont leur font part leurs managers. Cette activité, externalisée 3.$),0$,1('8%'(,*'81)7,.,1'(8%),+:.<'8'$*,<"46*'$*%4$,3"0$,144<,3',34$$+'),1(4&'$.$*,3'),!-)7,
6!'), 34$$+'), 3%)14$%6<'), ;, 5', )*.3', )', <%8%*.%'$*, .09, 1(4)1'5*0), 3"%$*(4305*%4$, '$, 640()', '*, ;, 3".0*('), documents (le S1 statement par exemple) des entreprises backées par des fonds de private equity qui devenaient cotées en bourse.
6
relativement de meilleure qualité comme elles ne souffriraient pas des biais de sélection ou de surestimation dont pourraient souffrir les données provenant des GPs7.
De nombreuses études se sont alors intéressées à la qualité des données disponibles à la recherche en private equity : Kaplan et al. (2002), Maats et al. (2011), Stücke (2011), Harris et al. (2014), etc. Ces études sont unanimes sur la fragilité des premières bases (les ensembles de 34$$+'), 54$$0'), .0I40(3"20%, )40), <', $48, Thomson Venture Economics) et arrivent à la conclusion principale que les bases plus récentes développées à partir des données des GPs (Preqin, Pitchbook) et celles développées à partir des données des LPs (Burgiss, PCRI) ou encore des bases mixtes, provenant des deux (comme Cambridge Associates), sont de meilleure qualité que Thomson Venture Economics.
R0I40(3"20%7, 6%'$, >0', <., 540&'(*0(', 3', 5'), 6.)'), $', )4%*, 1.), '$54(', 41*%8.<', '*, >0"'<<'), 54$*%$0'$*,3',1(+)'$*'(,5'(*.%$'),<%8%*')7,<'0(,3%)14$%6%<%*+,.%$)%,>0',<',3+&'<411'8'$*,3".0*('), initiatives, telles e-Front, assurent la réplicabilité des travaux de recherche existants et permettent le développement de pistes de recherche supplémentaires.
3.
8$,4/"#-#)%"*&/4*#$-1-'9*&/*$/(5/$(5/
Le développement des marchés privés en général et du private equity en particulier, dans un contexte marqué par un manque de dynamisme des marchés publiques, soulève la question naturelle de la pertinence de ces investissements et la portée réelle de leur valeur ajoutée. Notre analyse des évolutions récentes du marché du private equity et nos lectures des travaux conduits en la matière $40),.,1'(8%),3"%3'$*%D%'(,0$,.$:<',3".$.<J)',%814(*.$*,$4$,'$54(' suffisamment exploré et susceptible de contribuer à la littérature existante. Trois pistes de réflexion %814(*.$*'), 4$*, )0)5%*+, $4*(', %$*+(K*C, /".64(37, $40), $40), %$*+('))4$), ;, <., >0'stion de la
7 Brown et al. (2016) montrent que les gérants de fonds sont conservateurs dans leur reportings de 1'(D4(8.$5', 3.$), 0$, )405%, 3"'$*('*%'$, 3', <'0(, (+10*.*%on auprès de leurs investisseurs. Barber et Yasuda (2017) trouvent que les performances intermédiaires des fonds sont déterminantes dans la manière avec laquelle les gérants de fonds communiquent sur leurs performances à leurs investisseurs pour les levées de fonds futures, et que leurs comportements varient en fonction de leurs rangs et de leurs réputations.
7
('52'(52', 3"0$', g quasi-liquidité » par les fonds de private equity et posons la question de la pertinence de ce nouveau business-modèle en termes de rendements pour les investisseurs (chapitre 1). Ensuite, nous nous interrogeons sur la qualité de la diversification géographique des gérants de fonds de private equity. Nous étudions alors la question importante de la performance des investissements sur les marchés émergents et comment les proximités géographique et culturelle sont des facteurs déterminants de la réussite de ces investissements (chapitre 2). Enfin, au-delà des mutations organisationnelles et de marché, nous analysons en dernier lieu si la mobilité individuelle des professionnels du private equity est un enjeu pour les rendements futurs des fonds et les transactions effectuées par ces fonds (chapitre 3).
Cette thèse est ainsi articulée autour de ces trois thèmes de réflexion. Elle cherche à établir si ces nouvelles tendances changent fondamentalement le constat par lequel le private equity continue 3"4DD(%(,3'),4114(*0$%*+),3"%$&')*%))'8'$*,;,('$3'8'$*),)01+(%'0(),.09,.0*('),5<.))'),3".5*%D). Cette idée est largement débattue 3.$), <., <%**+(.*0('7, 4c, <".6)'$5', 3"0$, 54$)'$)0), )0(, 0$, 6'$528.(h, 3".$.<J)', 54880$, '*, <., )'$)%6%<%*+, 3'), ('ndements aux choix des mesures de performance et des méthodes de comparaison (entre autres, Harris, Jenckinson et Kaplan (2014), Stücke (2011) et Phalippou (2014)) reste un problème. Soulignons à ce titre que si cette 1(46<+8.*%>0',$"')*,1.),$4*(',1(%)8',3".$.<J)',1(%$5%1.<,40,'$54(',84%$),>0',$40),52'(52%4$), à la résoudre, elle reste toutefois une question sous-jacente aux pistes de recherches développées ici. Nous avons essayé de la satisfaire au mieux en répliquant nos tests et spécifications autant que 14))%6<',)0(,1<0)%'0(),8')0('),'*,6'$528.(h),3',1'(D4(8.$5'7,.D%$,3".))0('(,;,8%$%8.,0$', consistance des résultats et un spectre de comparaison plus large avec la littérature existante.
!',1('8%'(,52.1%*(',3',5'**',*2=)',)"%$*'((4:',)0(,<"%81.5*,sur la performance 3',<"%$*(4305*%4$, en bourse de véhicules de private equity (private equity listé), en le comparant à celle des structures opérationnelles traditionnelles privées (private equity traditionnel ou standard). Comme exposé précédemment, le private equity standard consiste en la mise en commun de fonds <'&+),.01(=),3"%$&')*%))'0(),1(%$5%1.<'8'$*,%$)*%*0*%4$$'<),3.$),0$',)*(05*0(',;,(')14$).6%<%*+, <%8%*+', S%C'C, D4$3, 3"%$&')*%))'8'$*B, :+(+', 1.(, 0$', )45%+*+, 3', :')*%4$, 34$*, <', 60*, ')*, 3' faire fructifier ces fonds sur le long terme à travers des investissements dans des entreprises privées.
8
On parle de private equity listé <4()>0', <"0$, 40, 1<0)%'0(), 3'), *(4%), .5*'0(), 30, private equity
standard D.%*, 0$, .11'<, 106<%5, ;, <"+1.(:$'C, b$, 3+540<'nt alors trois structures ou formes
organisationnelles génériques de listing : (i) le private equity listé direct7,4c,<"'$*%*+,%$*(430%*','$, 640()', ')*, <', D4$3, 3"%$&')*%))'8'$*, <0%-même, offrant ainsi à ses actionnaires une exposition directe aux entreprises en portefeuille ; (ii) le private equity listé indirect7,4c,<"'$*%*+,%$*(430%*','$, bourse est « <"%$&')*%))'0( i7, '$, <"4550(('$5', )40), D4(8', 3"0$, D4$3, 3', D4$3)7, 4DD(.$*, ;, )'), actionnaires une exposition au portefeuille de fonds sous-jacents ? et indirectement, une exposition à leurs investissements respectifs ? ; et (iii) la société de gestion listée ou manager
listé7, 4c, <"'$*%*+, %$*(430%*', '$, 640()', ')*, <., )45%+*+, 3', :')*%4$7, .&'5, 0$', '914)%*%4$, 140(, <'),
actionnaires aux revenus (frais de gestion) sur les fonds de private equity gérés.
La littérature sur les introductions en bourse met en évidence que la transition vers les marchés publics détériore la performance opérationnelle des firmes et leurs performances à long terme (Ritter (1991), Jain et Kini (1994), Loughran et Ritter (1995)), et altère leur réactivité aux 4114(*0$%*+),3"%$&')*%))'8'$*,SAsker, Farre-Mensa et Ljungqvist, 2015). Dans un marché estimé à 2,8 billions de dollars8, le private equity listé 54$)*%*0',GFA,3'),.5*%D),)40),:')*%4$,3',<"'nsemble
3', <., 5<.))', 3".5*%D)7, 4c, <', private equity indirect par exemple gère près de 38% des fonds de
private equity traditionnels selon nos estimations9. Au moment où de plus en plus de structures
3', 1(%&.*', '>0%*J, 3'&%'$$'$*, 54*+'), '$, 640()'7, 1'0, 3"+*03es se sont intéressées aux conséquences que peut avoir cette transition vers les marchés publics sur les performances des investissements entrepris, notamment comparées à celles du private equity traditionnel.
Avec un échantillon exhaustif et représentatiD,3',<"0$%&'(),30,private equity listé, nos résultats 84$*('$*,>0',<"%$*(4305*%4$,'$,640()',%$30%*,0$',3%8%$0*%4$,)%:$%D%5.*%&',30,*.09,3',)4(*%'10 des
8 Données Preqin, fin 2017.
9 Dans leur étude, Jegadeesh et al. (2015) rapportent 29% de fonds de private equity traditionnels investis par des fonds de fonds listés.
10 !', *.09, 3', )4(*%', ')*, 3+D%$%, 5488', +*.$*, <', $486(', 3"%$&')*%))'8'$*), <%>0%3+), .&'5, )055=), (.114(*+, .0, $486(',*4*.<,3"%$&')*%))'8'$*)7,$4(8.<%)+C,/.$),<.,1(4D'))%4$7,0$',)4(*%',(+0))%',')*,5'<<',>0%,)',D.%*,1.(,&4%', 3"\-], 407, 3.$), 0$', moindre mesure, via une vente secondaire à un acquéreur stratégique, souvent une '$*('1(%)', 41+(.$*, 3.$), <', 8K8', )'5*'0(, >0', <"'$*('1(%)', 3+*'$0', 1.(, <', D4$3, 3"%$&')*%))'8'$*C, !., &'$*', secondaire est devenue de plus en plus pertinente comme moyen de sortie réussi sur les dernières années vu
9
véhicules listés (-17%), combinée à une probabilité significativement réduite (-7%) de réaliser une sortie réussie par entreprise investie. De plus, alors que le private equity listé semble délivrer de meilleurs rendements que le private equity traditionnel en termes de multiples 3"%$&')*%))'8'$*),SjE,5'$*%8'),1.(,34<<.(,%$&')*%B7,5'**',*'$3.$5',)"%$&'()' une fois ajustée des ('$3'8'$*),3',<"%$3%5',3',(+D+('$5',30,8.(52+11 (+1% de rendement supérieur ? par rapport à
<"%$3%5',3',8.(52+,? est significativement associé à une perte de près de 6 points de base chez les véhicules listés comparés au private equity traditionnel). Ces résultats sont compatibles avec la littérature sur les introductions en bourse et la performance opérationnelle des firmes. Une ou plusieurs explications possibles peuvent être liées aux conflits qui suivent le changement de structure d',1(41(%+*+,3"0$','$*('1(%)',)0%*',;,)4$,%$*(4305*%4$,'$,640()'7,$4*.88'$*,0$,short
termism +8.$.$*,3"0$,$%&'.0,)40)-41*%8.<,3"%$&')*%))'8'$*,;,<4$:,*'(8'7,30,D.%*,3',<"%$*'(.5*%4$,
des décisions managériales avec les marchés financiers (Stein (1989), Shleifer et Vishny (1991), Graham et al. (2005), Asker et al. (2015)B,'*,30,54$D<%*,3"%$*+(K*,'$*(',<'),%$&')*%))'0(),S;,24(%L4$, 3"%$&')*%))'8'$*, <4$:, *'(8'B, '*, <'), $40&'.09, .5*%4$$.%('), S;, 24(%L4$, 3"%$&')*%))'8'$*, 540(*, terme) du private equity listé. Par conséquent, les managers du private equity listé auraient tendance à avoir un comportement de « collecte i,3".5*%D),>0%7,&%.,<'),D(.%),3',:')*%4$7,)'(&%(.%*, leurs nouveaux actionnaires et moins leurs investisseurs à long terme pour qui les rendements à long terme sont détériorés. Une première confirmation de cette hypothèse est soutenue par une relation positive et significative entre les performances constatées du private equity listé et les périodes de détention étendue de leurs investissements. Ces explications sont autant des pistes de recherche intéressantes possibles.
!', 3'09%=8', 52.1%*(', 3', 5'**', *2=)', )"%$*+('))', .09, %81<%5.*%4$), 3', <., 3%&'()%D%5.*%4$, géographique du private equity sur les marchés émergents. Dans un contexte marqué par des rendements ralentis sur les marchés développés (Harris et al., 2014), de plus en plus de firmes de private equity se sont orientées vers les marchés émergents à la recherche de performances supérieures. Nous examinons alors si les rendements des firmes de private equity basées dans
les gains fiscaux qui y sont rattachés et le nombre décroissant de sorties sur les marchés publics (Karolyi et Kim (2017), Doidge et al. (2018)). Nous considérons ainsi les deux dans le calcul des taux de sortie.
11 Cette 8')0('7, 3%*', -kb, S-06<%5, k.(h'*, b>0%&.<'$*B7, 5481.(', <', ('$3'8'$*, 3"0$, %$&')*%))'8'$*, -b, ;, 5', >0".0(.%*,+*+,<',('$3'8'$*,)0(,<',8K8',%$&')*%))'8'$*,3.$),0$,%$3%5',3',8.(52+C,
10
des marchés développés (notées DMPE ? Developed Markets Private Equity) sont significativement supérieurs aux rendements des firmes de private equity opérant uniquement dans les marchés émergents (notées EMPE ? Emerging Markets Private Equity), et explorons particulièrement si les proximités géographique et culturelle sont déterminantes pour les 1'(D4(8.$5'), (+.<%)+')C, b$, 'DD'*7, <., <%**+(.*0(', )0(, <"%$&')*%))'8'$*, %$*'($.tional a mis en <"+&%3'$5',<"%814(*.$5',3',<.,1(49%8%*+,:+4:(.12%>0',SCoval and Moskowitz (1999, 2001), Choe et al. (2005), Teo (2009)) et des facteurs culturels (Licht, Goldschmidt, and Schwartz (2005, 2007), Hau (2005), Teo (2009)) sur la réussite de ces investissements.
Sur un échantillon exhaustif de transactions de firmes DMPE et EMPE, couvrant la période 2000-2016, 26 pays émergents et 32 pays développés, nos résultats montrent que les firmes DMPE sous-performent significativement les firmes EMPE. Conformément à la littérature sur la géographie des investissements, nous trouvons une relation négative entre les performances réalisées des firmes DMPE et leur éloignement géographique de leurs cibles12, résultat que
renchérit la relation significativement négative entre ces performances et la différence dans les &.<'0(), 50<*0('<<'), $.*%4$.<'), 3'), 1.J), 3"4(%:%$', 3'), D%(8'), /k-b, '*, 3', <'0(), 5%6<')13. Le
différentiel de performance des firmes DMPE est rattrapé dès lors que celles-ci ont des équipes 3"%$&')*%))'ment et de gestion culturellement plus proches147, '*, >0"'<<'), .5>0%=('$*, 1<0),
3"'91+(%'$5',)0(,5'),8.(52+)C,
12 Nous utilisons une variable catégorique où on classe les investissements des firmes DMPE comme étant locaux (même pays que la firme), frontalier (dans un pays qui partage une frontière terrestre ou maritime avec celui de la firme), ou lointain (ne partageant aucune frontière avec le pays de la firme).
13 La culture nationale est mesu(+',.&'5,<"%$3%5',3',P52^.(*L7,3+&'<411+,1.(,<',843=<',50<*0('<,3',Schwartz (1994, 2004)
14 La proximité culturelle au niveau individuel est mesurée en analysant textuellement les biographies et les noms des professionnels au sein des firmes DMPE intervenant sur les fonds dédiés aux marchés émergents. !".$.<J)',3'),*'9*'),3',6%4:(.12%',.**(%60',0$,)54(',3',1(49%8%*+,50<*0('<<',.09,1(4D'))%4$$'<),)'<4$,>0"%<),.%'$*, eu par le passé des liens avec les pays émergents des cibles (par exemple, études effectuées dans un pays +8'(:'$*,40,'91+(%'$5',1(4D'))%4$$'<<',3.$),5',1.J)BC,!".$.<J)',3'),$48),)',6.)',)0(,<.,<.$:0',5488',&'5*'0(, 50<*0('<,'*,%3'$*%D%',<'0(),(+)4$.$5')7,.D%$,3"+*.6<%(,0$',1(46.6%<%*+,>0',<'),1(4D'))%4$$'<),'$,>0')*%4$,)4%'$*, binationaux ou aient une maitrise des langues officielles ou locales des pays émergents concernés, ce qui procurerait un avantage à leurs firmes.
11
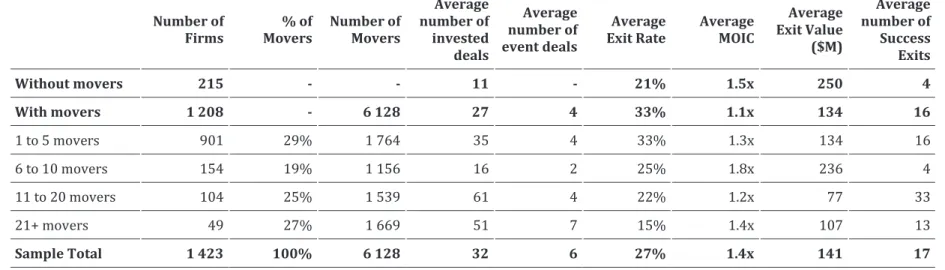
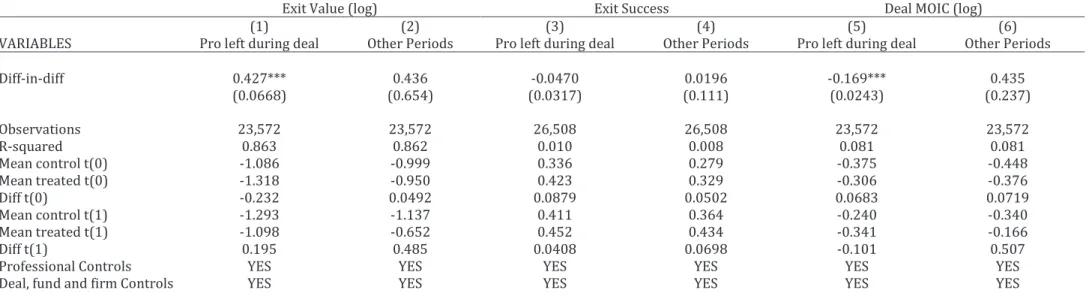
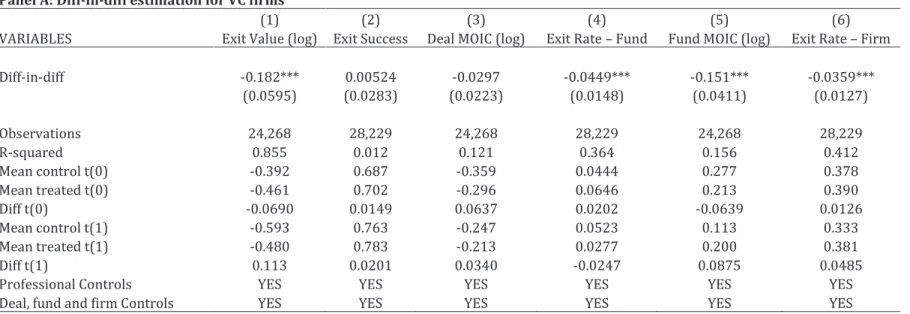
!"+*03', 3', <., 1(49%8%*+, 50<*0('<<', 3'), %$3%&%30), ., D4(*'8'$*, %$)1%(+, <"%3+', 1.(, <.>0'<<', <., performance des investissements en private equity dépendrait également de la qualité des personnes qui les produisent et qui les gèrent. Dans la continuité de ce raisonnement, si les >0.<%*+),3"0$,%$3%&%30,)',('D<=*'$*,)0(,<'),1'(D4(8.$5'),3'),%$&')*%))'8'$*)7,>0".0(.%'$*,+*+,5'), performances sans cet individu ? Nous étudions alors dans le dernier chapitre comment la mobilité des individus dans les firmes de private equity ')*, )0)5'1*%6<', 3".DD'5*'(, <'0(), performances. Avec un échantillon de plus de 9000 professionnels de private equity, nous montrons que le d+1.(*,3"0$,1(4D'))%4$$'<,'$:'$3(',0$',1'(*',3',GU,5'$*%8'),1.(,34<<.(,%$&')*%7, '*,>0',<.,1'(D4(8.$5',')*,1<0),.DD'5*+',>0.$3,%<,)".:%*,3"0$',1'()4$$',5<+7,ou lorsque le départ %$*'(&%'$*,'$,12.)',3"%$&')*%))'8'$*,30,D4$3,'*,<4()>0',<.,846%<%*+,54$5'($',0$,fond de capital-(%)>0'C,b$,0*%<%).$*,0$,843=<',3"')*%8.*%4$,'*,3',)+1.(.*%4$,3"'DD'*),D%9')7,<'),résultats montrent en outre que le capital humain est deux fois plus important que les caractéristiques des firmes de
private equity <4()>0"%<,)".:%*,3"investissements en capital-risque (venture capital), tandis que les
caractéristiques des firmes et des individus partagent quasiment à parts égales le pouvoir explicatif de),('$3'8'$*),<4()>0"%<,)".:%*,3"%$&')*%))'8'$*),'$,5.1%*.<-développement (buyouts).
12
:5-2#/$*;
<"* #5/* 8/$=%$3-"(/* %=* >)4#/&* 8$)1-#/* ?@')#AB* C%D* &%/4*
#5/*#$-"4)#)%"*#%*2'E.)(*/@')#A*3-$F/#4*)32-(#*)"1/4#3/"#*
%'#(%3/4
,
G*
!Abstract
Listed private equity (LPE) refers to publicly-traded investment companies whose activity is to invest in privately-held companies or in traditional private equity funds. The recent years have witnessed a slew of public private equity listings and many investors were offered exposure to traditional private equity investments (TPE) through LPE. While listed private equity and traditional private equity have the same investment universe, we argue that the documented performance of the latter may not pertain to LPE. We build a representative dataset of the LPE universe and compare their performance to TPE. We examine whether index membership is linked to performance. Our results suggest that listing significantly deteriorates absolute performance measures but is positively and significantly related to better unadjusted investment multiples. Index membership is relevant to performance only through listing structures, where the more listed PE managers in an index, the lower the performance.
! This research is joint work with Serge Darolles. We acknowledge support from the Private Equity and Venture
Capital Research Initiative, under the aegis of the Europlace Institute of Finance. All opinions are our own. We thank Helen Bollaert (Discussant), Thomas David, Jocelyn Evans, Edith Ginglinger, Oleg Gredil, Nils Härtel (Discussant), Jens Martin (Discussant), Jimmy Yang (Discussant) as well as participants from the 2018 FMA Annual Meeting, the 10th Annual Hedge Fund and Private Equity Research Conference, the 35th AFFI Spring
International Conference, the 35th AFFI Spring PhD workshop, and seminar participants from Université Paris
13
`2J,\-],.,&'$*0(',D%(8l,mno,[2.*"),-bdkRpbp[,capital ? i.e. money we can grow and invest over and over again in generations of startups, not a one-*%8',D0$3C,mno,[2',50(('$*,1410<.(, XH,)*(05*0('7,*2',!%8%*'3,-.(*$'()2%1,S!-B,^.),D%()*,0)'3,$'.(<J,eF,J'.(),.:4,mno,`2%<)*,*2', 5+5 year LP model has been largely unchanged since 1957, and it clearly works for many )055'))D0<,XH,D0$3)7,*2'(',.(',)48',%$*'(')*%$:,$'^,Z1.*%'$*,5.1%*.<_,843'<),mno,^',^.$*'3, to be able to invest for much longer in our winning companies than a typical 5+5 year LP fund allows, and to be able to build bigger stakes as companies remain private for longer periods. The pressure to show returns in Europe continues to force funds to sell out early after just a few years, and we believe the best global technology businesses take much longer *4, 60%<3, *4, *2'%(, 8.9%808, 14*'$*%.<C, `'"&', :4$', 106<%5, )4, 40(, 14(*D4<%4, 5481.$%'), 34$"*, 2.&',*4,0$*%<,*2'J,.(',('.3JC,mno
/(.1'(,b)1(%*,-<57,ZP4,^',I0)*,\-]"3,40(,X'$*0(',H.1%*.<,M%(8_7,a0$',GVth, 201615
1.1.
!"#$%&'(#)%"*
Listed private equity (LPE) refer to publicly-traded investment companies whose activity is to invest in privately-held companies or in traditional private equity funds. In 2006, private equity firm Kohlberg, Kravis and Roberts (KKR) took the private equity industry by surprise when they announced and completed their initial public offering. Other private equity firms, such as Blackstone, Apollo and Carlyle, went public in the following years. In a 2.8 trillion dollars industry16, listed private equity currently accounts for 10% of assets under management by our
estimates. Additionally, our data reveal that 38% traditional private equity funds are managed by listed funds-of-funds (in their study, Jegadeesh et al. (2015) report 29%). With the growing numbers of private equity public listings over the recent years, investors were offered a myriad 4D, Z<%>0%3, '914)0(')_, *4, 1(%&.*', '>0%*J, %$&')*8'$*), through listed private equity indices. Examples include Thomson Reuters listed private equity index (launched in 2008), Dow Jones Stoxx private equi*J,EF,S)*.(*'3,%$,EFFTB7,.$3,80*0.<,D0$3"),R!-P-Red Rocks LPE index family. \$&')*4()",.11'*%*',D4(,*2')',%$3%5'),%),3(%&'$,6J,*2',.**(.5*%&'$')),4D,2.&%$:,.,<%>0%3,'914)0(',*4, private equity, combined to the diversification benefits PE is reputable for17. Investors regard
private equity as an asset class and have long been attracted by the documented superior
15 Full statement available here (visited January 9th, 2018)
16 According to Preqin data ? the 2018 Preqin Global Private Equity and Venture Capital Report.
17 However, in their study, Franzoni, Nowak and Phalippou (2012) investigate whether traditional (unlisted) private equity truly provides diversification benefits and find that it suffers from the same exposure to liquidity risk as public equity and other asset classes.
14
performance of the industry18. While the superior performance of private equity is highly
debated (Kaplan et al. (2014), Stücke (2011) and Phalippou (2014), among others), the question of whether listed private equity truly replicates the documented performances of traditional private equity has not been addressed. In this paper, we investigate whether the performance of public private equity-led deals differs significantly from that of traditional private equity. Moreover, as investors are offered LPE-based investment products, we further examine whether selection into indices delivers higher returns.
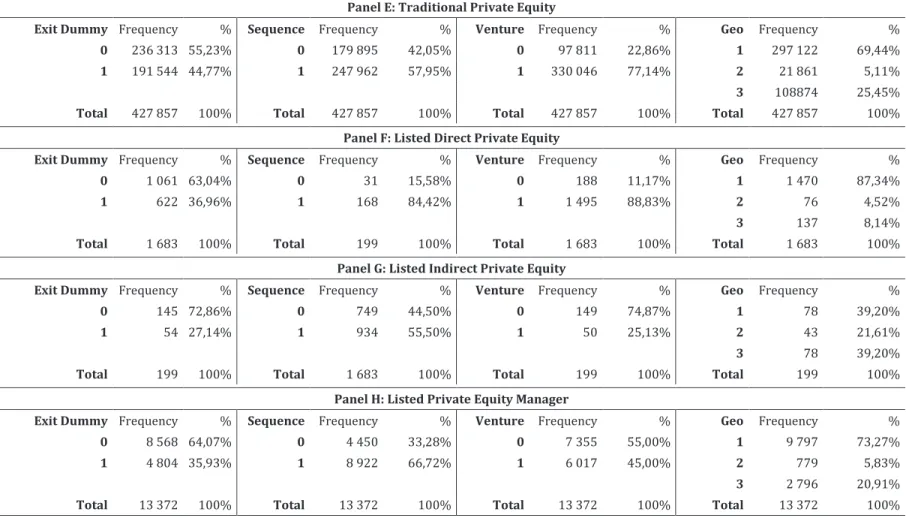
After controlling for firm, fund and deal characteristics and including year fixed effects, country fixed effects, deal structure fixed effects and listing structure fixed effects, our results suggest that public listing significantly induces a 7% lower probability of achieving a successful exit through IPO or trade sale at the deal level, supported by significantly lower exit rates at the fund level (measured as the total number of successfully exited investments ? by way of IPO or trade sale ? to the total number of invested deals). In value terms, listed private equity have slightly higher absolute investment multiples (total unadjusted values of proceeds from exiting investments to the total invested amount19), but this result is reversed after market-adjusting the realized values
using the PME measure at the deal level. The aforementioned results are sensitive to the listing structure. As private equity is traditionally structured as a limited liability partnership, where investors (LPs) commit capital to a fund under the management of a private equity firm (GP), the mechanism by which private equity becomes public has three generic forms: through publicly <%)*%$:, S%B, *2', 8.$.:'8'$*, D%(87, S%%B, *2', ZD0$3_, .$3q4(, S%%%B, *2', ZD0$3, 4D, D0$3_C, M4<<4^%$:, *2', exposure level that they provide investors with to the underlying portfolio companies, we refer to those respectively as a listed manager, a Direct listed PE vehicle, and an Indirect listed PE vehicle. In that regard, there is no evidence that Direct listed private equity entities have lower exit success probability nor lower exit rates, while they show significantly higher market-adjusted multiples. Indirect listed private equity entities have almost twice as much chance of successfully exiting an investment than traditional private equity, but they significantly underperform across all other performance measures. Finally, listed managers are consistent
18 See Kaplan and Sensoy (2015) and Harris, Jenckinson and Kaplan (2014) for a survey.
15
with the mainstream results, except that they do not significantly do better in unadjusted money multiple terms. Furthermore, as ? institutional ? investors are offered exposure to listed private equity through dedicated market indices, our results show that performance conditional on index membership is more relevant when the included entity is a listed manager. As private equity investments are privately-held companies that are illiquid and more exposed to risks of bankruptcy or financial distress, we further note that the listing structure (with regards to the level of exposure to private equity investments) significantly influences LPE performance. Increasing the complexity of the listing structure (i.e. having less direct exposure to the underlying portfolio companies) significantly increases the exit rate by 3%.
Although listed private equity entities are publicly traded companies, they are not easily identifiable. We put effort into mitigating the possible selection bias from simply studying existing index constituents and construct a representative dataset of the universe of listed private equity. To this end, we textually process the business descriptions of companies in SDC, Eikon and Orbis-BvD databases and assess the relevance of the obtained sample to the private equity business model (fund design, private and limited-life investments, fee structures, etc.). We then restrict the sample to public entities by matching the resulting sample to the universe of listed companies on Datastream. Hence, we are able to identify 825 unique listed private equity entities, exceeding by far the number of studied entities in the nascent literature on listed private equity, and further covering the estimated universe of listed private equity by industry professionals and index providers20.
We collect performance data from several vendor databases and account for issues documented in existing studies on the quality of data available for private equity research. Our initial performance dataset is comprised of portfolio company-level data on more than 450,000 private equity transactions involving 89,252 portfolio companies between 1952 and 2016. We are able to identify these investments to their corresponding funds (16,152 unique funds and 9,369
20 While there is no consensus on the number of listed private equity entities, the smallest index in number of constituents comprises 20 entities and the largest has a count of 118 listed private equity entities. On their websites, many mutual funds such as ALPS Red Rocks report tracking between 500 and 600 listed entities worldwide.
16
unique fund-of-funds) and GPs (10,947 over the performance sample period). We match 324 LPE by name to this performance dataset, that is 39% of the identified population of listed private equity.
Evidence on private equity outperformance is mitigated as to the considered time periods, the data used and the performance metrics. Recent research debates previously documented private equity outperformance compared to the public market. Using Burgiss data for vintage years 1984-2008, Harris, Jencksinson and Kaplan (2014) find that private equity outperforms the market (S&P500) by 3% on average annually. With Preqin data for vintages 1993 to 2011, Phalippou (2014) documents a -3.1% annual underperformance after adjusting for size, value and leverage, using the Fama-French small value 1.3x leveraged index, which is closer in nature to the characteristics of the companies that private equity invests in. Jegadeesh et al. (2015) study listed fund of funds that invest in traditional private equity funds to infer the 8.(h'*"), expectations of private equity returns. Our paper adds up to these growing efforts by challenging the performance of private equity using listed private equity as a similar liquid benchmark. There is an extensive body of literature examining whether indices replicate the performance of their underlying assets, such as studies on hedge fund indices or REITs indices, but the question of whether a listed private equity index is related to the performance of the underlying private equity investments has not been examined, especially given the gap in the pricing frequency between the index constituent (LPE is marked-to-market) and the underlying investment (self-reported ? quarterly ? net asset values).
The rest of the paper proceeds as follows. Section 2 describes the features of listed private equity and discusses the issues related to data available for private equity research. Data and methodology are described respectively in sections 3 and 4. In section 5, we examine the relationship between private equity performance and listing, and study performance drivers within the LPE subsample with regards to liquidity, being part of an index and other related factors. Section 6 concludes.
17
1.2.
H-(FI$%'"&**
Private equity is a long-term investment in privately held companies, aimed to provide equity or equity-like financing in order to help develop these companies and generate attractive long-term returns to their investors. Private equity investments are usually organized in limited liability partnerships (LLP), where investors, the limited partners (LPs), commit capital to a fund that is managed by a management company, the General Partners (GPs)C, [2', r'$'(.<, -.(*$'()", compensation structure includes a management fee (usually 1 to 2% of the committed capital), .$3,.,1'(D4(8.$5',D'',S5.((%'3,%$*'(')*B,*2.*,%),'.($'3,%D,*2',r-),('.52,*2',%$&')*4()",1('D'(('3, rate of return (hurdle rate, usually 8%). Carried interest typically amounts to 20% of the proceeds from exiting the investments when the fund is liquidated. Limited liability partnerships are limited-<%D',%$&')*8'$*,&'2%5<')C,[2',D0$3"),<%D',is about 10 years, extendable to an additional 2 to 4 years21.
Listed private equity are publicly-traded investment companies whose main activity is to invest in privately-held companies or in traditional private equity funds. Listed private equity first drew .**'$*%4$, ^2'$, )48', 4D, *2', %$30)*(J"), 6%:, 1<.J'(), 5481<'*'3, *2'%(, %$%*%.<, 106<%5, 4DD'(%$:)C, Examples include KKR in 2006, Blackstone in 2007, and Carlyle in 2012. There has been a slew of similar public listings in the past decade and in the recent years, with s.8%<*4$,!.$'"),#P/,EFF, million IPO on Nasdaq in February 2017227, .$3, /(.1'(, b)1(%*"), GBP 120 million (~USD 154
million) IPO on London and Dublin Stock Exchanges in June 201623.
There are several ways we observe listed private equity. The underlying asset is a private equity investment (privately-held company), either managed by a listed GP (listed management firm), sponsored by a listed LP (listed fund of funds or LP firm) or directly held by a listed fund or investment company24. In the following, we refer to any of the three listing options indifferently
21 See Phalippou (2007) for an overview of private equity fund structure and business cycle. 22 P'',Zs.8%<*4$,!.$',D%<'),D4(,\-]_7,[2',`.<<,P*(''*,a40($.<7,M'6(0.(J,Gst, 2017.
23 P'',Z/(.1'(,b)1(%*,).J),\-],6.5h,4$7,1('1.('),*4,(%$:,*2',6'<<,4$,`'3$')3.J_7,[2',Telegraph.
24Unlike in the UK for example, listed funds are not allowed in the US, therefore many direct investment vehicles take the form of BDCs or other regular listing form (PLC, LLC, etc.)
18
as listed private equity (or LPE). We also use the terminology traditional private equity, or TPE to qualify investments in private equity limited liability partnerships where none of the GP, LP or the investment vehicle are publicly traded.
Appendices S1.2 and S1.3. provide details on the properties of listed private equity, the types of exposures they provide investors and how they compare to traditional private equity.
The body of existing literature can be divided into two sets: research examining private equity performance gross of fees (at the portfolio company level), and research examining private equity performance net of fees (at the fund level). Table 1 reviews some of the pioneering work on private equity performance based on this classification25. The literature on private equity
performance debates the superior performance of private equity over time (private equity performance has been decreasing, Kaplan and Sensoy, 2015); and over the nature of the reference benchmark (the marginal gain of one dollar invested in private equity compared to the public market benchmark). Some studies use the S&P500 as the reference benchmark for calculating the public market equivalent (Kaplan and Schoar, 2005) while others tailor that measure using the Russell3000 or the Fama-French Size Tercile Index, which exhibit similar .**(%60*'),*4,*2',1(%&.*','>0%*J"),*.(:'*,5481.$%'),SPhalippou, 2014, !"s'(,'*,.<C7,EFGe). At the median, the typical fund roughly outperforms the S&P500 by 1%. The average private equity fund performance is highly skewed by the top decile funds that largely deliver the 3% spread to the S&P500, which are required by investors to compensate for the risks associated with the illiquid nature of private equity investments. The rest of the average fund returns fail to reach this requirement, and their performance is worse if other small public companies benchmarks are used as reference points. Moreover, investors often rely on the track-record of the GP to allocate capital to private equity funds. Another strand of literature has examined whether performance was persistent across funds managed by the same GP over time. The recent survey by Kaplan and Sensoy (2015) establishes that private equity performance is sensitive to performance metrics (notably the benchmark used for comparison) and that despite consistent evidence of superior performance, this performance has been decreasing over time. Earlier research established
19
persistence in private equity returns (Kaplan and Schoar, 2005), yet recent papers showed that past performance no longer predicts future performance (Harris et al., 2014, and Braun et al., 2017). Using listed private equity, Jegadeesh et al. (2015) establish with a sample of 29 listed funds-of-funds that invest in traditional private equity funds, and a subsample of 115 direct listed private equity vehicles, that the market expects the investors of listed private equity to earn an abnormal return of 0.5% per annum and that returns of listed private equity are a good predictor of changes in reported net asset values of traditional private equity.
Listed private equity often cite substantial benefits to their IPOs. Access to a permanent source provides LPE with readily-available funds to invest from, with indefinitely re-investable capital gains. Listing is also associated with investment performance and investment horizons flexibility .),%*,<%D*),*2',1('))0(',4D,2.&%$:,*4,'9%*,%$&')*8'$*),'.(<J,.*,*2','$3,4D,*2',D0$3"),<%D'C,k4('4&'(7, the liquidity benefits associated with LPE would exempt investors from the 10-year lock-up periods associated with traditional private equity partnerships, and standardize access to this asset class as there is no conditional minimum required capital amount for commitments.
Many investment professionals have constructed indices for listed private equity to provide investors with exposure to private equity investments26. The objective of our paper is two-fold.
First, we challenge the outperformance claims of listed private equity by comparing their performance to that of a matched sample of traditional private equity (as counterfactual). Second, we attempt to identify the sources of possible performance differentials and discuss the rationale of the decision to list.
26 Examples include LPX index family, ALPS - Red Rocks GLPE index, S&P Listed Private Equity Index, Dow Jones STOXX PE 20 and Société Générale Private Equity Index (PRIVEX). Our screened sample contains all LPE index constituents that we were able to identify, namely Listed Private Equity Index (provided by Switzerland-based LPX GmbH), DJ STOXX PE 20 (Dow Jones), Thomson Reuters Buyout Index and Société Générale Privex index. Other products offer private equity exposure to investors via listed vehicles, such as mutual funds ALPS-Red Rocks Listed Private Equity and Vista Listed Private Equity Plus. These mutual funds invest in a diversified portfolio of listed private equity entities and we were able to match their holdings by name to our screened sample.
20
1.3.
0-#-*
1.3.1.
Data issues in private equity research
Previous literature has pointed out biases in vendor and proprietary datasets used for private equity research. The key rebuke is that most of these commercial databases gather data from GPs rather than from LPs27, hence increasing selection and survivorship biases. Several private equity
studies assessed the scope of such biases. Kaplan, Strömberg and Sensoy (2002) evaluate VenturExpert and Venture Economics from comparing the actual contracts of 143 financings to their reported data in the databases and find that they roughly exclude 15% of the financing rounds. Jeng and Lerner (2011) review and comment the exiting data for private equity research and suggest alternative data sources. Stücke (2011) assesses *2', 3.*., %$, [248)4$, d'0*'("), VenturExpert28 and finds that it suffers from a significant downward bias in presented
performances. Harris, Jenckinson and Kaplan (2014) study private equity performance using different databases (Burgiss, Preqin, Cambridge Associates (CA) and Venture Economics (VE)) and find that performance is similar across Burgiss, Preqin and CA, but reach similar conclusions in Stücke (2011) about VE.
Recent initiatives such as the Private Capital Research Institute (Jeng and Lerner (2011), Kaplan and Lerner (2016)), e-Front and Burgiss illustrate growing efforts to mitigate biases in previously used databases and provide researchers with better quality data. However, data is anonymized. A trade-off we had to make is to rely on other vendor databases because we needed the identity of the listed private equity entities to allow for merging with other datasets and establishing a link with the portfolio companies in order to construct our performance dataset. We still give special care to data quality in using the afore mentioned datasets. In their recent study, Harris,
27 Disclosure from LPs is mainly a consequence of the Freedom Of Information Act (FOIA), to which public investors, such as pension funds, are subject to. Other LP sourced data in other jurisdictions uses FOIA-like requirements. LP sourced data is -a priori- of better quality because, unlike GPs, limited partners would not be inclined to overstate returns.
28 Became Venture Economics. The data have been discontinued since 2013 and Thomson Reuters give access to Cambridge Associates fund performance data through their platform.
21
Jenkinson and Kaplan (2014) show using Burgiss (LP reported data), that GP-reported data in Preqin and Cambridge Associates is similar to what they find in Burgiss. They conclude that given the different sourcing methodologies of the studied providers, it would be unlikely that GPs overstate reported returns.
1.3.2.
Sample construction
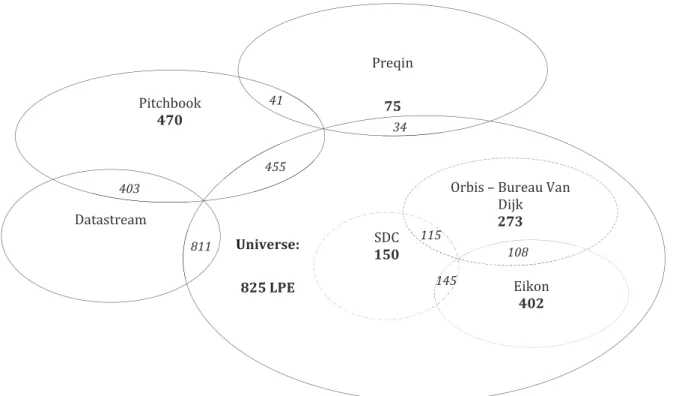
We identify listed private equity vehicles by textually processing the business descriptions, histories and overviews of companies in Securities Data Company (SDC), Orbis ? Bureau Van Dijk, and Eikon databases. Because of the different listing structures highlighted in the previous section, LPE is not a homogenous universe and it becomes challenging to identify these entities using traditional screening methods such as industry codes, peer groups or constituents of LPE indices. This search results in 5,782 hits in SDC, 21,215 hits in Orbis and 59,991 hits in Eikon. To account for listed entities alone, we cross-reference the SDC sample by name to their New Issues universe, we fi<*'(,5481.$%'),^24)',)*.*0),%),Z<%)*'3_,4(,Z3'<%)*'3_,%$,](6%)7,.$3,^',<%8%*,*2',b%h4$, ).81<',*4,'$*%*%'),^%*2,.,Z106<%5_,D<.:C,`',.<)4,54$)%3'(,5481.$%'),^%*2,.,Z1(%&.*'_,D<.:,^2%52,^', are able to match to the universe of delisted entities in Datastream. This returns 253 LPE entities in SDC, 475 matches in Orbis and 706 matches in Eikon. We thoroughly examine available company filings and websites to verify the investment business model of the screened entities and make sure their holdings consist of private companies. We also eliminate listed corporate private equity arms and corporate venture capital, shell companies, tax-optimization structures and early SPACs or SPACs which did not succeed29. This results in 150 hits in SDC, 273 hits in
29 Listed private equity entities can list under usual listing structures as any publicly-traded company. Special Purpose Acquisition Companies or SPACs are one form of listing such that they are registered with the SEC for an acquisition purpose or target yet to be defined. SPACs are immediately liquidated if targets are not found within a specified period but they continue to trade under specific conditions, which gives them the reputation 4D,6'%$:,Z)2'<<,5481.$%')_,%$,*2'%(,D%()*,)*.:')C,s4^'&'(7,P-RH),41'(.*',<%h',60J40*,D0$3),^2'$,*2'J,)055''3C Other special listing structures that we carefully consider in our sample are Special Trust Acquisition Companies (STACs), Venture Capital Trusts (VCTs) and Business Development Companies (BDCs). Unlike SPACs, STACs have the particularity to be tax-structured entities which raise money on the public markets with the purpose of acquiring private companies that they identify prior to going public. They benefit from management and advisory services similar to private equity funds, and have long holding periods of their 14(*D4<%4,5481.$%')C,[2',*.9,6'$'D%*),.(',)052,*2.*,*2',P[RH,4^$'(),1.J,%$548',*.9,4$,*2',D%(8"),%$548',.$3, not the STAC itself (pass-through taxation), as in limited liability partnerships. VCTs primarily developed in the
22
Orbis and 402 hits in Eikon. Our end sample consists of 825 unique international listed private equity entities.
Figure 1.1. illustrates the final LPE sample composition across the databases used for screening (SDC, Orbis, Eikon and Datastream) and the databases used for performance data crunching (Pitchbook and Preqin). The venn diagram shows common observations across the different datasets used. While some databases have a majority of common observations, one reason why they might vary in coverage is because of the different collection processes and the differences in the reporting mechanisms by the GPs and LPs. While we do check that the data common to two or more sources are similar, it is not possible to verify how the values compare for unique instances to every database. However, findings by Harris et al. (2014) suggest that the performance databases used in this paper yield similar results.
[Figure 1.1. about here]
There is no consensus as to the exact number of listed private equity entities. Industry professionals and index providers give estimates ranging from few dozens to more than 500 vehicles globally. With our identification procedure, we believe we largely cover the universe of
UK with the purpose of investing in seed, early stage and growth companies. Their investments are not required to be private as they can also invest in companies which trade on the AIM, but some do have strictly or a majority of private holdings. They also benefit from several tax relieves provided they hold their investments for a certain period of time. Finally, BDCs are listed closed-end entities which invest in small and medium enterprises. They are bound by the regulators to provide significant assistance to the investee companies in order to insure their development and have the particularity to allow access to these companies to non-accredited investors. BDCs are highly regulated in a way that can make them comparable to private equity funds in many aspects. For instance, at least 70% of their assets must be private companies and they must distribute a minimum 90% of their income to their shareholders.
23
listed private equity considering industry professionals or recent academic work as reference points30.
Initially, traditional private equity managers are not required to publicly report information on their performance and they share data with their investors only as part of their business relationships. Public reporting surfaced when public investors such as pension funds became interested in private equity, subjecting them to public reporting. Yet, many court rulings have granted private equity managers the privacy of sensitive information31. Therefore, Investment
and performance privacy mostly remains after the IPO unless willingly disclosed by the GPs or their LPs in financial databases or corporate communication.
Because of the diversity of listed private equity, we use firm-level performance measures. We source and merge deal-level data from Pitchbook, Securities Data Company and Zephyr ? Bureau Van Dijk. The resulting performance dataset comprises 451,450 private equity deals involving 94,992 portfolio companies, 10,947 GPs and 16,152 Funds (including 9,369 funds-of-funds).
We match the investor names of the identified private equity investments to our screened universe of LPE. Overall, we are able to match 324 LPE (39% of the identified LPE universe) entities that went public between 1965 and 201332, to deal-level data between 1916 and 2016.
We obtain market data on the identified LPE entities by matching them by name to the universe of listed companies on Datastream33. We account for name changes, Frequently Known As (FKAs)
30 To the best of our knowledge, mutual fund ALPS-Red Rocks tracks the largest number of LPE, estimated to about 500 entities. The Swiss-based LPX is the second largest provider with a family of LPE indices, tracking 118 listed private equity vehicles. LPEQ, a body aimed at shaping awareness of the profession and bringing together LPEs and investors, counts a dozen LPE members. Jegadeesh et al. (2015) use a sample of 144 LPEs (29 listed funds-of-funds and 115 LPE entities) in their study.
31 M4(, '9.81<'7, )'', ZFreedom of Information Act Clarification for Private Equity, Portfolio Company Information_7,Illinois Venture Capital Association, 2006.
32 We have records of IPOs and investments until 2017 but we only consider IPOs up to 2013 to make sure all investments are exited.
33 We account for data quality issues with using Datastream that are highlighted in Ince and Porter (2006) and carefully check for unusual market data changes and the accuracy of the IPO dates across Stock Exchanges in which entities are or were traded, as well as specialized media coverage.
24
names and Also Known As names (AKAs). We also consider to be the IPO date, the day in which we observe the first effective trading in Datastream and the delisting date the date in which Datastream returns {dead}, {delisted} or {merged} substrings for the considered entity.
1.3.3.
Variable definition and descriptive statistics
We use four performance measures as dependant variables: (1) the exit rate, computed as the ratio of successful exits to the number of total investments in number. Following Hochberg, Ljunqvist and Lu (2007) and Phalippou and Gottschalg (2009) we define a successful exit as an exit by way of either an IPO or a Trade Sale34. (2) The exit multiple, which is computed as the
ratio of successful exits to the number of total investments in value; (3) a dummy variable, which is equal to one if the exit is successful and zero otherwise and (4) a deal-level PME, computed as the market adjusted investment multiple for the same holding period investment in the public benchmark of where the portfolio company is located (we use the MSCI of where the portfolio company is located as a reference benchmark).
Our variables of interest are four dummy variables that take the values of 0s and 1s depending on the structure of the listed entity. We consider the variable traditional which takes the value of one if the portfolio company is backed by traditional private equity at a given investment date and zero otherwise. The remaining three dummy variables related to listed private equity (i.e.
direct, indirect and manager), and take the value of one if the considered portfolio company is
respectively invested by a direct listed investment vehicle, an indirect listed investment vehicle or a listed private equity manager, and zero otherwise. We exclude from the sample three observations where the portfolio company is invested by cross-listed entities, that is for example .,5481.$J,^2%52,%),6.5h'3,)%80<*.$'40)<J,6J,.,<%)*'3,3%('5*,%$&')*8'$*,&'2%5<',SZD0$3_B,.$3,., listed manager. We also make sure that investments are fully exited with regards to the
34 In non-tabulated results, we find the measures of performance insignificant using IPO or M&A individually as successful exits, but we do find the joined measure to be significant.
25
considered LPE IPO date, that is both the investment and exit dates are either before the IPO date or after the IPO date, as we do not observe the returns until the investment is liquidated.
Following the literature on private equity performance, our control variables include size, measured as the total invested capital; experience, proxied by total number of deals (Sorensen, 2007); the time to exit, measured as the difference between the exit completion date and the investment date in years; the age of the portfolio company at the time of financing, measured as *2', 3%DD'('$5', 6'*^''$, *2', %$&')*8'$*, 3.*', .$3, *2', 5481.$J"), D40$3%$:, 3.*', %$, J'.()t, *2', sequence of the investment, a dummy variable that takes the value of 1 if it is a first-time investment and zero otherwise; and the number of affiliations or memberships to investor clubs, private equity associations or similar bodies. We add a dummy variable for venture investments which takes the value of one if the investment type is venture capital and zero otherwise. We include a variable geography, which a category variable that takes the value of 1 if the investment is local, the value of 2 if the investment is nearby and the value of 3 if the investment is distant. We transform this variable into three dummy variables for the regression analysis: Local, Nearby, and Distant. We consider an investment to be local if both the portfolio company and the GP are located in the same country based on their headquarters locations. An investment is considered nearby if the portfolio company is located in a country that shares either a land or a maritime border with the country where the GP is headquartered. Finally, the investment is considered distant if its location is n4*,.3I.5'$*,*4,*2',r-"),&%.,<.$3,4(,8.(%*%8',64(3'()C,M4(,D0(*2'(,.$.<J)%)7, we gather market data on the LPE subsample: liquidity, measured as the turnover of the traded LPE entity; Home, a dummy variable that takes the value of one is the considered LPE trades in its home exchange and zero otherwise; and index, a dummy variable that takes the value of one if the LPE entity a constituent of a LPE index and zero otherwise. Table 1.2 provides sample summary statistics for the TPE and LPE.