This article has been accepted for publication and undergone full peer review but has not been through the copyediting, typesetting, pagination and proofreading process, which may lead to differences between this version and the Version of Record. Please cite this article as doi: 10.1002/etc.4741.
Acc
ep
ted
Art
icle
20-00094 Environmental Toxicology M. Fadhlaoui et al.Influence of temperature and nickel on biofilm fatty acid
Influence of temperature and nickel on algal biofilm fatty acid
composition
Mariem Fadhlaouia*, Vincent Laderrierea, Isabelle Lavoiea and Claude Fortina a
Institut national de la recherche scientifique, Centre Eau Terre Environnement, 490 rue de la Couronne, Québec, Québec G1K 9A9, Canada
(Submitted 18 February 2020; Returned for Revisions 19 March 2020; Accepted 30 April 2020)
Abstract: Freshwater biofilms play an important role in aquatic ecosystems and are
widely used to evaluate environmental conditions. Little is known about the effects of temperature and metals on biofilm fatty acid (FA) composition. In this study, we exposed a natural biofilm cultured in mesocosms to a gradient of nickel (Ni) concentrations at 15 and 21°C during 28 days. Metal bioaccumulation, algal taxonomic composition and biofilm FA profiles were determined. At both temperatures, bioaccumulated Ni increased
Acc
ep
ted
Art
icle
with Ni exposure concentration and reached the highest values at 25 μM Ni, followed by a decrease at 55 and 105 μM Ni. In control biofilms, palmitic acid (16:0), palmitoleic acid (16:1n7), oleic acid (18:1n9), linoleic acid (18:2n6) and linolenic acid (18:3n3) were the dominant FA at 15 and 20°C. This composition suggests a dominance of cyanobacteria and green algae, which was subsequently confirmed by microscope observations. The increase in temperature resulted in a decrease in the ratio unsaturated:saturated FA, which is considered as an adaptive response to temperature variation. Polyunsaturated FA tended to decrease along the Ni gradient, as opposed to saturated FA which increased with Ni concentrations. Temperature and Ni affected differently the estimated desaturase and elongase activities (product/precursor ratios). The increase in PUFA at 15°C is concomitant to an increase in Δ9-desaturase (D9D). The estimated activities of (D9D), Δ12-desaturase (D12D) and Δ15-desaturase (D15D) decreased along the Ni gradient and reflected a decline in PUFA. The elevated estimated elongase activity (ELOVL) reflected the observed increase in SFA at the highest Ni exposure concentration (105 µM). Our results suggest that FA could be used as endpoint to evaluate environmental perturbations.
Acc
ep
ted
Art
icle
Graphical abstractKeywords: Environmental toxicology, bioaccumulation, biomonitoring, metal
accumulation
*Address correspondence to [email protected]
Published online XXXX 2020 in Wiley Online Library (www.wileyonlinelibrary.com). DOI: 10.1002/etc.xxxx
Introduction
In the context of global change, aquatic ecosystems are subjected to multiple stressors such as inorganic and organic contaminants, eutrophication, salinization, and to an increase in surface water temperature. The declining quality of freshwater environments has an impact on living organisms and these respond differently to the various stressors. Freshwater biofilms play a key role in aquatic ecosystems as they are at the base of the trophic chain. They are complex structures composed of algae, bacteria, archaea, fungi
Acc
ep
ted
Art
icle
and protozoa embedded in a polysaccharide matrix (Sabater et al. 2007). In streams and rivers, biofilms provide an important source of fatty acids (FA) for higher trophic levels. In particular, polyunsaturated fatty acids (PUFA) are essential for physiological functions (Guo et al. 2017) such as growth, reproduction, energy storage, and they also constitute a major structural element of cell membranes (Tocher 2003). Long chain PUFA (LC-PUFA) such as docosahexaenoic acid (DHA, 22:6n3), eicosapentaenoic acid (EPA, 20:5n3) and arachidonic acid (ARA, 20:4n6) are mainly produced by algae (Dalsgaard et al. 2003; Li et al. 2002) and are transferred through the food web to higher consumers. Some aquatic organisms cannot synthetize LC-PUFA and depend strongly on FA from biofilms (Guo et al. 2017; Guo et al. 2016). Certain organisms have the ability to synthetize LC-PUFAs but the process is metabolically costly (Monroig and Kabeya 2018). There has been a growing interest in the role of FA in aquatic ecosystems and approaches based on the study of FA profiles are used to investigate food web trophic relationships (e.g., Kelly and Scheibling 2012; Twining et al. 2016).
Biofilms are commonly used in biomonitoring (Bonnineau et al. 2010; Tlili et al. 2011) because they integrate environmental fluctuations over relatively short periods of time and thus respond quickly to different environmental perturbations (Bonet et al. 2012; Soldo and Behra 2000). Several studies investigating various endpoints have highlighted the sensitivity of biofilms to environmental stressors such as trace metals (Lavoie et al. 2012; Leguay et al. 2016) pesticides and other organic compounds (Guasch et al. 2003; Morin et al. 2018), pharmaceutical products (Lawrence et al. 2005), and eutrophication (Carr et al. 2005). In response to these stressors, several aspects of biofilm structure and functions may be affected, including FA composition. Indeed, changes in biofilm FA
Acc
ep
ted
Art
icle
profiles have been observed as a result of several environmental perturbations such as eutrophication and acid mine drainage (Drerup and Vis 2018; Guo et al. 2017; Whorley et al. 2019). Modifications in FA profiles may have important consequences on higher trophic levels if essential LC-PUFA produced by algae decline as a response to stress.
Fatty acid composition is linked to biofilm assemblage structure (e.g., bacteria, fungi, algae) (Honeyfield and Maloney 2015), and may also vary as a direct metabolic response (FA synthesis within the cells) to environmental conditions (e.g., light, nutrients, metals) (Hill et al. 2011; Sharma et al. 2012). Algae are generally the dominant component of periphytic biofilms (Rex and Gina, 2017) and are known to have a higher nutritional value than bacteria and fungi (Guo et al. 2016). Among algal groups, diatoms are particularly rich in PUFA (Yi et al. 2017; Zulu et al. 2018) and represent a high quality food source in terms of lipids for heterotrophic organisms compared to other algal groups such as cyanobacteria. Environmental stressors affecting biofilm taxonomical composition (e.g., a shift from a diatom- to cyanobacteria-dominated biofilm) can result in marked alterations in FA profiles.
Temperature is one of the main environmental factors regulating physiological and biochemical processes (Jiang and Gao 2004; Renaud et al. 2002; Renaud et al. 1995). Indeed, it has been demonstrated that warmer water temperatures induce structural modifications in algal cell membranes in order to regulate fluidity (homeoviscous acclimation), resulting in reduced proportions of PUFA in the biofilm (Fuschino et al. 2011). Average temperatures in Canada are projected to increase by 1.5 - 2.5°C in the summer and by 3 - 7°C in the winter towards the end of the century (OCCIAR. 2015),
Acc
ep
ted
Art
icle
suggesting the necessity to also consider the potential effects of warmer waters in exacerbating the repercussions of stressors on basal resources quality.
Nickel is a metal that can be found at high concentrations in some Canadian surface waters and mining activities in eastern Canada are a major source of Ni contamination (Lavoie et al. 2019). For example, the greater Sudbury area (Ontario, Canada) is well-known for its past and present Ni mining operations (Winterhalder K. 1995; Gunn et al. 1995). Biological impairment has been observed on aquatic organisms (e.g., fish, algae and zooplankton) in this region and surroundings, and contamination is still present despite different actions to improve water quality and to reduce stresses on biological communities (Gauthier et al. 2006; Lavoie et al. 2018). Nunavik in Northern Québec is also rich in Ni deposits and it is anticipated that mining operations in this area will be expanding. A study conducted in close proximity to mining sites in Nunavik has shown elevated metal concentrations in the surrounding streams and effects on diatom assemblages (Lavoie et al. 2019). The combination of chemical stressors and warmer water temperatures on FA composition of stream biofilms has received little attention.
The aim of the present study was to determine the effect of nickel on laboratory grown biofilm FA composition to better understand potential effects of nickel contamination on biofilm nutritional quality. In addition, because various physiological and biochemical processes taking place in the biofilm matrix are affected by temperature (including FA profiles), we investigated the effect of Ni at two temperatures. Biofilms were exposed to a gradient of Ni concentrations (0, 5.5, 10, 25, 55 and 105 μM) selected according to concentrations observed in streams located in close proximity to mining sites in Northern Quebec and Northern Ontario (Canada). We hypothesized that Ni affects biofilm FA
Acc
ep
ted
Art
icle
composition by reducing the proportion of high quality PUFA and by increasing the proportion of saturated fatty acids (SFA), and that this effect will be exacerbated at a higher water temperature.
Materials and methods
2.1 Experimental setup and biofilm collection
A natural biofilm collected in a reference stream from Nunavik (Quebec, Canada) was cultured under laboratory conditions for several weeks prior to the experiment. Unglazed ceramic tiles were selected as growth substrate. We used the Fraquil medium (Morel et al. 1975) to culture the biofilm and to conduct the Ni exposure experiments. Biofilm Ni exposures were carried out in 12 independent Plexiglas mesocosms (100 cm x 20 cm x 10 cm) under controlled light and temperature conditions in an environmental chamber. Each mesocosm was equipped with a pump to maintain a continuous flow and to provide oxygenation. Neon lamps were used to deliver constant light (70 - 80 µmol·photons·m -2
·s-1) for a 12/12 h light/dark photoperiod and experiments were conducted at 15 and 21°C for a period of 4 weeks. Two mesocosms were prepared for each Ni concentration as well as for the control condition. During the exposure period, water was renewed once per week and water samples were collected to determine water Ni concentration on a weekly basis. Water samples were acidified with nitric acid (trace metal grade HNO3, final concentration of 10%) before measurement. Nickel concentrations were determined using inductively coupled plasma–atomic emission spectrometry (ICP-AES; Varian Vista AX CCD). Temperature and pH (7.00 ± 0.16) were verified twice per week.
Acc
ep
ted
Art
icle
Biofilms were exposed to a gradient in Ni concentrations where the following nominal concentrations were targeted: 0, 5.5, 10, 25, 55 and 105 μM. For the experiment conducted at 15°C, Ni concentrations were < detection limit (D.L = 3.52 nM) 5.9 ±0.6, 13.2 ± 0.7, 24.1 ± 1.1, 64.2 ± 8.9, and 126± 18 μM (n = 20, corresponding to the number of water samples collected during the exposure period). At 21°C, Ni concentrations were < D.L, 5.9 ± 0.2, 7.8 ± 0.6, 20.6 ± 1.1, 60.6 ± 8.5, and 131 ± 20 μM (n = 20). The MINEQL+ software (version 5.0) was used to calculate the free ion concentrations (Ni2+). The software's default thermodynamic database was updated using the NIST (National Institute of Standards and Technology) Critically Selected Stability Constants of Metal Complexes: data base (version 8.0). Most of the nickel complexation was due to the presence 5 µM EDTA in the Fraquil medium. The average calculated Ni concentrations using MINEQL+ for each condition are presented in Table 1. Biofilms were collected after 28 days of exposure and subsamples were stored for the different analyses to be performed. Formaldehyde was added to preserve subsamples for microscope observations. Subsamples were rinsed with EDTA (1 mM, pH 7), centrifuged (6000 rpm/5 min) and lyophilised (48 h) for Ni bioaccumulation analyses. Subsamples were immediately placed in liquid nitrogen and stored in a −80°C freezer for FA analyses. Three pseudo-replicated samples per mesocosm were collected, resulting in six samples per condition (three pseudo-replicates x two true replicates).
2.2 Nickel concentrations in the biofilms
Lyophilized samples were weighed and digested in trace metal grade nitric acid (800 μL) for two days at room temperature, followed by the addition of trace metal grade hydrogen peroxide (200 μL) for another 48 h. A sample of 800 µL of the digested material was then
Acc
ep
ted
Art
icle
diluted in 7.2 mL of Milli-Q water to reach a final HNO3 concentration of 10%. Blank digestions were also carried out according to previous steps. Certified reference material (IAEA-450, Platinum and trace elements in algae; 0.82 ± 0.10 mg Ni/kg dry sample) was also analyzed to assess analytical accuracy and recovery ranged between 80.9 and 81.8 % with an average of 81.5± 0.5 %. Nickel concentrations were determined by ICP-AES as described above.
2.3 Fatty acid analyses
Lipids were extracted according to a modified version of the protocol presented in Folch et al. (1957) where a subsample of 100 mg was homogenised in 3 mL of chloroform/methanol (2:1, v/v) containing 0.01% (w/v) butylated hydroxytoluene (BHT) as antioxidant. Tricosanoic acid (C23:0) was added as an internal standard. Samples were homogenized using an UtraTurrax T25 for 2 min and sonicated (Branson 150) for 5 min to break cell walls and plasma membranes. Proteins were precipitated by adding 3 mL of NaCl (0.73%) and the mixture was centrifuged for 15 min at 1000 g. The chloroform phase containing lipids was removed and concentrated in a TurboVap® under a nitrogen flow to a final volume of 1 mL. To facilitate their analysis by gas chromatography, FA were esterified with 2 mL of BF3 (Boron trifluoride-methanol solution 14% in methanol) for 1 h at 75°C. After cooling, fatty acid methyl esters (FAME) were extracted with 3 mL of water (to remove the catalyst-BF3) and 3 mL of petroleum ether. This step was repeated twice to improve FAMEs extraction. The upper organic layer was collected and the organic solvent was evaporated under nitrogen. FAME were dissolved in hexane and then transferred to 300 μL screw-capped vials to be analysed by gas chromatography with a flame ionization detector (GC-FID, Agilent Technologies, 7890D GC system) equipped
Acc
ep
ted
Art
icle
with a fused silica capillary column (Agilent Technologies: 30 m (length), 0.250 mm (inner diameter), 0.25 μm (film thickness)). Injection was conducted at a constant pressure and helium was used as carrier gas. Temperature programming was as follows: initial temperature of 140°C increased to 170°C at a rate of 6.5°C/min, then to 200°C at a rate of 2.75°C / min for 14 min, and finally to 230°C at a rate of 3°C / min for 12 min. FAME were identified by comparing chromatograms with standard references (37 components FAME mix, NHI-F fatty acid methyl ester mix, PUFA NO.2 animal source fatty acids, and a fatty acid methyl esters kit; Sigma-Aldrich, Canada).
2.4 Enzyme estimated activities
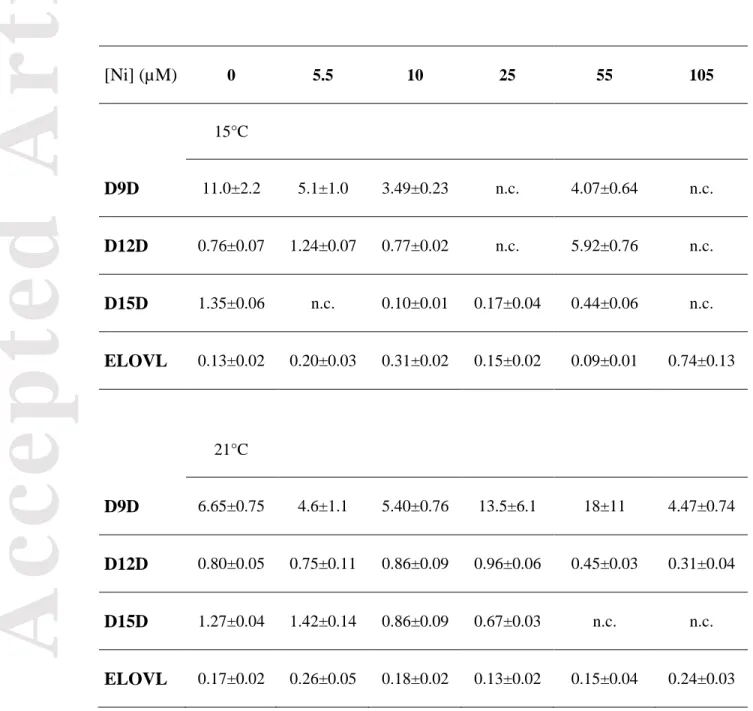
We used product/precursor ratios as surrogate indices (Fadhlaoui and Couture 2016) to estimate fatty acid desaturase and elongase activities in the biofilms. For this purpose, Δ9-desaturase (D9D: steroyl-CoA-desaturase) was estimated using the ratio 18:1n9/18:0, Δ12-desaturase (D12D) was estimated using the ratio 18:2n6/18:1n9, and Δ15-desaturase (D15D) was estimated based on the ratio 18:3n3/18:2n6. The index of elongase activity (ELOVL, Elongation of very long chain fatty acids) was calculated using the ratio 18:0/16:0.
2.4 Algal assemblage observations
A phylum/class-level assessment of algal composition was conducted to evaluate the major algal groups in the biofilms and to determine if important shifts in assemblage structure occurred along the Ni gradient. Observations were conducted on biofilms collected in five of the 12 mesocosms (control, 10, 25, 55 and 105 μM Ni). Two subsamples of each of the five biofilm samples collected were analysed
(pseudo-Acc
ep
ted
Art
icle
replicates) qualitatively by estimating the proportions of three main algal groups (diatoms, green algae, cyanobacteria). The number of cells composing each species of filamentous algae or colonial forms were estimated. Biofilm algal assemblages were observed under a microscope (Zeiss Axio Imager) at 400x magnification.
2.5 Statistical analysis
Data were expressed as mean ± SE (n = 6) and statistical analyses were conducted using JMP Pro 13 (SAS Institute Inc.). Two-way ANOVAs were conducted to test the effect of Ni concentration and temperature on Ni bioaccumulation and FA composition. Tukey-Kramer HSD tests were performed to further determine which Ni treatments showed significant differences. A Principal Component Analysis (PCA) was conducted to explore potential patterns in FA distribution as a function of Ni concentrations and temperature. The PCA was performed using Canoco 4.5 (Ter Braak and Smilauer 2002). Dose-response curves with the concentration resulting in a 50% reduction of the U/S ratio (unsaturated fatty acids/saturated fatty acids) expressed in term of free Ni2+ concentrations were calculated using the TRAP software (version 1.30; US EPA).
3. Results and Discussion
3.1 Ni bioaccumulation
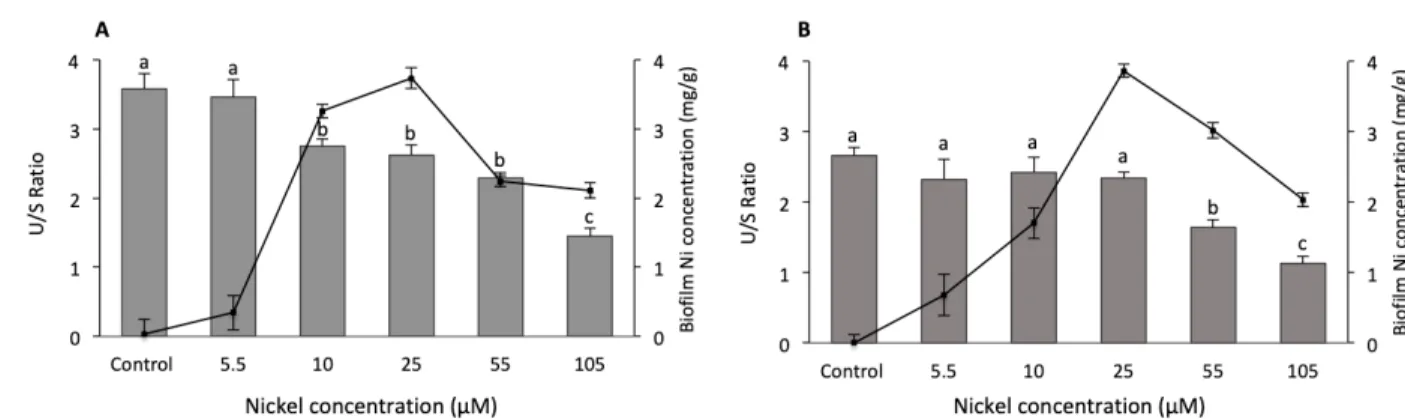
The concentrations of Ni accumulated in biofilms growing at 15 and 21°C at different Ni concentrations are provided in Fig 1. A two-way ANOVA showed that there was a significant interaction between the two stressors (Ni level x Temperature: F(5, 56) = 8.43, p<0.001) indicating that the effect of Ni concentration on bioaccumulation depended on
Acc
ep
ted
Art
icle
temperature, and vice-versa. One-way ANOVAs followed by multiple comparisons showed that Ni concentrations in the water had a significant effect on Ni bioaccumulation (Fig. 1). Both at 15 and 21°C, the accumulated Ni increased with Ni exposure concentration and reached the highest values at 25 μM Ni, followed by a marked decrease above 25 µM (Fig. 1). Several factors may explain the observed decrease in bioaccumulated Ni at high exposure concentrations: metal toxicity affecting essential functions (e.g., photosynthetic efficiency (Lambert et al. 2016), changes in biofilm composition that may affect metal accumulation (Cui et al. 2012), or increased tolerance to metals via changes in taxonomic composition toward more tolerant taxa (Soldo and Behra 2000). Alternatively, extracellular polymeric substances in the biofilm contain extracellular enzymes playing an important role in the assimilation of organic matter as a source of nutriment. The presence of metals may interfere with these enzymes, either by an effect on their activity or by inhibiting their production (Gil-Allue et al. 2015). We hypothesize that exposure to elevated Ni concentrations interfere with extracellular enzymes (effect on activity or production or by a combination of these two modes of action), leading to cellular death that may in turn explain the observed decline in metal bioaccumulation.
One-way ANOVAs with multiple comparisons showed that temperature only had a significant effect on bioaccumulated Ni at a concentration of 10 μM where internalized Ni concentrations were 3.26 ± 0.01 mg/g at 15°C and 1.70 ± 0.16 mg/g at 21°C. This finding, while observed only at 10 μM Ni, agrees with some previous studies. For example, Pesce et al. (2018) observed that after 4 weeks of exposure, copper content tended to decrease in biofilm following an increase in temperature (18 and 23°C).
Acc
ep
ted
Art
icle
Lambert et al. (2016) have however shown a reduction in Cu bioaccumulation with an increase in temperature (8 and 13°C vs 18 and 23°C) in biofilm exposed to copper during 6 weeks.
3.2 Effects of temperature and Ni on biofilm fatty acids
Palmitic acid (16:0), palmitoleic acid (16:1n7), oleic acid (18:1n9), linoleic acid (18:2n6) and linolenic acid (18:3n3) were the principal SFA, monounsaturated fatty acid (MUFA) and PUFA (Tables 2 and 3) extracted from the biofilm samples. These FA accounted for 82 ± 6 % and 77 ± 5 % of the total FA in our control conditions at 15 and 21°C, respectively. In previous studies, FA profiles were considered as chemotaxonomic markers to identify taxonomic groups, i.e., certain groups of organisms are characterized by specific FA. For example, it has been shown that green algae contained higher proportions of C18 PUFA such as 18:2n6 and 18:3n3 and lower proportions of C20 PUFA, while cyanobacteria were dominated by SFA and MUFA such as 16:0 and 18:1n9 (Lang et al. 2011; Ortiz et al. 2009). The FA profiles observed in our control biofilms suggest a dominance of cyanobacteria and green algae (Tables 2 and 3). The FA EPA, a long chain PUFA used as diatom biomarker (Zulu et al. 2018), was not detected in our biofilms. Observations made under the microscope confirmed that the biofilms were dominated by green algae and cyanobacteria, with very few live diatoms observed.
The results from the two-way ANOVA indicated an effect of Ni concentration and temperature on FA composition in the biofilm expressed as the ratio of unsaturated to saturated FA (Ni: F(5,58) = 41.04, p<0.001; Temperature: F(1,58) = 35.84, p<0.001). There was no significant interaction between the two stressors (Ni x Temperature: F(5,58) = 1.34;
Acc
ep
ted
Art
icle
p<0.26). In control biofilms, PUFA were more abundant than SFA (Fig. 2) and were dominated by 16:1n7, 18:1n9, 18:2n6 and 18:3n3 (Tables 2 and 3). The ratio of unsaturated to saturated FA varied with temperature and was higher at 15°C (Fig. 1). In particular, the n-9 UFA family was the most abundant unsaturated FA at 15°C, and decreased significantly at 21°C (p<0.05) (Tables 2 and 3). Previous studies have reported similar observations and demonstrated the effect of temperature on lipid composition in phytoplankton (Hixson and Arts 2016; Honeyfield and Maloney 2015). Renaud et al. (1995) found that diatom species responded to a decrease in temperature by an increase in PUFA, which in turns modifies membrane fluidity and cell integrity. For example, Jiang and Gao (2004) reported an increase in PUFA (mainly EPA) at a low temperature (10°C compared to 25°C) with a relative decrease in SFA in the marine diatom Phaeodactylum tricornutum. Temperature is an important environmental factor influencing the degree of unsaturation and plays a major role in the regulation of PUFA production, not only in microalgae (Renaud et al. 2002), but also in other organisms such as bacteria (Konneke and Widdel 2003), zooplankton (Gladyshev et al. 2011) and fish (Fadhlaoui and Couture 2016; Fadhlaoui et al. 2018). As reported by several authors studying various organisms, variations in lipid composition as a function of temperature is a key response to ensure different cellular functions and to maintain cellular structure (Sargent et al. 1995). Our results support these observations that decreasing PUFA following an increase in temperature can be an adaptive response and a protection against thermic stress (Jordan et al. 2001; Teoh et al. 2004).
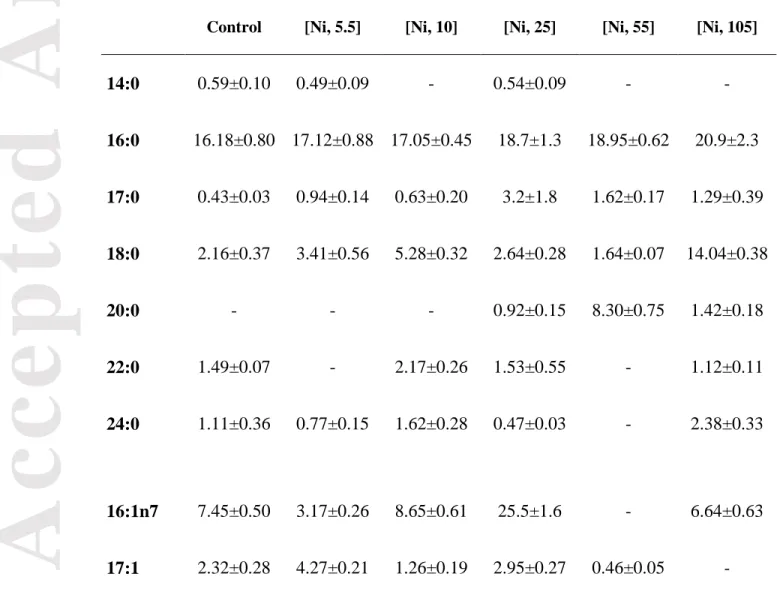
At 15°C, the modification in SFA was mainly characterized by an increase in 18:0 (nearly 6.5 fold higher at 105 μM Ni compared to control biofilm exposures) (Table 2). The
Acc
ep
ted
Art
icle
pronounced modification in the PUFA group was mostly due to a decrease in n-6 and n-3, highlighted by the absence of 18:3n3. These modifications in FA profiles are in agreement with previous studies. For example, Pinto et al. (2011) obtained similar conclusions with the red algae Gracilaria tenuistipitata exposed to copper and cadmium with an increase in SFA and MUFA and a decrease in PUFA. Chia et al. (2013) reported a significant decrease in total PUFAs, n-3 PUFAs and in the PUFA/SFA ratio in Chlorella vulgaris exposed to cadmium. Exposure to copper, zinc and cadmium altered FA profiles in the green algae Selenastrum capricornutum, leading to an increase in oleic acid (18:1n9) and a decrease in linoleic acid (18:3n3) and parinate (18:4) (McLarnon-Riches et al. 1998). Although PUFA tended to decrease along the Ni gradient (Fig. 2) in our study, a peak in 18:2n6 was surprisingly observed at an exposure concentration of 55 μM Ni. At 105 µM Ni, a sharp increase in n-9 MUFAs was observed (Table 2). Mohammady and Fathy (2007) studied the response of FA profiles in the microalgae Dunaliella salina and Nannochloropsis salina exposed to Ni and also reported an increase in C18:2 in exposed cells. In our study, the decrease in n-3 PUFA under Ni stress at 15°C, mainly due to a sharp decrease in 18:3n3, suggests an inhibition of the Δ15 desaturase that catalyzes the desaturation of 18:2n6 to 18:3n3 (Fig. 4).
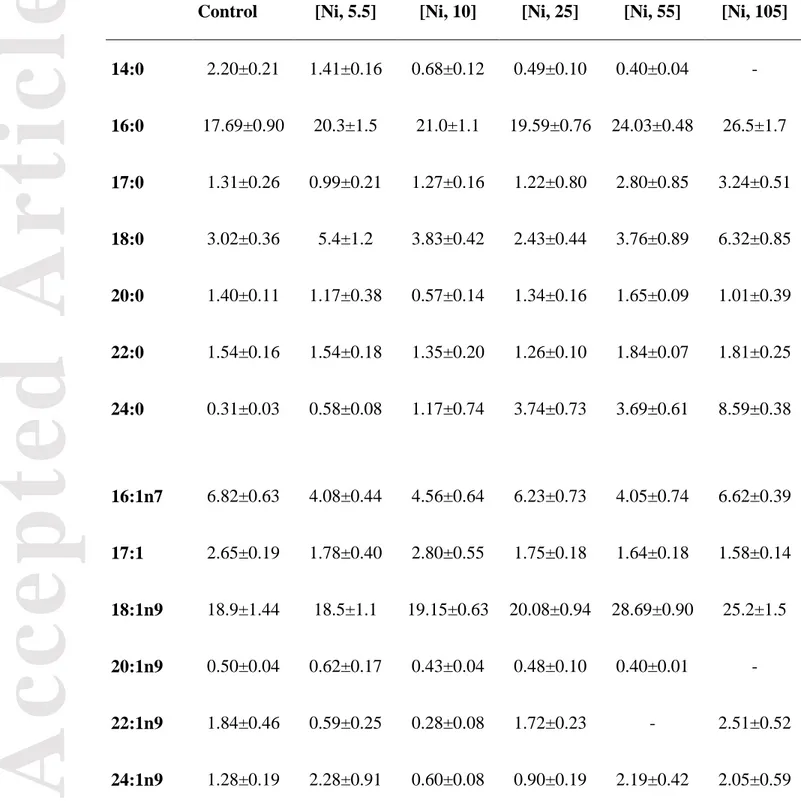
At 21°C, the increase in SFA in biofilms exposed to Ni was mainly due to an elevated proportion of 18:0, 17:0 and 16:0 (Table 3). The PUFA groups responded by a decreasing trend in n-3 PUFA compared to control biofilms, while n-6 PUFA were unchanged (except for a marked decrease at 105 μM Ni), and n-9 PUFA increased to reach the highest value at 55 μM Ni. The high proportion of n-9 PUFA was mostly due to an elevated percentage of 18:1n9, as we also observed at 15°C (Table 3). The decrease in n-6
Acc
ep
ted
Art
icle
and 3 PUFA with an increase in 9 PUFA at 21°C suggests an inhibition of 6 and n-3 elongase and desaturase pathways by the inhibition of Δ12 and Δ15 desaturase. The synthesis of PUFA at 21°C was inhibited at a lower Ni concentration compared to our 15°C experiment, suggesting that desaturases and elongases involved in C18 FA desaturation and elongation may be more sensitive to Ni exposure at a higher temperature.
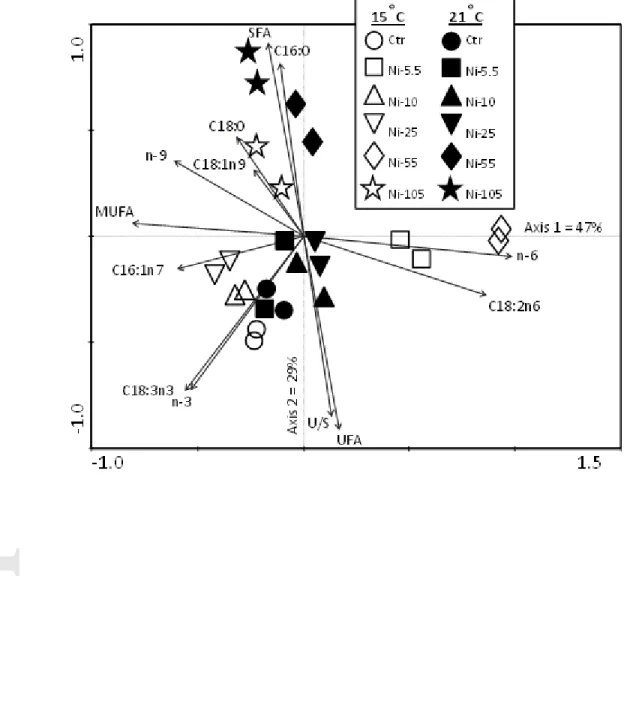
A PCA was conducted to further assist in defining patterns in biofilm FA composition as a response to Ni exposure concentration and temperature. To facilitate interpretation, the ordination was performed using FA groups (SFA, MUFA, n-9, n-6 and n-3 PUFA), the ratio of UFA to SFA (U/S) as well as certain common FA measured in our biofilms (16:0, 18:0, 16:1n7, 18:1n9, 18:2n6 and 18:3n3) combining the data from the 15 and 21°C experiments (Fig. 3). The analysis showed that the first axis accounted for 47% of the total variance. The group including the n-6 FA and more specifically C18:2n6 were strongly correlated with axis 1, mainly due to the peak in this FA under the 55 µM Ni, 15°C exposure condition. The second axis explained 29% of the variance and reflected a general increase in SFA and a decrease in the U/S ratio along the Ni gradient, both at 15 and 21°C. Samples from control conditions and samples exposed to 5.5, 10 and 25 µM Ni clustered together at the highest end of the U/S gradient reflecting larger proportion of unsaturated FA, both at 15 and 21°C. Biofilms exposed to elevated Ni concentrations (55 and 105 µM) clustered at the highest end of the saturated FA gradient, with the largest proportions of SFA measured at 21°C suggesting that the effect of Ni is exacerbated by a higher temperature. Samples from the two mesocosms exposed to 55 µM Ni at 15 and 21°C responded differently, where a sharp increase in C18:2n6 was observed as
Acc
ep
ted
Art
icle
previously mentioned. This suggests that the level of Ni exposure concentration induced a change in FA composition but was different than what was observed at 21°C for the same metal concentration.
3.3 Estimated enzymatic activities
As previously mentioned, desaturases and elongases are involved in FA synthesis. However, direct measurement of their activities was not conducted during this study. Thus, we used the common approach of product/precursor ratios as surrogate indices (Fadhlaoui and Couture 2016) to further examine their potential contribution to the observed modifications for the Ni-exposed biofilms at 15 and 21°C. Temperature had an effect on D9D activity, with a decrease at 21°C (Table 4). D9D is a key enzyme in FA unsaturation; it introduces double bonds at the C9-C10 positions. The higher activity of this enzyme at 15°C compared to that observed at 21°C corresponds to elevated proportions of MUFA. At 15°C, D9D, D12D and D15D estimated activities decreased along the Ni gradient and were fully inhibited at the highest exposure Ni concentration (105 μM Ni). However, at 55 µM Ni, the estimated activity of D12D was induced resulting in much higher values compared to the control condition. The increase in this enzyme supports the observed increase in 18:2n6 at 15°C as discussed above. We observed the same pattern at 21°C where the estimated activity of D9D and D12D decreased under Ni exposure, except for an increase in D9D at 25 and 55 μM Ni corresponding to a slight increase in 18:2n6. D15D estimated activity at 15°C was inhibited at the highest Ni exposure concentration. Nickel also affected ELOVL estimated activity that increased with exposure concentration. The calculated ELOVL index reflected the activity of elongases catalyzing the elongation of palmitic acid (18:0),
Acc
ep
ted
Art
icle
leading to the formation of stearic acid (18:0) (Fig. 5). The elevated activity estimated for this enzyme may reflect the observed increase in SFAs at 15°C as well as at 21°C when exposed to 105 µM Ni.
3.4 FA composition as a response to stress
Several studies have investigated the effect of Ni on the biota and have demonstrated that this metal can disturb cellular metabolic processes. The presence of Ni may indirectly trigger oxidative stress by disturbing the balance between formation and elimination of reactive oxygen species (ROS). Their formation is essential to different functions such as photosynthesis. However, excess ROS under stress conditions becomes problematic for cell functioning where ROS such as hydroxyl radical (·OH), superoxide anion (O2·−), singlet oxygen (O2.) and hydrogen peroxide (H2O2) can interact with macromolecules such as proteins, nucleic acids and lipids, inducing oxidative damages and thereby disturbing cellular functions (Halliwell and Gutteridge 1999). To palliate the metabolic negative effects, photosynthetic organisms reduce ROS concentrations through an enzymatic protective mechanism including antioxidant enzymes such as superoxide dismutase, catalase, ascorbate peroxidase, and low molecular weight compounds such as ascorbate, glutathione, tocopherols, carotenoids and osmolytes (proline and glycine betaine) (Das and Roychoudhury 2014; Sharma et al. 2019; Zuluaga et al. 2017). An increase in antioxidant capacity is usually associated with metal detoxification to reduce deleterious damages. However, at high Ni concentrations antioxidant enzyme activities were found to be low or inhibited (Siddiqui et al. 2011; Singh et al. 2012) causing an increase in lipid peroxidation and other irreversible damages to the cell. In our study, the observed decrease in PUFA may suggest impaired antioxidant capacities, resulting in an
Acc
ep
ted
Art
icle
increase in ROS leading to enhanced lipid peroxidation in Ni-exposed biofilms. Concurrently, ROS production may trigger other cellular responses through signalling pathways such as the activation of FA oxidation. The formation of oxygenated PUFA (oxylipins) may be initiated by ROS or catalyzed by enzymes such as lipoygenases, cytochrome P450 or cycloxygenase (Mosblech et al. 2009; Ritter et al. 2008). Based on our results, we hypothesized that the decrease in PUFA may be (1) the result of an oxidation process to produce oxylipins involved in systematic defensive mechanism under metal exposure, or (2) the result of lipoperoxidation under ROS overproduction. It is also possible that the observed changes in FA profiles in Ni-exposed cells reflect (3) a modification in the taxonomic composition of the biofilms. For example, Ni exposure may have resulted in a selection for resistant taxa with different FA composition leading to the observed modifications. Indeed, the phylum/class-level examination of the biofilm samples under the microscope suggests that, for both temperatures tested, the control and the 5.5 µM exposure conditions were dominated by cyanobacteria, while the other Ni-exposed mesocosms showed higher proportions of filamentous green algae. This difference in taxonomical composition may have a strong influence on the FA profiles, however, only qualitative assessment was conducted and no statistical analyses were conducted. Other studies demonstrated that metals affect lipid content in other biofilm components such as fungi, protozoa and bacteria (Kelly et al. 2003; Mortimer et al. 2011). The observed changes in our FA profiles may therefore also be the result of non-algal organisms changing in abundances. The biofilm collected in Nunavik was rich in diatoms but green algae and cyanobacteria became markedly dominant under our laboratory conditions prior to the Ni exposition. We believe that the changes in FA
Acc
ep
ted
Art
icle
composition observed in our experiment would have been more pronounced with diatom-rich biofilms with possible marked effects on EPA production and on overall PUFA.
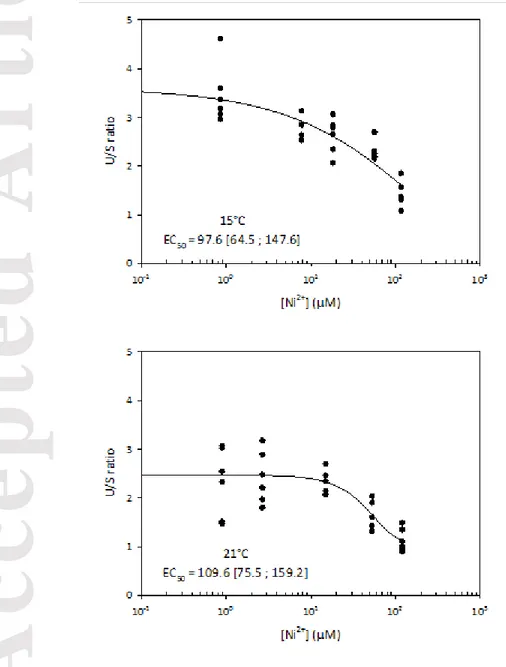
3.5 Dose-response curves and EC50
We used the U/S ratio as a toxic effect endpoint to calculate the 50% effective free Ni2+ concentration (EC50) at 15 and 21°C. Free nickel concentrations were used as they are known to be more representative of Ni bioavailability than total concentrations (Campbell and Fortin 2013; Leguay et al. 2016). The results showed that the U/S ratio decreased with the Ni gradient and highlighted an impact of Ni on FA profiles (Fig. 5). We calculated EC50s of 98 [65-150] and 110 [76-160] µM Ni2+ for 15 and 21°C respectively. The overlapping confidence intervals between the two curves suggest that temperature does not have a significant impact on the EC50s for the U/S ratio. This result is interesting because it shows that despite the fact that temperature had a significant impact on the U/S ratio (Figs. 1 and 5), the effect of Ni was similar at the two temperatures tested with comparable EC50s. It would be interesting to explore whether our EC50s are specific to our biofilm or whether they are applicable to other biofilms (i.e. different community composition or structure) and for other metals.
Conclusions
Several biofilm-based biomarkers/bioindicators have been used to assess environmental perturbations. For example, Chl-a fluorescence (Corcoll et al. 2011), photosynthetic activity (Berard et al. 2003), antioxidant enzymes (Bonnineau et al. 2013), microbial respiration (Tlili et al. 2011), DNA synthesis (Blanck et al. 2003), taxonomical or pigment composition (Kim Tiam et al. 2014; Lavoie et al. 2014; Schmitt-Jansen and
Acc
ep
ted
Art
icle
Altenburger 2008), diatom teratologies (Falasco et al. 2009; Lavoie et al. 2018; Morin et al. 2012) are endpoints commonly evaluated to explore the response of biofilms to stress. However, only a few studies have explored the response of biofilms in terms of their nutritional quality, and in particular using changes in their fatty acid profiles as a response to stress (Drerup and Vis 2018; Hill et al. 2011; Whorley et al. 2019; Whorley and Wehr 2018).
In the present study, we investigated the chronic effects of metals, combined to an increase in water temperature, on biofilm fatty acid composition and metal bioaccumulation. Studies have generally investigated the effects of temperature and metal exposure concentration separately or based on acute exposure and focused on organisms such as fishes and invertebrates or were conducted on monospecific algal cultures (e.g. Jiang and Gao (2004)). However, the interaction between these factors and the resulting multi-stress effects on biofilms at the base of aquatic food webs require additional investigation to more adequately quantify the response of the biota and to improve risk assessment for aquatic ecosystems. Our study provides evidence that an increase in temperature is accompanied by a decrease in the unsaturation degree in biofilm FA as a response to thermal stress. Nickel exposure also resulted in a decrease in PUFA, suggesting that the effects of these two stressors are additive. However, Ni bioaccumulation was similar for both tested temperatures.
Biofilms represent a key primary source of energy, particularly in lotic environments. FA are crucial for all organisms and are the most important molecules transferred across trophic levels (Kelly and Scheibling 2012). Their sensitivity to changes in environmental conditions makes them useful biomarkers to assess the effects of different stressors on
Acc
ep
ted
Art
icle
ecosystem health. Future studies should combine a more in-depth investigation of the structural modification in the biofilm taxonomic composition (bacteria, algae, fungi and protozoans) to better understand the mechanisms involved in the response of FA profiles to metal exposure and to thermal stress.
Acknowledgments--We would like to thank Caroline Doose for the biofilm artwork in the graphical abstract. Financial support from the Fonds de recherche du Québec–Nature et technologies (FRQNT) is gratefully acknowledged (grant number 2014-MI-183237). C. Fortin is supported by the Canada Research Chair program (grant number 950-231107). M. Fadhlaoui was supported by the Mine of Knowledge CREATE program.
Data Availability Statement— Data, associated metadata, and calculation tools are available from the corresponding author ([email protected]).
REFERENCES
Berard A, Dorigo U, Mercier I, Becker-van Slooten K, Grandjean D, Leboulanger C. 2003. Comparison of the ecotoxicological impact of the triazines irgarol 1051 and atrazine on microalgal cultures and natural microalgal communities in lake Geneva. Chemosph. 53(8):935-944. DOI: 10.1016/S0045-6535(03)00674-X
Blanck H, Admiraal W, Cleven RFMJ, Guasch H, van den Hoop MAGT, Ivorra N, Nystrom B, Paulsson M, Petterson RP, Sabater S et al. 2003. Variability in zinc tolerance, measured as incorporation of radio-labeled carbon dioxide and thymidine, in periphyton communities sampled from 15 european river stretches.
Acc
ep
ted
Art
icle
Arch of Envir Contam and Toxicol. 44(1):17-29. DOI: 10.1007/s00244-002-1258-4
Bonet B, Corcoll N, Guasch H. 2012. Antioxidant enzyme activities as biomarkers of zn pollution in fluvial biofilms. Ecotoxicol Environ Saf. 80:172-178. DOI: 10.1016/j.ecoenv.2012.02.024
Bonnineau C, Guasch H, Proia L, Ricart M, Geiszinger A, Romani AM, Sabater S. 2010. Fluvial biofilms: A pertinent tool to assess beta-blockers toxicity. Aquat Toxicol. 96(3):225-233. DOI: 10.1016/j.aquatox.2009.10.024
Bonnineau C, Tlili A, Faggiano L, Montuelle B, Guasch H. 2013. The use of antioxidant enzymes in freshwater biofilms: Temporal variability vs. Toxicological responses. Aquat Toxicol. 136:60-71. DOI: 10.1016/j.aquatox.2013.03.009
Campbell PGC, Fortin C. 2013. Biotic ligand model. In encyclopedia of aquatic ecotoxicology, férard, j.-f.; blaise, c., eds. Springer netherlands: Dordrecht. p. 237-246.
Carr GM, Morin A, Chambers PA. 2005. Bacteria and algae in stream periphyton along a nutrient gradient. Freshw Biol. 50(8):1337-1350. DOI: 10.1111/j.1365-2427.2005.01401.x
Chia MA, Lombardi AT, Melao MDG, Parrish CC. 2013. Effects of cadmium and nitrogen on lipid composition of chlorella vulgaris (Trebouxiophyceae, chlorophyta). Eur J Phycol. 48(1):1-11. DOI: 10.1080/09670262.2012.750687
Acc
ep
ted
Art
icle
Corcoll N, Bonet B, Leira M, Guasch H. 2011. Chl-a fluorescence parameters as biomarkers of metal toxicity in fluvial biofilms: An experimental study. Hydrobiol. 673(1):119-136. DOI: 10.1007/s10750-011-0763-8
Cui JG, Shan BQ, Tang WZ. 2012. Effect of periphyton community structure on heavy metal accumulation in mystery snail (Cipangopaludina chinensis): A case study of the bai river, China. J Environ Sci-China. 24(10):1723-1730. DOI: 10.1016/S1001-0742(11)60976-5
Dalsgaard J, St John M, Kattner G, Muller-Navarra D, Hagen W. 2003. Fatty acid trophic markers in the pelagic marine environment. Adv Mar Biol. 46:225-340. Doi DOI: 10.1016/S0065-2881(03)46005-7
Das k, Roychoudhury A. 2014. Reactive oxygen species (ros) and response of antioxidants as ros-scavengers during environmental stress in plants. Front Env Sci-Switz. 2.
Drerup SA, Vis ML. 2018. Seasonality of total fatty acid profiles in acid mine drainage impaired streams. Environ Monit Assess. 190(8). ARTN 467. DOI: 10.1007/s10661-018-6832-y
Fadhlaoui M, Couture P. 2016. Combined effects of temperature and metal exposure on the fatty acid composition of cell membranes, antioxidant enzyme activities and lipid peroxidation in yellow perch (Perca flavescens). Aquat Toxicol. 180:45-55. DOI: 10.1016/j.aquatox.2016.09.005
Acc
ep
ted
Art
icle
Fadhlaoui M, Pierron F, Couture P. 2018. Temperature and metal exposure affect membrane fatty acid composition and transcription of desaturases and elongases in Fathead minnow muscle and brain. Ecotoxicol Environ Saf. 148:632-643. DOI: 10.1016/j.ecoenv.2017.10.040
Falasco E, Bona F, Ginepro M, Hlubikova D, Hoffmann L, Ector L. 2009. Morphological abnormalities of diatom silica walls in relation to heavy metal contamination and artificial growth conditions. Water Sa. 35(5):595-606. DOI: 10.4314/wsa.v35i5.49185
Folch J, Lees M, Sloane Stanley GH. 1957. A simple method for the isolation and purification of total lipides from animal tissues. J Biol Chem. 226(1):497-509.
Fuschino JR, Guschina IA, Dobson G, Yan ND, Harwood JL, Arts MT. 2011. Rising water temperatures alter lipid dynamics and reduce n-3 essential fatty acid concentrations in scenedesmus obliquus (chlorophyta). J Phycol. 47(4):763-774. DOI: 10.1111/j.1529-8817.2011.01024.x
Gauthier C, Couture P, Pyle GG. 2006. Metal effects on fathead minnows (pimephales promelas) under field and laboratory conditions. Ecotoxicol Environ Saf. 63(3):353-364. 10. DOI: 1016/j.ecoenv.2005.03.019
Gil-Allue C, Schirmer K, Tlili A, Gessner MO, Behra R. 2015. Silver nanoparticle effects on stream periphyton during short-term exposures. Environ Sci Technol. 49(2):1165-1172. DOI: 10.1021/es5050166
Acc
ep
ted
Art
icle
Gladyshev MI, Semenchenko VP, Dubovskaya OP, Fefilova EB, Makhutova ON, Buseva ZF, Sushchik NN, Razlutskij VI, Lepskaya EV, Baturina MA et al. 2011. Effect of temperature on contents of essential highly unsaturated fatty acids in freshwater zooplankton. Limnologica. 41(4):339-347. DOI: 10.1016/j.limno.2011.03.001
Guasch H, Admiraal W, Sabater S. 2003. Contrasting effects of organic and inorganic toxicants on freshwater periphyton. Aquat Toxicol. 64(2):165-175. DOI: 10.1016/S0166-445x(03)00043-2
Gunn, J., Keller, W., Negusanti, J., Potvin, R., Beckett, P., Wlnterhalder, K., 1995. Ecosystem recovery after emission reductions: Sudbury, Canada Water, Air and Soil Poll 85: 1783-1788. DOI: 10.1007/BF00477238
Guo F, Bunn SE, Brett MT, Kainz MJ. 2017. Polyunsaturated fatty acids in stream food webs - high dissimilarity among producers and consumers. Freshwater Biol. 62(8):1325-1334. DOI: 10.1111/fwb.12956
Guo F, Kainz MJ, Sheldon F, Bunn SE. 2016. Effects of light and nutrients on periphyton and the fatty acid composition and somatic growth of invertebrate grazers in subtropical streams. Oecologia. 181(2):449-462. DOI: 10.1007/s00442-016-3573-x
Guschina IA, Harwood JL. 2006. Lipids and lipid metabolism in eukaryotic algae. Prog Lipid Res. 45(2):160-186. DOI: 10.1016/j.plipres.2006.01.001
Halliwell B, Gutteridge J. 1999. Free radicals in biology and medicine. Oxford: Oxford University Press.
Acc
ep
ted
Art
icle
Hill WR, Rinchard J, Czesny S. 2011. Light, nutrients and the fatty acid composition of stream periphyton. Freshwater Biol. 56(9):1825-1836. DOI: 10.1111/j.1365-2427.2011.02622.x
Hixson SM, Arts MT. 2016. Climate warming is predicted to reduce omega-3, long-chain, polyunsaturated fatty acid production in phytoplankton. Glob Chang Biol. 22(8):2744-2755. DOI: 10.1111/gcb.13295
Honeyfield DC, Maloney KO. 2015. Seasonal patterns in stream periphyton fatty acids and community benthic algal composition in six high-quality headwater streams. Hydrobio. 744(1):35-47. 1DOI: 0.1007/s10750-014-2054-7
Jiang HM, Gao KS. 2004. Effects of lowering temperature during culture on the production of polyunsaturated fatty acids in the marine diatom Phaeodactylum tricornutum (Bacillariophyceae). J Phycol. 40(4):651-654. DOI: 10.1111/j.1529-8817.2004.03112.x
Jordan P, Fromme P, Witt HT, Klukas O, Saenger W, Krauss N. 2001. Three-dimensional structure of cyanobacterial photosystem i at 2.5 angstrom resolution. Nat. 411(6840):909-917. DOI: 10.1038/35082000
Kelly JJ, Haggblom MM, Tate RL. 2003. Effects of heavy metal contamination and remediation on soil microbial communities in the vicinity of a zinc smelter as indicated by analysis of microbial community phospholipid fatty acid profiles. Biol Fert Soils. 38(2):65-71. DOI: 10.1007/s00374-003-0642-1
Acc
ep
ted
Art
icle
Kelly JR, Scheibling RE. 2012. Fatty acids as dietary tracers in benthic food webs. Marine Ecology Progress Series. 446:1-22. DOI: 10.3354/meps09559
Kim Tiam SK, Morin S, Pesce S, Feurtet-Mazel A, Moreira A, Gonzalez P, Mazzella N. 2014. Environmental effects of realistic pesticide mixtures on natural biofilm communities with different exposure histories. Sci Total Environ. 473:496-506. DOI: 10.1016/j.scitotenv.2013.12.060
Konneke M, Widdel F. 2003. Effect of growth temperature on cellular fatty acids in sulphate-reducing bacteria. Environmental Microbiology. 5(11):1064-1070. DOI: 10.1046/j.1462-2920.2003.00499.x
Lambert AS, Dabrin A, Morin S, Gahou J, Foulquier A, Coquery M, Pesce S. 2016. Temperature modulates phototrophic periphyton response to chronic copper exposure. Environ Pollut. 208:821-829. 1DOI: 0.1016/j.envpol.2015.11.004
Lang IK, Hodac L, Friedl T, Feussner I. 2011. Fatty acid profiles and their distribution patterns in microalgae: A comprehensive analysis of more than 2000 strains from the sag culture collection. Bmc Plant Biology. 11. Artn 124. DOI: 10.1186/1471-2229-11-124
Lavoie I, Campeau S, Zugic-Drakulic N, Winter JG, Fortin C. 2014. Using diatoms to monitor stream biological integrity in eastern Canada: An overview of 10 years of index development and ongoing challenges. Sci Total Environ. 475:187-200. DOI: 10.1016/j.scitotenv.2013.04.092
Acc
ep
ted
Art
icle
Lavoie I, Lavoie M, Fortin C. 2012. A mine of information: Benthic algal communities as biomonitors of metal contamination from abandoned tailings. Sci Total Environ. 425:231-241. DOI: 10.1016/j.scitotenv.2012.02.057
Lavoie I, Morin S, Laderriere V, Fortin C. 2018. Freshwater diatoms as indicators of combined long-term mining and urban stressors in junction creek (Ontario, Canada). Environments. 5(2). ARTN 30. DOI: 10.3390/environments5020030
Lavoie I, Morin S, Laderriere V, Paris LE, Fortin C. 2019. Assessment of diatom assemblages in close proximity to mining activities in Nunavik, Northern Quebec (Canada). Enviro. 6(6). ARTN 74. DOI: 10.3390/environments6060074
Lawrence JR, Swerhone GDW, Wassenaar LI, Neu TR. 2005. Effects of selected pharmaceuticals on riverine biofilm communities. Can J Microbiol. 51(8):655-669. DOI: 10.1139/W05-047
Leguay S, Lavoie I, Levy JL, Fortin C. 2016. Using biofilms for monitoring metal contamination in lotic ecosystems: The protective effects of hardness and ph on metal bioaccumulation. Environ Toxicol Chem. 35(6):1489-1501. DOI: 10.1002/etc.3292
Li XC, Fan X, Han LJ, Lou QX. 2002. Fatty acids of some algae from the bohai sea. Phytochemistry. 59(2):157-161. DOI: 10.1016/S0031-9422(01)00437-X
McLarnon-Riches CJ, Rolph CE, Greenway DLA, Robinson PK. 1998. Effects of environmental factors and metals on Selenastrum capricornutum lipids. Phytochemistry. 49(5):1241-1247. Doi 10.1016/S0031-9422(98)00095-8
Acc
ep
ted
Art
icle
Mohammady NG, Fathy AA. 2007. Humic acid mitigates viability reduction, lipids and fatty acids of Dunaliella salina and Nannochloropsis salina grown under nickel stress. International Journal of Botany. 3(1):64-70. DOI: 10.3923/ijb.2007.64.70
Monroig O, Kabeya N. 2018. Desaturases and elongases involved in polyunsaturated fatty acid biosynthesis in aquatic invertebrates: A comprehensive review. Fish Sci. 84(6):911-928. DOI: 10.1007/s12562-018-1254-x
Morel FMM, Westall JC, Reuter JG, Chaplick JP. 1975. Description of the algal growth media “aquil” and “fraquil.” technical report 16. Cambridge: Massachusetts Institute of Technology Technical Report 16.
Morin S, Chaumet B, Mazzella N. 2018. A time-dose response model to assess diuron-induced photosynthesis inhibition in freshwater biofilms. Front Env Sci-Switz. 6. ARTN 131. DOI: 10.3389/fenvs.2018.00131
Morin S, Cordonier A, Lavoie I, Arini A, Blanco S, Duong TT, Tornés E, Bonet B, Corcoll N, Faggiano L et al. 2012. Consistency in diatom response to metalcontaminated environments. In: Guasch, h., ginebreda geiszinger, a.A. (eds.), emerging and priority pollutants in rivers.. In: Chem HE, editor. Springer. Heidelberg: Hdb Env Chem. p. 117–146.
Mortimer M, Kasemets K, Vodovnik M, Marinsek-Logar R, Kahru A. 2011. Exposure to cuo nanoparticles changes the fatty acid composition of protozoa Tetrahymena thermophila. Environ Sci Technol. 45(15):6617-6624. DOI: 10.1021/es201524q
Acc
ep
ted
Art
icle
Mosblech A, Feussner I, Heilmann I. 2009. Oxylipins: Structurally diverse metabolites from fatty acid oxidation. Plant Physiol Bioch. 47(6):511-517. DOI: 10.1016/j.plaphy.2008.12.011
OCCIAR. 2015. An overview of canada’s changing climate: An ontario perspective ontario centre for climate impacts and adaptation resources (occiar).
Ortiz J, Uquiche E, Robert P, Romero N, Quitral V, Llanten C. 2009. Functional and nutritional value of the chilean seaweeds codium fragile, gracilaria chilensis and macrocystis pyrifera. Eur J Lipid Sci Tech. 111(4):320-327. DOI: 10.1002/ejlt.200800140
Pesce S, Lambert AS, Morin S, Foulquier A, Coquery M, Dabrin A. 2018. Experimental warming differentially influences the vulnerability of phototrophic and heterotrophic periphytic communities to copper toxicity. Front in Microbiol. 9. ARTN 1424. DOI: 10.3389/fmicb.2018.01424
Pinto E, Carvalho AP, Cardozo KHM, Malcata FX, dos Anjos FM, Colepicolo P. 2011. Effects of heavy metals and light levels on the biosynthesis of carotenoids and fatty acids in the macroalgae Gracilaria tenuistipitata (var. Liui zhang & xia). Rev Bras Farmacogn. 21(2):349-354. DOI: 10.1590/S0102-695x2011005000060
Renaud SM, Thinh LV, Lambrinidis G, Parry DL. 2002. Effect of temperature on growth, chemical composition and fatty acid composition of tropical australian microalgae grown in batch cultures. Aquacul. 211(1-4):195-214. DOI: 10.1016/S0044-8486(01)00875-4
Acc
ep
ted
Art
icle
Renaud SM, Zhou HC, Parry DL, Thinh LV, Woo KC. 1995. Effect of temperature on the growth, total lipid content and fatty acid composition of recently isolated tropical microalgae Isochrysis sp, Nitzschia closterium, Nitzschia paleacea, and commercial species isochrysis sp (clone t iso). J Appl Phycol. 7(6):595-602. DOI: 10.1007/Bf00003948
Rex L. Lowe and Gina D. LaLiberte, 2017. Benthic Stream Algae: Distribution and Structure. In: Methods in Stream Ecology Volume 2: Ecosystem Function Third Edition Edited by Gary A. Lamberti and F. Richard Hauer Academic Press
Ritter A, Goulitquer S, Salaun JP, Tonon T, Correa JA, Potin P. 2008. Copper stress induces biosynthesis of octadecanoid and eicosanoid oxygenated derivatives in the brown algal kelp Laminaria digitata. New Phytol. 180(4):809-821. DOI: 10.1111/j.1469-8137.2008.02626.x
Sabater S, Guasch H, Ricart M, Romani A, Vidal G, Klunder C, Schmitt-Jansen M. 2007. Monitoring the effect of chemicals on biological communities. The biofilm as an interface. Anal Bioanal Chem. 387(4):1425-1434. DOI: 10.1007/s00216-006-1051-8
Sargent JR, Bell JG, Bell MV, Henderson RJ, Tocher DR. 1995. Requirement criteria for essential fatty acids. J Appl Ichthyol. 11(3-4):183-198. DOI: 10.1111/j.1439-0426.1995.tb00018.x
Acc
ep
ted
Art
icle
Schmitt-Jansen M, Altenburger R. 2008. Community-level microalgal toxicity assessment by multiwavelength-excitation pam fluorometry. Aquat Toxicol. 86(1):49-58. DOI: 10.1016/j.aquatox.2007.10.001
Sharma A, Shahzad B, Kumar V, Kohli SK, Sidhu GPS, Bali AS, Handa N, Kapoor D, Bhardwaj R, Zheng BS. 2019. Phytohormones regulate accumulation of osmolytes under abiotic stress. Biomolecules. 9(7). ARTN 285. DOI: 10.3390/biom9070285
Sharma KK, Schuhmann H, Schenk PM. 2012. High lipid induction in microalgae for biodiesel production. Energies. 5(5):1532-1553. DOI: 10.3390/en5051532
Siddiqui MH, Al-Whaibi MH, Basalah MO. 2011. Interactive effect of calcium and gibberellin on nickel tolerance in relation to antioxidant systems in Triticum aestivum l. Protoplasma. 248(3):503-511. DOI: 10.1007/s00709-010-0197-6
Singh G, Rajneesh KA, Reshma RS, M A. 2012. Effect of lead and nickel toxicity on chlorophyll and proline content of urd (Vigna mungo L.) seedlings. Interna J of Plant Physiol and Biochem 6:136-141.
Soldo D, Behra R. 2000. Long-term effects of copper on the structure of freshwater periphyton communities and their tolerance to copper, zinc, nickel and silver. Aquatic Toxicology. 47(3-4):181-189. DOI: 10.1016/S0166-445x(99)00020-X
Teoh ML, Chu WL, Marchant H, Phang SM. 2004. Influence of culture temperature on the growth, biochemical composition and fatty acid profiles of six antarctic microalgae. J Appl Phycol. 16(6):421-430. DOI: 10.1007/s10811-005-5502-y
Acc
ep
ted
Art
icle
Ter Braak CJF, Smilauer P. 2002. Canoco reference manual and canodraw for windows user’s guide: Software for canonical community ordination (version 4.5). Biometris, Wageningen.
Tlili A, Corcoll N, Bonet B, Morin S, Montuelle B, Berard A, Guasch H. 2011. In situ spatio-temporal changes in pollution-induced community tolerance to zinc in autotrophic and heterotrophic biofilm communities. Ecotoxicol. 20(8):1823-1839. DOI; 10.1007/s10646-011-0721-2
Tocher DR. 2003. Metabolism and functions of lipids and fatty acids in teleost fish. Rev Fish Sci. 11(2):107-184. DOI: 10.1080/713610925
Twining CW, Brenna JT, Hairston NG, Flecker AS. 2016. Highly unsaturated fatty acids in nature: What we know and what we need to learn. Oikos. 125(6):749-760. DOI: 10.1111/oik.02910
Whorley SB, Smucker NJ, Kuhn A, Wehr JD. 2019. Urbanisation alters fatty acids in stream food webs. Freshwater Biol. 64(5):984-996. DOI: 10.1111/fwb.13279
Whorley SB, Wehr JD. 2018. Multiyear patterns in benthic algal fatty-acid compounds under agricultural stress. Freshw Sci. 37(3):534-550. DOI: 10.1086/699201
Winterhalder K. 1995. Early History of Human Activities in the Sudbury Area and Ecological Damage to the Landscape. In: Gunn J.M. (eds) Restoration and Recovery of an Industrial Region. Springer Series on Environmental Management. Springer, New York, NY
Acc
ep
ted
Art
icle
Yi ZQ, Xu MN, Di XX, Brynfolfsson S, Fu WQ. 2017. Exploring valuable lipids in diatoms. Front Mar Sci. 4. UNSP 17. DOI: 10.3389/fmars.2017.00017
Zulu NN, Zienkiewicz K, Vollheyde K, Feussner I. 2018. Current trends to comprehend lipid metabolism in diatoms. Prog Lipid Res. 70:1-16. DOI: 10.1016/j.plipres.2018.03.001
Zuluaga M, Gueguen V, Pavon-Djavid G, Letourneur D. 2017. Carotenoids from microalgae to block oxidative stress. Bioimpacts. 7(1):1-3. DOI: 10.15171/bi.2017.01
Figure 1: Ratios of unsaturated fatty acid to saturated fatty acid (U/S) (bars) and Ni
accumulated in biofilms (mg/g dry weight) (lines) at (A) 15°C and (B) 21°C as a function of Ni exposure concentration (µM). Letters represent significant differences among Ni exposure conditions.
Acc
ep
ted
Art
icle
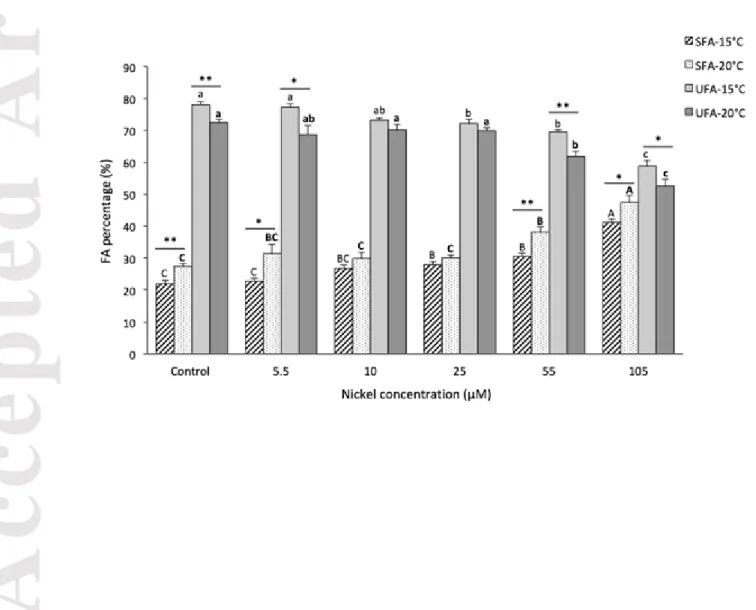
Figure 2: Biofilm fatty acid composition (% of total biofilm fatty acids) at 15°C and
21°C as a function of Ni exposure concentration (µM). Saturated fatty acids (SFA) and unsaturated fatty acids (UFA, includes monounsaturated and polyunsaturated acids). Bars represent the mean (± SEM) of each fatty acid group (n=6, except control condition n=4). Letters represent significant differences between Ni exposure conditions. Asterisks indicate significant differences between FA groups at 15°C and 21°C (*p < 0.05, ** p < 0.01)
Acc
ep
ted
Art
icle
Figure 3: Principal Component Analysis (PCA) of biofilm fatty acid composition over
Acc
ep
ted
Art
icle
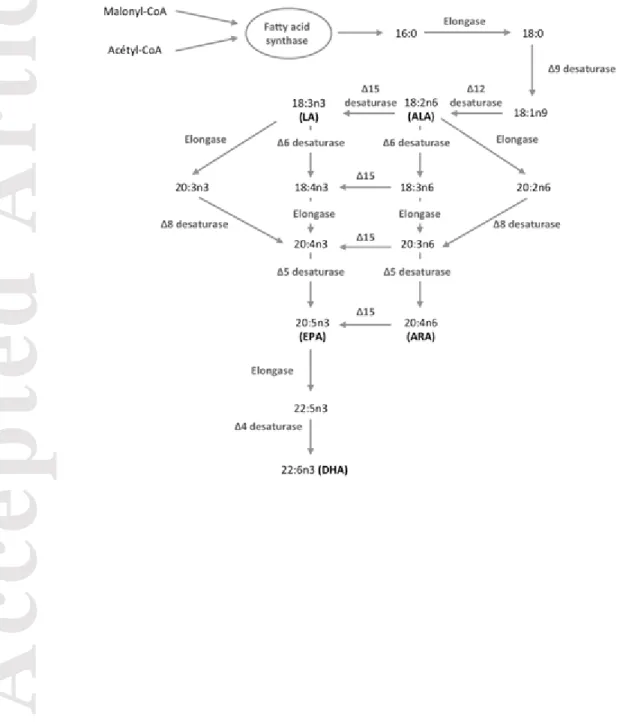
Figure 4: PUFA pathway synthesis in algae by desaturation and elongation (modified
from (Guschina and Harwood 2006)). Linolenic acid (18:3n3), linoleic acid (18:2n6), arachidonic acid (20:4n6), eicosapentaenoic acid (20:5n3) and docosahexaenoic acid (22:6n3)
Acc
ep
ted
Art
icle
Figure 5: Unsaturated/saturated fatty acid ratio (U/S) obtained after 28 days of exposure
as a function of free Ni2+ concentrations at 15°C and 21°C. The concentration resulting in 50% reduction of the U/S ratio expressed as Ni2+ concentrations were calculated using TRAP software (version 1.30; US EPA). The EC50 values are not significantly different from each other due to overlapping 95% confidence intervals.
Acc
ep
ted
Art
icle
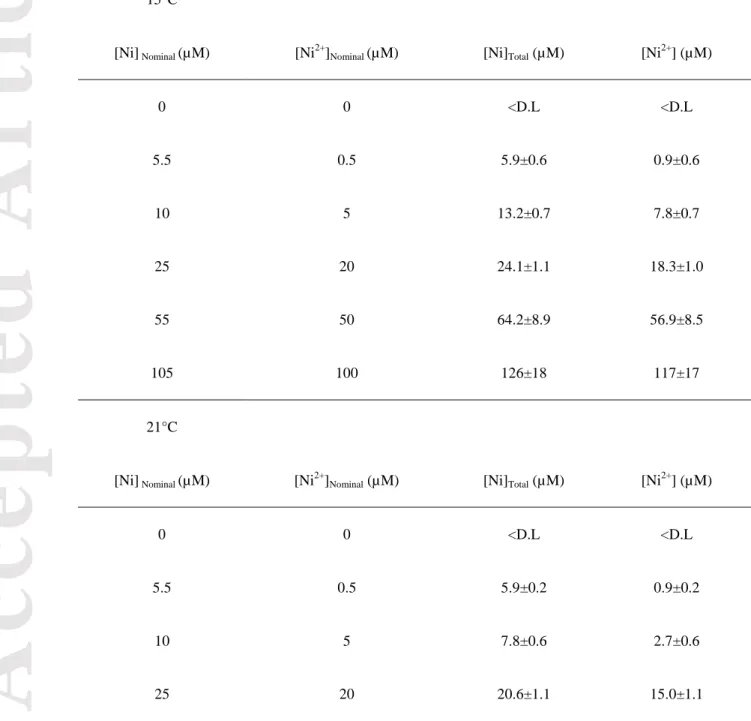
Table 1: Total nominal and measured Ni concentrations along with their respective
calculated free concentrations in Fraquil medium (15°C and 21°C). All values are expressed in µM. Detection Limit (D.L = 3.5 nM)
15°C
[Ni] Nominal (µM) [Ni2+]Nominal (µM) [Ni]Total (µM) [Ni2+] (µM)
0 0 <D.L <D.L 5.5 0.5 5.9±0.6 0.9±0.6 10 5 13.2±0.7 7.8±0.7 25 20 24.1±1.1 18.3±1.0 55 50 64.2±8.9 56.9±8.5 105 100 126±18 117±17 21°C
[Ni] Nominal (µM) [Ni2+]Nominal (µM) [Ni]Total (µM) [Ni2+] (µM)
0 0 <D.L <D.L
5.5 0.5 5.9±0.2 0.9±0.2
10 5 7.8±0.6 2.7±0.6
Acc
ep
ted
Art
icle
55 50 60.6±8.5 53.4±8.1 105 100 131±20 121±19Table 2: Fatty acid composition of the biofilms exposed to increasing Ni concentrations
(µM) at 15°C. Values are shown as % mean ± SEM for each condition (n=6, except control condition n=4).
Control [Ni, 5.5] [Ni, 10] [Ni, 25] [Ni, 55] [Ni, 105]
14:0 0.59±0.10 0.49±0.09 - 0.54±0.09 - - 16:0 16.18±0.80 17.12±0.88 17.05±0.45 18.7±1.3 18.95±0.62 20.9±2.3 17:0 0.43±0.03 0.94±0.14 0.63±0.20 3.2±1.8 1.62±0.17 1.29±0.39 18:0 2.16±0.37 3.41±0.56 5.28±0.32 2.64±0.28 1.64±0.07 14.04±0.38 20:0 - - - 0.92±0.15 8.30±0.75 1.42±0.18 22:0 1.49±0.07 - 2.17±0.26 1.53±0.55 - 1.12±0.11 24:0 1.11±0.36 0.77±0.15 1.62±0.28 0.47±0.03 - 2.38±0.33 16:1n7 7.45±0.50 3.17±0.26 8.65±0.61 25.5±1.6 - 6.64±0.63 17:1 2.32±0.28 4.27±0.21 1.26±0.19 2.95±0.27 0.46±0.05 -
Acc
ep
ted
Art
icle
18:1n9 21.5±1.8 14.82±0.83 18.08±0.51 - 6.51±0.82 15.10±0.85 20:1n9 0.40±0.05 3.93±0.21 1.86±0.82 3.32±0.19 22:1n9 3.82±0.90 2.74±0.19 7.9±1.7 18.82±0.91 3.12±0.47 - 24:1n9 2.23±0.65 1.85±0.59 2.27±0.48 0.59±0.09 3.51±0.70 9.42±0.58 18:2n6 15.97±0.46 18.21±0.74 14.0±0.44 10.01±0.81 35.6±1.6 14.8±2.9 20:2n6 1.40±0.26 1.76±0.25 - - 5.00±0.47 - 18:3n3 21.5±1.3 - 1.37±0.13 1.49±0.18 15.3±1.2 - 18:3n6 1.38±0.32 26.5±1.1 19.74±0.37 11.0±1.3 - 9.5±1.8 Σn-9 28.0±1.1 23.34±0.81 28.2±1.4 21.3±1.6 13.14±0.87 27.84±0.93 Σn-6 18.74±0.73 46.5±1.4 15.36±0.48 11.51±0.73 55.88±0.57 14.8±3.1 Σn-3 21.5±1.3 - 19.74±0.37 11.0±1.4 - 9.5±1.9Acc
ep
ted
Art
icle
Table 3: Fatty acid composition of the biofilms exposed to increasing Ni concentrations
(µM) at 21°C. Values are shown as % mean ± SEM for each condition (n=6).
Control [Ni, 5.5] [Ni, 10] [Ni, 25] [Ni, 55] [Ni, 105]
14:0 2.20±0.21 1.41±0.16 0.68±0.12 0.49±0.10 0.40±0.04 - 16:0 17.69±0.90 20.3±1.5 21.0±1.1 19.59±0.76 24.03±0.48 26.5±1.7 17:0 1.31±0.26 0.99±0.21 1.27±0.16 1.22±0.80 2.80±0.85 3.24±0.51 18:0 3.02±0.36 5.4±1.2 3.83±0.42 2.43±0.44 3.76±0.89 6.32±0.85 20:0 1.40±0.11 1.17±0.38 0.57±0.14 1.34±0.16 1.65±0.09 1.01±0.39 22:0 1.54±0.16 1.54±0.18 1.35±0.20 1.26±0.10 1.84±0.07 1.81±0.25 24:0 0.31±0.03 0.58±0.08 1.17±0.74 3.74±0.73 3.69±0.61 8.59±0.38 16:1n7 6.82±0.63 4.08±0.44 4.56±0.64 6.23±0.73 4.05±0.74 6.62±0.39 17:1 2.65±0.19 1.78±0.40 2.80±0.55 1.75±0.18 1.64±0.18 1.58±0.14 18:1n9 18.9±1.44 18.5±1.1 19.15±0.63 20.08±0.94 28.69±0.90 25.2±1.5 20:1n9 0.50±0.04 0.62±0.17 0.43±0.04 0.48±0.10 0.40±0.01 - 22:1n9 1.84±0.46 0.59±0.25 0.28±0.08 1.72±0.23 - 2.51±0.52 24:1n9 1.28±0.19 2.28±0.91 0.60±0.08 0.90±0.19 2.19±0.42 2.05±0.59
Acc
ep
ted
Art
icle
18:2n6 14.79±0.32 13.4±1.4 19.6±1.5 18.99±0.72 12.84±0.84 7.8±1.1 20:2n6 0.32±0.01 - - - - - 22:2n6 1.75±0.46 1.47±0.29 1.04±0.12 1.43±0.35 4.85±0.64 3.19±0.28 18:3n3 18.86±0.76 18.4±1.5 16.4±1.3 12.75±0.47 - - 18:3n6 1.41±0.23 4.5±1.4 2.72±0.67 3.78±0.46 4.13±0.69 - 20:3n3 1.05±0.13 0.75±0.16 0.67±0.05 - - - 20:3n6 2.39±0.21 2.29±0.64 1.86±0.34 1.82±0.08 3.04±0.13 3.60±0.50 Σn-9 22.5±1.5 22±2.0 20.46±0.64 23.18±0.90 31.3±1.0 29.8±2.0 Σn-6 20.66±0.70 21.66±0.89 25.2±1.9 26.01±0.67 24.9±1.4 14.6±1.3 Σn-3 19.91±0.78 19.1±1.6 17.1±1.3 12.75±0.47 - -Acc
ep
ted
Art
icle
Table 4: Estimated fatty acid desaturase and elongase activities in biofilms from different
exposure conditions. Values are shown as % mean ± SEM for each condition (n=6, except control condition n=4; n.c.= not calculated due to the absence of either the precursor or the product). D9D: Δ9-desaturase (steroyl-CoA-desaturase, 18:1n9/18 :0); D12D: Δ12-desaturase (18:2n6/18:1n9); D15D: Δ15-desaturase (18:3n3/18:2n6) and elongase: ELOVL (18:0/16:0). [Ni] (µM) 0 5.5 10 25 55 105 15°C D9D 11.0±2.2 5.1±1.0 3.49±0.23 n.c. 4.07±0.64 n.c. D12D 0.76±0.07 1.24±0.07 0.77±0.02 n.c. 5.92±0.76 n.c. D15D 1.35±0.06 n.c. 0.10±0.01 0.17±0.04 0.44±0.06 n.c. ELOVL 0.13±0.02 0.20±0.03 0.31±0.02 0.15±0.02 0.09±0.01 0.74±0.13 21°C D9D 6.65±0.75 4.6±1.1 5.40±0.76 13.5±6.1 18±11 4.47±0.74 D12D 0.80±0.05 0.75±0.11 0.86±0.09 0.96±0.06 0.45±0.03 0.31±0.04 D15D 1.27±0.04 1.42±0.14 0.86±0.09 0.67±0.03 n.c. n.c. ELOVL 0.17±0.02 0.26±0.05 0.18±0.02 0.13±0.02 0.15±0.04 0.24±0.03