INVESTIGATING GENERIC AND BRAND NAME
PHARMACEUTICAL’S MARKET SHARES
AND PRICES IN TUNISIA
Ines Ayadi, Houssem Eddine Chebbi and Younes Boujelbene
Working Paper 497
July 2009
Send correspondence to: Houssem Eddine CHEBBI
Faculty of Economic Sciences and Management of Nabeul (FSEGN), Tunisia. E-mail: chebbihe@planet.tn
Abstract
The purpose of this paper is to investigate how the brand name’s market shares in Tunisia are affected by generic competition during the pre-reform period of the Tunisian health insurance system following the methodological approach developed by Aronsson et al. (2001). In this study we use data for three molecules Captopril (antihypertensive) Glibenclamide (antidiabetic) and Carbamazepine (antiepileptic) from IMS Health database. The data span from the third quarter 2002 to second quarter 2007. Statistical results indicate that the impact of generic competition seems to be not different across markets (Captopril, Glibenclamide and Carbamazepine) in Tunisia. In addition, the relative price has a positive and significant effect on the change of market share of the brand name drug in Tunisia for the three active molecules. The higher the price of the brand name product relative to the average price of the generic substitutes, the smaller the decrease of market share of the brand name product. In Tunisian pharmaceutical market, brand- names charge a higher price than their generic versions and still obtain positive market shares. Thus, from a policy perspective, the large market share of higher priced brand-names relative to their generic versions is an unsatisfactory outcome taking into account that brand name drug and generics are identical products and provide similar health gains to patients.
ﺺﺨﻠﻣ
ﻞﺒﻗ ﺎﻣ ةﺮﺘﻓ لﻼﺧ قﻮﺴﻟا ﻲﻓ ﺔﺴﻓﺎﻨﻤﻟﺎﺑ ﺲﻧﻮﺗ ﻲﻓ ٍﺔﻨﻴﻌﻣ ٍﺔآرﺎﻤﻟ قﻮﺴﻟا ﺔﺼﺣ ﺮﺛﺄﺗ ﺔﻴﻔﻴآ ﻲﻓ ﺚﺤﺒﻟا ﻰﻟإ ﺔﻗرﻮﻟا ﻩﺬه فﺪﻬﺗ لأ ىإ نﻮﺴﻧورأ ﺎهﺮﻳﻮﻄﺘﺑ مﺎﻗ ٍﺔﻴﺠﻬﻨﻣ ٍﺔﻘﻳﺮﻃ ءﻮﺿ ﻲﻓ ﻲﺴﻧﻮﺘﻟا ﻲﺤﺼﻟا ﻦﻴﻣﺄﺘﻟا عﺎﻄﻗ ﻲﻓ حﻼﺻﻹا ) 2001 .( ﻩﺬه ﻲﻓو تﺎﺌﻳﺰﺟ ثﻼﺛ ﻦﻋ ٍتﺎﻧﺎﻴﺑ مﺪﺨﺘﺴﻧ ﺔﺳارﺪﻟا ﻞﻳﺮﺑﻮﺘﺑﺎآ ﺮﻴﻗﺎﻘﻋ ﻦﻣ ) ﻲﻧﺎﻳﺮﺸﻟا مﺪﻟا ﻂﻐﻀﻟ دﺎﻀﻤﻟا ( ﺪﻴﻣﻼﻜﻨﺒﻴﻠﺟو ) ﺞﻟﺎﻌﻤﻟا ﺮﻜﺴﻟا ضﺮﻤﻟ ( ﻦﻴﺑزﺎﻣﺎﺑرﺎآو ) عﺮﺼﻟا ضﺮﻤﻟ ﺞﻟﺎﻌﻤﻟا ( ﺚﻠﻴه مإ سإ ىأ ﺔآﺮﺷ تﺎﻧﺎﻴﺑ ةﺪﻋﺎﻗ ﻦﻣ تﺎﻧﺎﻴﺒﻟا ﻚﻠﺗ تﺬﺧأ ﺚﻴﺣ ﺎﻴﺒﻟا ﻩﺬه ﻲﻄﻐﺗو ﺔﻴﺤﺼﻟا ﺔﻳﺎﻋﺮﻟاو ﺔﻟﺪﻴﺼﻟا لﺎﺠﻣ ﻲﻓ ةرﺎﺸﺘﺳﻻاو تﺎﻣﻮﻠﻌﻤﻟا ﺪﻳوﺰﺘﺑ ﺔﻴﻨﻌﻤﻟا ﺚﻟﺎﺜﻟا ﻊﺑﺮﻟا ﻦﻣ ةﺮﺘﻔﻟا تﺎﻧ مﺎﻌﻠﻟ 2002 مﺎﻌﻟا ﻦﻣ ﻲﻧﺎﺜﻟا ﻊﺑﺮﻟا ﻰﻟإ 2007 . ﻊﻴﻤﺟ ﻲﻓ ﺔﻔﻠﺘﺨﻣ وﺪﺒﺗ ﺔﻴﻗﻮﺴﻟا ﺔﺴﻓﺎﻨﻤﻟا ﺮﻴﺛﺄﺗ نأ ﺔﻴﺋﺎﺼﺣﻹا ﺞﺋﺎﺘﻨﻟا ﻦﻴﺒﺗو ﻰﻠﻋ يﻮﻄﻨﻳ ﻲﺒﺴﻨﻟا ﺮﻌﺴﻟا نأ ﺔﻘﻴﻘﺣ ﻚﻟذ ﻰﻟإ ﻒﺿأ ،ﺲﻧﻮﺗ ﻲﻓ ﻦﻴﺑزﺎﻣﺎﺑرﺎﻜﻟاو ﺪﻴﻣﻼﻜﻨﺒﻴﻠﺠﻟاو ﻞﻳﺮﺑﻮﺘﺑﺎﻜﻟا ﺮﻴﻗﺎﻘﻋ قاﻮﺳأ ﻣ ٍﺮﻴﺛﺄﺗ ﺮﻌﺳ ﻊﻔﺗرا ﺎﻤﻠﻜﻓ ؛ﺔﺳارﺪﻟا ﻞﺤﻣ تﺎﺌﻳﺰﺟ ثﻼﺜﻠﻟ ﻚﻟذو ﺲﻧﻮﺗ ﻲﻓ رﺎﻘﻌﻟا عﻮﻨﻟ قﻮﺴﻟا ﺔﺼﺣ ﺮﻴﻴﻐﺗ ﻲﻓ ﻲﺑﺎﺠﻳإو ٍﻢﻬ ضﺎﻔﺨﻧا ﻞﻗ ﺎﻤﻠآ ﺔﻳرﺎﺠﺘﻟا ﺔﻣﻼﻌﻟا ﻞﻤﺤﻳ نأ ﺎﻤﻧود ﻦﻜﻟ ﺞﺘﻨﻤﻟا ﺲﻔﻨﻟ ضوﺮﻌﻤﻟا ﺮﻌﺴﻟا ﻂﺳﻮﺘﻣ ﻰﻟإ ﺔﺒﺴﻨﻟﺎﺑ ﺔﻨﻴﻌﻣ ﺔآرﺎﻣ ﺞﺘﻨﻣ ﺔآرﺎﻤﻟا ﻩﺬه ﺞﺘﻨﻣ ﻦﻣ قﻮﺴﻟا ﺔﺼﺣ . ﺔﻳودﻷا قﻮﺳ ﻲﻓو ٍﺮﻌﺳ ضﺮﻓ ﻲﻓ ًﺎﺒﺒﺳ نﻮﻜﺗ ﺔﻳرﺎﺠﺘﻟا تﺎﻣﻼﻌﻟا ءﺎﻤﺳأ نﺈﻓ ﻲﺴﻧﻮﺘﻟا ﺔﻳرﺎﺠﺘﻟا ﺎﻬﺘﻣﻼﻋ ﻞﻤﺤﺗ نأ ﺎﻤﻧود ﻦﻜﻟو ﺔآرﺎﻤﻟا ﺲﻔﻨﻟ ىﺮﺧﻷا تﺎﺠﺘﻨﻤﻟﺎﺑ ًﺔﻧرﺎﻘﻣ ﻰﻠﻋأ . ﺔﻣﺎﻌﻟا ﺔﺳﺎﻴﺴﻟا رﻮﻈﻨﻣ ﻦﻣو ﻲﻟﺎﺘﻟﺎﺑو ﻟا ﻩﺬه تﺎﺠﺘﻨﻤﺑ ﺔﻧرﺎﻘﻤﻟﺎﺑ ًاﺮﻌﺳ ﻰﻠﻋﻷا تﺎآرﺎﻤﻟاو ﺔﻳرﺎﺠﺘﻟا تﺎﻣﻼﻌﻟا ﻦﻣ قﻮﺴﻟا ﺔﺼﺣ نﺈﻓ ﺔﻣﻼﻌﻟا ﻦﻣ ﺔﻳرﺎﻌﻟا تﺎآرﺎﻤ نﻮﻨﻌﻣ ﺮﻴﻐﻟا رﺎﻘﻌﻟاو ﺔﻳرﺎﺠﺘﻟا ﺔآرﺎﻤﻟا ﻞﻤﺤﻳ يﺬﻟا رﺎﻘﻌﻟا نأ رﺎﺒﺘﻋﻻا ﻲﻓ ﺬﺧﻷا ﻊﻣ ًﺔﺻﺎﺧ ﻲﺿﺮﻣ ﺮﻴﻏ ﺮﻣأ ﻮه ﺔﻳرﺎﺠﺘﻟا ﺾﻳﺮﻤﻠﻟ ﺔﻴﺤﺼﻟا ﺞﺋﺎﺘﻨﻟا ﺲﻔﻨﺑ ﻲﺗﺄﺗو ًﺎﻣﺎﻤﺗ ﺔﻘﺑﺎﻄﺘﻣ تﺎﺠﺘﻨﻣ ﻲه ﺔﻳرﺎﺠﺘﻟا ﻪﺘآرﺎﻤﺑ .1. Introduction
The demand for drugs by consumers “patients” does not follow the paradigm of economic modeling that the consumer maximizes his utility function subject to budgetary constraints. Rather, the demand for prescription drugs results from the physician–patient agency relationship (Costa-Font et al. 2007).
The physician takes into account the patient’s utility and, arguably, the costs of prescribing to the health insurer as well as the patient in the presence of cost sharing arrangements (Dranove, 1989). Patient insurance arguably affects a doctor’s prescribing decision as well as the patient’s consumption (Pavcnik, 2002).
Since patients are uninformed about the optimal treatment, they depend in their decision-making process on physicians for both diagnosis and treatment suggestion. Hence, physicians directly affect the extent of competition between different treatment possibilities and can be taken as the main determinant of whether a brand name or a generic drug version is prescribed (Hellerstein, 1998)1.
Regarding pharmaceutical prices, most countries resort to two instruments2. On the one hand, they regulate their prices in order to reduce pharmaceutical expenses and thus their health care costs. On the other hand, they rely on generic competition after patent expiry to induce overall lower drug prices and to offer lower-priced substitutes.
The discussion of the impact of the entry of generic drugs is a source of controversy. Most economists agree on the existence of a "non-zero" effect, but there is a heated debate on the direction of such impact.
Since generics have the same therapeutic effect as the brand name, one would expect that only relative prices matter for the consumers’ (or physicians’) choice of drug, and thus that generic entry would trigger strong competition between brand names and generics.
However, this is not what is happening. A robust empirical regularity is that the brand names charge a higher price than their generic versions and still obtain positive market shares. Some studies show that brand name prices even increase when the patent expires and generics enter the market. This phenomenon has been called the "generic paradox".
In fact, Grabowski and Vernon (1992) show that the prices of innovative medicines continue to rise quickly even after the entry of generic drugs. They find that generic products often capture a relatively large market share immediately after their entry (when patent expires). The authors attribute this gain in market share to the differences of price: the prices of generic substitutes are on average lower than those of brand names. However, the loss of brand name’s market share suggests that the manufacturer may be prompted to lower its prices when generic products are permitted to enter the market.
Caves et al. (1991) find that the brand name’s prices decrease. These authors attempt to estimate the rate of price increases that may occur without the entry of generic drugs. They find that although the prices of several ethical drugs continue to rise after the entry of generics, these prices remain lower than they would have been otherwise.
1
Therefore, it is not surprising that both price regulation and advertising play an important role in the pharmaceutical market since the physician is the target of huge advertising expenditures by the pharmaceutical firms.
2
Pharmaceuticals are targeted because decision-makers see them as a visible expenditure that can yield cost savings through direct intervention, and as less politically sensitive than a reduction in services or salaries.
Frank and Salkever (1992 and 1997) show that the prices of brand name drugs increase with generic entry at the same time that entry is accompanied by large decreases in the price of generic drugs.
Hudson (1992) uses European data to analyze the impact of generic competition. His results imply that the entry of new products in a therapeutic class can reduce drug prices significantly in Germany and France.
Aronsson et al. (2001) were interested in the relation between the entry of the generic substitutes and the price of brand name drug. They examined the effect of brand name drug prices relative to the average price of generic versions on the brand name’s market share. They found that for a higher price of brand name drug relative to the average price of its generic, substitutes significantly decrease the market share for five of the twelve molecules studied.
Königbauer (2005) deals with generic versus brand name competition and shows that generic market entry becomes more likely in the presence of (even purely persuasive) detailing. Advertising targeted at physicians can, therefore, contribute positively to welfare by promoting competition and lowering off-patent prices.
Danzon and Chao (2000) find empirical evidence that generic market shares are lower in countries where price regulation is stricter and price competition due to generic entrants after patent expiry is stronger in countries with moderate price regulation and vice versa3.
The purpose of this paper is to investigate how the brand name’s market shares in Tunisia are affected by generic competition for the pre-reform period of the Tunisian health insurance system. To our knowledge, this work is the first empirical study to address the pharmaceutical Tunisian market, wondering about the price of medicines, the entry of generic drugs and the market share of pharmaceutical.
The paper is organized as follows. After the brief review of the literature related to generic versus brand name competition presented above, we present the health sector and pharmaceutical system in Tunisia in Section 2. In Section 3 we will draw up the methodological background. Empirical Application is presented in Section 4. Finally, some concluding remarks are outlined in Section 5.
2. The Health Sector and the Pharmaceutical System in Tunisia
Tunisia, with a population of 9.9 million and a per capita Gross Domestic Product (GDP) of $7.500 in 2007, is a middle-income country according to the World Bank. Over the last two decades Tunisia has made significant improvements in health outcomes and is on track to achieving the health Millennium Development Goals (MDG) targets by 2015. These health improvements have been achieved primarily through reductions in mortality and morbidity due to communicable diseases, and reflect overall improvements in hygiene and infrastructure as well as access to basic health services4. These results have been obtained through a continuous increase in overall health expenditure in Tunisia.
The total health expenditures per capita are evaluated at approximately $158 per capita (2005) and around 5.5% of the GDP. The Tunisian health care financing system is a
3
Countries that allow for (relatively) free pricing on the pharmaceutical market, like the US, the UK or Germany, have higher generic market shares than, for example, Italy or France, where both countries have strict price regulations.
4
Infant mortality rate is 20.6 deaths per 1,000 live births; maternal mortality ratio is 55 deaths per 100,000 live
births. Life expectancy is 75.3 years for women and 71.4 years for men (UNPF, 2006)4. Some 19% of the
population has access to primary health care services, and skilled attendants are present at 89% of births. The contraceptive prevalence rate is 69%.
combination of social insurance, general revenue, and out-of-pocket payment. However, the proportion of public expenditure declined, falling from around 52% in 1998 to 44% in 2005. Out-of-pocket household expenditure rose, increasing from 47% in 1998 to 55% in 2005. Here, it should be noted that the private and mutual insurance systems contribute very little to the coverage of health expenditures.
Tunisia, like most another countries, has experienced strong growth in expenditure on pharmaceuticals5 over the past ten years. Pharmaceuticals are subject to stringent regulations covering the import (through the Pharmacie Centrale de Tunisie, a monopolistic state company importer), manufacturing, distribution and selling6.
Moreover, production of pharmaceuticals in Tunisia focuses on the manufacture of generic drugs and medicines under license7. Between 2000 and 2005, the rate of generic drugs manufactured in Tunisia has risen from 32.2 to 48.4%8. Furthermore, drug prices are determined by negotiation between the producers of pharmaceuticals and the regulatory authorities.
In addition, the homologation of the prices of the drugs, in particular at the stage of the distribution and detail, and their uniform application in Tunisia ensure that all the patients, whatever their place, pay the same price at a pharmacy for their prescribed drugs9. The respect of the prices approved in pharmacy is strict because of a share of the official publication of these prices and in addition many possibilities of control of their conformity. Although Tunisia has made progress in the health sector, it still faces rural and urban disparities in health outcomes and gaps in health coverage. Tunisia also exhibits inefficiencies in the management of health financing services, delivery systems and pharmaceutical expenditures. The rising cost of prescribed medicines is a critical public policy issue confronting policymakers and consumers in Tunisia. Spending on prescription medications is the fastest growing segment in health care.
To contain pharmaceutical expenditure and to control health costs, Tunisia has adopted health insurance reform since 1st July 2007. For pharmaceuticals, reform can be summarized in setting a rate of reimbursement according to the therapeutic benefit of medication and reimbursement of medicines (with the same active ingredient) is based on the system of the Reference Price, which is equal to the price of the cheaper generic medication.
3. Methodological Background
This paper is largely inspired by the methodological framework presented by Aronsson et al. (2001). A physician has no direct pecuniary incentives to choose less expensive generic
5
The increase in total health care expenditures can be explained by three distinct factors: (i) the purely demographic effect (namely, the increase in the proportion of elderly people, given that health expenditure is an increasing function of age); (ii) the changes in morbidity at a given age and (iii) the changes in practices, for a given age and morbidity level (e.g. technological progress).
6
The Law No. 85-91 of 22 November 1985 regulates the manufacture and registration of medicines for human medicine in Tunisia.
7
The generics are defined as copies of principles medicines in the public domain containing the same amount of active ingredients and presented in the same form. These generic drugs must be equivalent therapeutic products (and are thus interchangeable). They must also submit an economic advantage.
8
The number of pharmaceutical units grows to 28 units in 2004. This growth is accompanied by a change in investment in the sector of the pharmaceutical industry, from 9.28 million Tunisian Dinars in 1990 to 400 million Tunisian Dinars in 2005.
9
Prices of medicines in Tunisia are set by the Pharmacie Centrale de Tunisie, in other words, these prices are not determined by supply and demand. Thus, it is anticipated that prices have no effect on the demand for drugs in Tunisia. This encourages us to analyze the demand structure for medicines and market share.
products or to inform himself/herself about generic alternatives. According to an estimate presented by Bleidt (1992), the pharmaceutical industry spends slightly more on marketing and promotion than on R&D. In many instances, the bulk of this effort promotes the brand name product, increasing the likelihood that a physician will patronize the original manufacturer’s product.
The physician may also feel loyalty towards the original manufacturer, or sheer inertia may stop him/her from changing prescription habits. However, out of consideration for the patients he/she may, nevertheless, react to price differences. To simplify the analysis, following Aronsson et al. (2001), we assume that the market demand for a drug (i.e. the combined demand of the brand name medicine and its generic versions) is perfectly inelastic with regard to prices. The market shares of the competing producers are determined by relative prices.
Hellerstein (1998) and Aronsson et al. (2001) develop a model where the prescribing physician acts as an agent for the patients and for the tax payers, which means that concern for the patients may provide an incentive to change prescription habits from the brand name product to less expensive generic substitutes.
Aronsson et al. (2001) assume that the total discounted change in expected utility of the physician, if changing the prescription habits from the brand name product to a generic substitute in period t, ∆ , depends on the currently observed price of the brand name ut product p
it
P relative to the currently observed price of the generic version g it P according to: p it t g it P n u ( 1) (1 P η ∆ = − − δ) (1) where:
n is the number of times where the physician prescribes the pharmaceutical product per time period;
η is a preference parameter; and δ is the discount factor.
This formulation means that the utility change is positive (negative) if the brand name’s price exceeds (falls short of) the price of generics versions.
Considering that the main part of the marketing effort in the pharmaceutical industry is used to promote brand name products, the physician may also act as an agent for, or at least feel loyalty towards, the producer of the brand name drug.
If the physician incurs a substitution cost, c, (in utility terms) if he/she changes his/her prescription habits from brand name to generic version, the substitution cost may differ from one physician to another.
Given that the physician prescribes the brand name drug at the period t - 1, he / she will substitute the generic version in period t, if:
t t u c 0 ∆ − > (2) or: p it t g it P ( 1) c 0 P γ − − > , with n (1 η γ = − δ) (3)
To be able to relate equation (3) to the change in the brand name’s market share, it is required that substitution costs for physicians prescribing the brand name drug (most expensive) are uniformly distributed in all periods and independent of the brand name’s market share. In other terms, for each period, a new substitution cost is drawn from a uniform distribution. Formally, let the distribution for substitution costs in period t be defined over the interval
[
a ,at t+b]
. If, at the end of period t − 1, a share St−1of the physicians patronize the originaldrug, the fraction out of that share for whom
p it t g it P c ( 1) P < γ − is given by: p p it t g t t 1 it t t g t 1 t t
P
(
1) a
S S
P
(
a )
P
(
)
S
a
b a
b
b P
− −γ
− −
−
γ +
γ
−
=
= −
+
+ −
(4)Rewriting equation (4), we get:
p t t 1 t t g t 1 t S S P ( ) S P − − − = α + β (5) where, t t ( a ) b γ + α = and b γ β = − .
Equation (5) gives the relative change of market share for the original drug as a linear function of the price of the original drug relative to the price of the generic substitute. Another interpretation of this equation (5) is that the first difference in brand name’s market share in the period t depends on the brand name’s market share at the end of period t-1 and the relative price. Following Aronsson et al. (2001), this relationship will serve as a starting point for the empirical analysis.
4. Empirical Application 4.1. Data
In this study we use data for three molecules Captopril (antihypertensive) Glibenclamide (antidiabetic) and Carbamazepine (antiepileptic) from IMS Health database. The data spans from the third quarter of 2002 to the second quarter of 2007 and covers only the pre-reform period of the Tunisian health insurance system10.
This IMS Health database provides quarterly time-series information on the value and volume of retail pharmacy sales for each presentation of a given drug. Value of retail pharmacy sales are in real prices (we use the Consumption Price Index of medicines published by the National Institute of Statistics: www.ins.nat.tn). The data from IMS Health also contains information on a product’s active ingredient, manufacturer, launch date, and whether it is a brand name or a generic.
4.2. Empirical results for Captopril and Glibenclamide molecules
Based on equation (5), we can write the following regression model (model 1):
10
Data accessibility is a major problem for economic modeling in Tunisia and only data from the third quarter of 2002 to the second quarter of 2007 is available.
p 0 1 it it 1 it i i i g it it 1 it S S P ( ) S P − − − = α + α Τ + β + ε (6) where: it
S : brand name’s market share (for molecule i) at the period t,
T : a time trend to capture possible time dependence (other than via the random term) of the distribution for substitution costs facing prescribing physicians.
p it g it P ( )
P : the relative price. p
it
P : brand name’s price
g
it j génj j
P =
∑
S P : weighted generic prices (Sj is the generic j market share and P génj is hisprice)
it
ε : is a random term, which is assumed to be i.i.d. across substances.
For each molecule (Captopril and Glibenclamide), the regression model (model 1) is estimated using a Cochrane-Orcutt technique to control for serial correlation.
We also estimate a version of the model where the data for the two commercial presentations for each molecule (25 and 50 mg in the case of Captopril and 2.5 and 5 mg in the case of Glibenclamide) are pooled together using fixed effects to control for differences across commercial presentations. The results are presented in Table 3.
For both molecules (Captopril and Glibenclamide), the relative price has a significant and positive effect on the change of the brand name’s market share. For these molecules, the brand names charge a higher price than their generic versions and still obtain positive market shares. This result is in line with the result of Scherer (2000).
4.3. Empirical results for Carbamazepine molecule
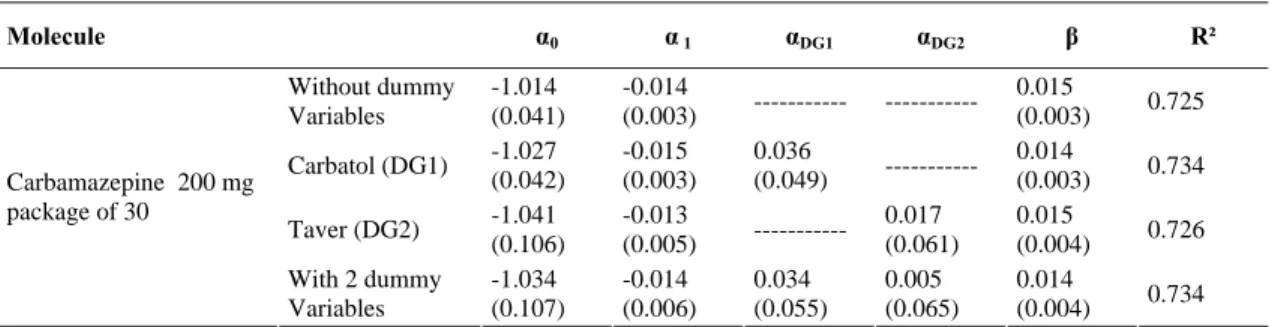
For the molecule Carbamazepine, it is reported that there is a change in the number of generics during the period analyzed11. To accommodate this change of entry and exit of generic versions and based on equation (5), we can write the following regression model taking into account the dummy variables (model 2):
p 0 1 it it 1 it i i j gj i g it it 1 it S S P D ( ) S P − − − = α + α Τ + α + β + ε (7) where: gj
D : dummy that takes the value 1 when the generic version j exists the market and 0 otherwise.
Thus, for Carbamazepine molecule (the 200mg is the only commercial presentation present in the Tunisian market), we evaluate the regression model (model 2) without taking into account dummy variables, then taking one of the two dummy variables into account and finally taking into account both dummy variables. The results are presented in Table 4.
11
In fact, the brand name (Tégétol) is present from 2002:3 to 2007:2. The first generic version (Taver) is present from 2002:3 to 2004:4 and the second generic version (Carbatol) is present on the Tunisian market from 2003:3 to 2007:2.
We note that the entry of Carbatol and the disappearance of Taver, have no significant impact on the relative price. This indicates that despite the presence of generics, the brand name’s price during the reporting period remains the same.
In addition, in the case of Carbamazepine, the relative price has a positive and significant effect on the change of the brand name’s market share. These results are not different from those for Captopril and Glibenclamide molecules.
5. Summary and Conclusions
This paper is concerned with the impact of generic competition on the market share of brand name drugs in the Tunisian pharmaceutical market for three molecules: Captopril, Glibenclamide and Carbamazepine (respectively, antihypertensive, antidiabetic and antiepileptic).
We estimate a simple model for the pre-reform period of the Tunisian health insurance system, where the relative change of market share of the original drug depends on the price of the original relative to the average price of generic substitutes.
Empirical results for the analyzed period which coincide with the pre-reform of the health insurance in Tunisia indicate that the impact of generic competition does not seem to be different across markets (active molecule) in Tunisia.
In addition, the relative price has a positive and significant effect on the change of market share of the brand name drug in Tunisia for the three molecules (Captopril, Glibenclamide and Carbamazepine). The higher the price of the brand name product relative to the average price of the generic substitutes, the smaller the decrease of market share of the brand name product. In the Tunisian pharmaceutical market, the brand names charge a higher price than their generic versions and still obtain positive market shares.
Thus, from a policy perspective, the large market share of higher priced brand names relative to their generic versions is an unsatisfactory outcome taking into account that brand name drug and generics are identical products and provide similar health gains to patients.
To conclude, it has to be said that the results presented in this paper depend on the availability of data. Further analysis, including an extended sample period for the post-reform of the Tunisian health insurance system, could be conducted in the future.
References
Aronsson T., Bergman M. A and Rudholm. N. (2001). The Impact of Generic Competition on Brand Name Market Shares-Evidence from Micro Data, Review of Industrial Organisation, 19, 425–435.
Bleidt B. (1992). Recent Issues and Concerns about Pharmaceutical Industry Promotional Efforts, Journal of Drug Issues, 22, 407–415.
Caves R. E., Whinston M. D. and Hurwitz M. A. (1991). Patent Expiration, Entry, and Competition in the U.S. Pharmaceutical Industry, Brookings Papers on Economic Activity: Microeconomics. Washington, DC: Brookings Institution.
Costa-Font J., Kanavosa P. and Rovira J. (2007). Determinants of Out-of-Pocket Pharmaceutical Expenditure and Access to Drugs in Catalonia, Applied Economics, 39, 541–551.
Danzon P.M. and Chao L.W. (2000). Does Regulation Drive out Competition in Pharmaceutical Markets? Journal of Law and Economics 43, 311–357.
Dranove D. (1989). Medicaid Drug Formulary Restrictions, Journal of Law and Economics, 32, 143–62.
Frank R. G. and Salkever D. S. (1992). Pricing, Patent Loss and the Market for Pharmaceuticals, Southern Economic Journal, 59(2): 156–79.
Frank R. G. and Salkever D. S. (1997). Generic Entry and the Pricing of Pharmaceuticals, Journal of Economics and Management Strategy, 6, 75–90.
Grabowski H. G. and Vernon J. M. (1992). Brand Loyalty, Entry and Price Competition in Pharmaceuticals after the 1984 Drug Act, Journal of Law and Economics, 35, 331–350. Hellerstein, J. K. (1998). The Importance of the Physician in the Generic versus Trade-Name
Prescription Decision, RAND Journal of Economics, 29, 108–136.
Hudson J. (1992). Pricing Dynamics in the Pharmaceutical Industry, Applied Economics, 24, 103–112.
Königbauer I. (2005). Advertising and Generic Market Entry, HEB Working Paper 3/2005, University of Bergen.
Pavcnik N. (2002). Do Pharmaceutical Prices Respond to Potential Patient out of Pocket Expenses? RAND Journal of Economics, 33, 469-487.
Scherer F. M. (2000). The Pharmaceutical Industry, in: Cuyler, A.J., Newhouse, J.P. (Eds.), Handbook of Health Economics, North Holland, Elsevier, Amsterdam.
Table 1: National Expenditures of Health in Tunisia
2001 2002 2003 2004 2005
Total expenditure on health as % of Gross Domestic Product 5,8 5,6 5,6 5,5 5,5 General government expenditure on health as % of total expenditure on
health 49,7 46,8 46,3 44,3 44,3
Private expenditure on health as % of total expenditure on health 50,3 53,2 53,7 55,7 55,7 General government expenditure on health as% of total government
expenditure 7,2 7,1 6,4 6,6 6,5
External resources for health as % of total expenditure on health 0,9 1,4 1 1,1 0,8 Social Security expenditure on health as % General government expenditure
on health 23,5 23,9 26,5 25,8 26,3
Out-of-Pocket expenditure as % of private expenditure on health 81,7 81,7 81,7 82 82,2 Private prepaid plans as % of private expenditure on health 16,6 16,6 16,6 16,3 16,2 Per capita total expenditure on health at average exchange rate (US$) 119 121 141 155 158 Per capita total expenditure on health (PPP int.$) 399 397 421 445 477 Per capita government expenditure on health at average exchange rate (US$) 59 57 65 69 70
Source: www.who.org
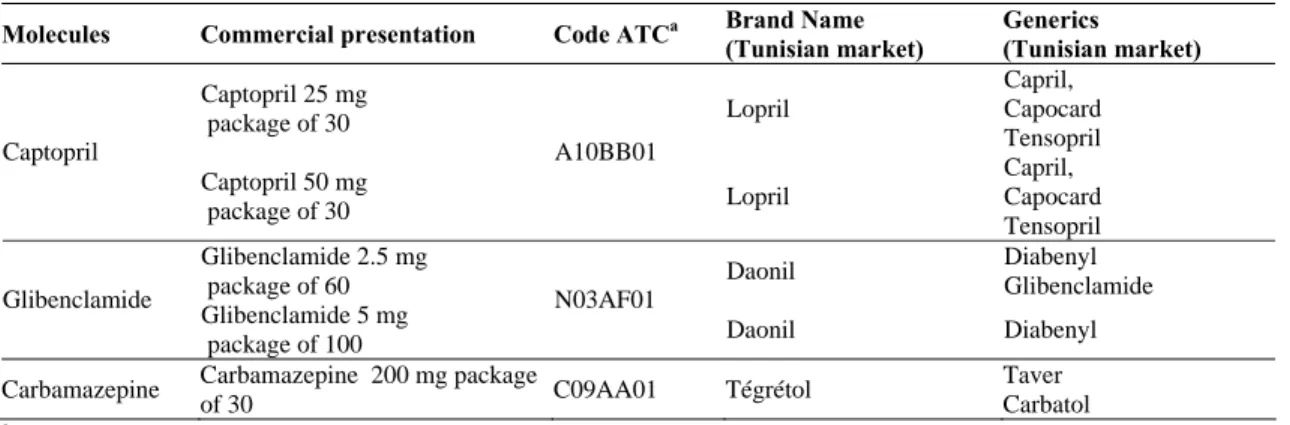
Table 2: Description of the Dataset
Molecules Commercial presentation Code ATCa Brand Name
(Tunisian market) Generics (Tunisian market) Captopril 25 mg package of 30 Lopril Capril, Capocard Tensopril Captopril Captopril 50 mg package of 30 A10BB01 Lopril Capril, Capocard Tensopril Glibenclamide 2.5 mg package of 60 Daonil Diabenyl Glibenclamide Glibenclamide Glibenclamide 5 mg package of 100 N03AF01 Daonil Diabenyl Carbamazepine Carbamazepine 200 mg package
of 30 C09AA01 Tégrétol
Taver Carbatol
a
Source : www.whocc.no
Table 3: Estimation Results for Captopril and Glibenclamide Molecules Based on Model 1 Molecules α0 α 1 β R² Captopril 25 mg Package of 30 -1.199 (0.088) 0.004 (0.002) 0.036 (0.017) 0.324 Captopril 50 mg Package of 30 -1.310 (0.102) 0.006 (0.002) 0.066 0.023) 0.342
Pooled Fixed effect 0.003
(0.001) 0.039 (0.011) 0.231 Glibenclamide 2.5 mg Package of 60 -1.146 (0.056) 0.003 (0.001) 0.007 (0.003) 0.376 Glibenclamide 5 mg Package of 100 -1.048 (0.029) 0.001 (0.001) 0.002 (0.001) 0.324
Pooled Fixed effect 0.003
(0.001)
0.006
(0.003) 0.071
Table 4: Estimation Results for Carbamazepine Molecule Based on Model 2 Molecule α0 α 1 αDG1 αDG2 β R² Without dummy Variables -1.014 (0.041) -0.014 (0.003) --- --- 0.015 (0.003) 0.725 Carbatol (DG1) -1.027 (0.042) -0.015 (0.003) 0.036 (0.049) --- 0.014 (0.003) 0.734 Taver (DG2) -1.041 (0.106) -0.013 (0.005) --- 0.017 (0.061) 0.015 (0.004) 0.726 Carbamazepine 200 mg package of 30 With 2 dummy Variables -1.034 (0.107) -0.014 (0.006) 0.034 (0.055) 0.005 (0.065) 0.014 (0.004) 0.734
![[PDF] Base de Données et langage SQL](data:image/gif;base64,R0lGODlhAQABAIAAAP///wAAACH5BAEAAAAALAAAAAABAAEAAAICRAEAOw==)