1
Informal versus Formal:
A Panel Data Analysis of Earnings Gaps in Madagascar
Christophe J. Nordman, IRD, DIAL, Paris, France
Faly Rakotomanana, INSTAT, DIAL, Antananarivo, Madagascar François Roubaud, IRD, DIAL, Paris, France
March 2012
Abstract
In spite of its predominant economic weight in developing countries, little is known about informal sector income dynamics vis-à-vis the formal sector. Some works have been done in this field using household surveys, but they only consider some emerging Latin American countries (Argentina, Brazil, Colombia and Mexico; Gong et al., 2004; Perry et al., 2007; Bargain and Kwenda, 2011) and more recently South Africa, Ghana and Tanzania for Africa (Falco et al., 2010) and Vietnam for Asia (Nguyen et al., 2011). As a matter of consequence, there is still no way to generalize the (diverging) results to very poor part of the developing world. Taking advantage of the rich 1-2-3 Surveys dataset in Madagascar, in particular its four waves panel data (2000, 2001, 2003 and 2004), we assess the magnitude of various formal/informal sector earnings gaps while addressing heterogeneity issues at three different levels: the worker, the job (wage employment vs. self-employment) and the earnings distribution. The questions asked are the following: Is there an informal sector job earnings penalty? Do some informal sector jobs provide pecuniary premiums? Which ones? Do possible gaps vary along the earnings distribution? Standard earnings equations are estimated at the mean and at various conditional quantiles of the earnings distribution. In particular, we estimate fixed effects quantile regressions to control for unobserved individual characteristics, focusing particularly on heterogeneity within both the formal and informal sector categories. Our results suggest that the informal sector earnings gap highly depends on the workers’ job status and on their relative position in the earnings distribution. Penalties may in some cases turn into premiums. By comparing our results with studies in other developing countries, we draw conclusions highlighting the Madagascar’s labour market specificity.
JEL Classification: J21, J23, J24, J31, O17.
Keywords: informal employment, earnings gap, transition matrix, quantile regressions, panel data, Madagascar.
1. Introduction
In spite of its predominant economic weight in developing countries, little is known about the informal sector's income dynamics vis-à-vis the formal sector. Some works have been done in this field using household surveys, but they only consider some emerging Latin American countries (Argentina, Brazil, Colombia and Mexico; Gong et al., 2004; Perry et al., 2007; Bargain and Kwenda, 2011) and more recently South Africa, Ghana and Tanzania for Africa (Falco et al., 2010) and Vietnam for Asia (Nguyen et al., 2011). As a matter of consequence, there is still no way to generalize these (diverging) results to other parts of the developing world, in particular in countries where the informal sector is the most widespread (Sub-Saharan African, and more generally poor countries).
From a labour market perspective, two competing views regarding informality are at stake in the literature: the exclusion and the exit hypotheses, following Hirschman masterpiece (Perry et al., 2007). The first one, also called the “dualist approach”, is an extension of the works by Lewis (1954) and Harris and Todaro (1970). It is based on a dual labour market model where the informal sector is considered as a residual component of this market totally unrelated to the formal economy. It is a subsistence economy that only exists because the formal economy is incapable of providing enough jobs, condemned to disappear with the development process. Informal workers, suffering from poor labour conditions, are queuing for better jobs in the formal sector. The second one, also known as the “legalist approach” considers that the informal sector is made up of micro-entrepreneurs who prefer to operate informally to evade the economic regulations (de Soto, 1989); this conservative school of thought is in sharp contrast to the former in that the choice of informality is voluntary due to the exorbitant legalisation costs associated with formal status and registration.
Recent empirical evidence shows, however, that the real situation is a mix of these two hypotheses. Confirming Field’s stylized assessment (1990), they stressed the huge heterogeneity among informal jobs, which combine two main components (Roubaud, 1994; Maloney, 1999, 2004; Perry et al., 2007; Bargain and Kwenda, 2011): a lower-tier segment, where occupying an informal job is a constraint choice (exclusion hypothesis); an upper-tier segment, in which informal jobs are chosen for better earnings, and non-pecuniary benefits (exit hypothesis). Usually, the former segment is assimilated to the informal wage jobs, while the latter is associated with the self-employed jobs. Therefore, whether one segment is predominant over the other is an empirical question, depending on local circumstances. To test these alternative views, one major strand of literature focuses on the estimation of earning gaps. Embedded in reveled preferences principle, and considering income as a proxy of individual utility, the approach assumes that if informal workers earn more than their formal counterparts (controlling for observed and unobserved characteristics), one could have good presumptions that they have deliberately chosen the informal sector. This may not be true for all informal workers. Thus, the challenge is to identify segments of jobs (for instance by job status) or position in the income distribution where informal workers get a higher pay. In this paper, our objective is to shed light on these alternative views in the case
of Madagascar using the formal/informal earning gaps approach. We take advantage of the rich 1-2-3 Surveys dataset in Madagascar, specifically designed to capture the informal sector, and in particular its four-wave panel data (2000-2001-2002-2004), to ask the following questions: Is there an informal sector job earnings penalty? Do some informal sector jobs provide pecuniary premiums? Which ones? Do possible gaps vary along the earnings distribution?
While most of the papers on this topic are drawn from (emerging) Latin American or some African countries, Madagascar represents an interesting case. It has experienced spectacular social, economic and political changes in the recent period. Impressive economic growth of the last decade has entailed a remarkable drop in poverty figures, drastic changes of the labour market structure, but also a surge in earnings inequality as further trade liberalization and world integration have been developed. Over the past fifteen years or so, Madagascar also has embarked on a process of economic liberalization, similarly to many African countries undergoing structural adjustment. In spite of the dynamism of its Export Processing Zones (EPZ) in the 1990s, the country remains however today one of the poorest countries in the world.
Our empirical analysis consists of assessing the magnitude of different types of informal-formal earnings gaps using OLS and quantile regressions. While many pieces of work rely on proxy variables to identify the informal sector, we use the official international definition of the informal sector elaborated by the ILO (1993), including all non-registered non-farm unincorporated enterprises (household businesses). Standard earnings equations are estimated at the mean and at various conditional quantiles of the earnings distribution. In particular, we estimate fixed effects quantile regressions to control for unobserved individual characteristics, focusing particularly on heterogeneity within both the formal and informal employment categories. Our purpose is to address the important issue of heterogeneity at two levels: the worker level, taking into account individual unobserved characteristics; the job level, comparing wage workers with self-employed workers.
Our results suggest that the informal sector earnings gap highly depends on the workers’ job status (wage employment vs. self-employment) and on their relative position in the earnings distribution. Penalties may in some cases turn into premiums. In particular, while informal sector workers suffer penalties vis-à-vis formal workers, this feature is mainly due to informal sector wage earners. In fact, informal self-employed workers receive a premium vis-à-vis formal wage workers, which is increasing along the pay ladder. Gender issues are also examined. By comparing our results with studies using similar methodologies in other developing countries, we draw conclusions highlighting the Malagasy’s labour market specificity. Surprisingly, this specificity puts Madagascar closer to Mexico (and to a lesser extend Brazil) than to South Africa, where the informal-formal sector gap, although decreasing along the earnings distribution, is always negative, even at the highest end of the distribution. Madagascar, although a much poorer country, already exhibits a more
integrated labour market, which is a characteristic of emerging Latin American countries compared to the dualistic structure expected for Sub-Saharan African countries.
The remainder of this paper is organised as follows. Section 2 presents the context, the data and some descriptive elements of income dynamics in the recent period, while Section 3 focuses on the econometric approach to assess formal-informal earnings gaps. Empirical results are discussed in Section 4. Section 5 concludes.
2. Context, Labour Market Dynamics and Data
Context
After a long period of economic recession which started with the country’s independence in 1960 and interrupted only by very short periods of growth, Madagascar experienced an exceptional period of economic expansion between 1997 and 2001. Several factors, both economic and political, drove this favorable development. Firstly, the political stability since the election of Didier Ratsiraka in 1996 and agreements with the Bretton Woods institutions to reduce debt created a favorable environment for investment. Secondly, the development of EPZs attracted foreign industry, in particular textile, which stimulated exports and employment. The rise of tourism also contributed to economic growth.
The presidential elections of December 2001 triggered a serious political crisis that lasted six months and had catastrophic economic effects (Razafindrakoto and Roubaud, 2002). The candidate Marc Ravalomanana challenged the first round results that he claimed were fraudulent. He maintained to have won the elections and refused the holding of a second round, against the incumbent president, Didier Ratsiraka. After huge demonstrations and general strikes, the conflict intensified as roadblocks around Antananarivo were set up by followers of Didier Ratsiraka in an attempt to paralyze the economy of the capital city. Finally, Marc Ravalomana was proclaimed president in May, and Didier Ratsiraka left the country in July 2002.
The political crisis had disastrous effects on the economy: GDP collapsed by 12.7% and inflation was close to 16% in 2002 (Gubert and Robilliard, 2010). Exports and foreign direct investments fell sharply, unemployment rose by 71% between mid-2001 and the end of 2002 (Cling et al., 2005). Despite the severity of the economic downturn, recovery was quick, with GDP growth of 9.8% in 2003 and around 5% in the two following years. However, unemployment doubled between 2001 and 2005 and in the main urban areas increased from 4.4% to 12%. Income per capita in 2004 also remained under its pre-crisis level (Gubert and Robilliard, 2010).
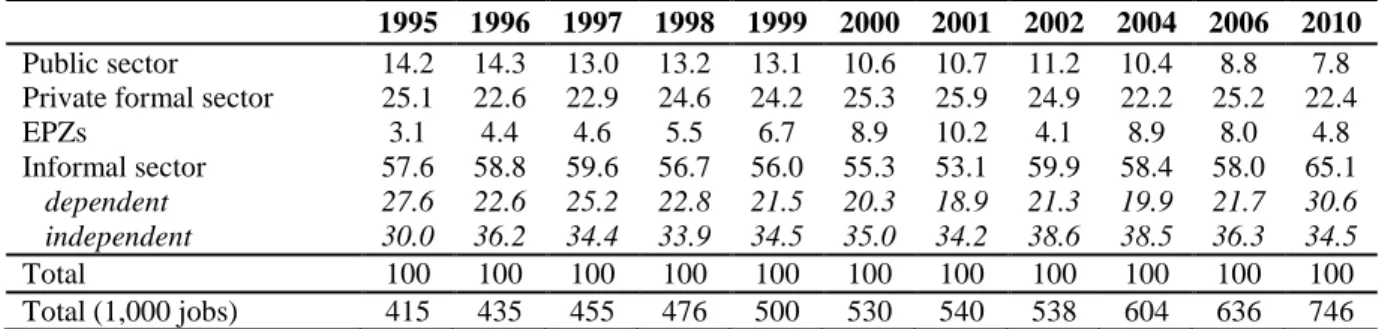
These macroeconomic turbulences had a direct impact on the labour market dynamics and households living conditions. Between 1997 and 2001, the growth process translated into a significant decline in the informal sector (Table 1). Accounting for 60% of employment in
Madagascar’s capital Antananarivo at the beginning of the period, its share decreased to 53% in 2001.1 This drop occurred in a context of public administration and state enterprise downsizing, as part of the structural adjustment program. In terms of employment, this process mainly benefited the private formal sector. This structural change was mainly due to the rapid development of EPZ and at least to some extent to the expansion of formal domestic enterprises. The average annual growth rate of employment over the period was 27% in EPZ but only 3% in the informal sector. this led to a tripling of the share of EPZs in total employment between 1995 and 2001, from 3% to more than 10%, while the share of private formal sector jobs remained stagnant at 25% (Cling et al., 2005).
The general strikes, roadblocks and the vacancy of power caused by the political crisis in the first half of 2002 reversed this trend. In only one year, the informal sector gained nearly 8 percentage points, erasing all the progress in the formalization process observed during the previous four years, absorbing the laid-off workers from closing formal enterprises and the new entrants, deprived from any alternative source of jobs. While both dependent and independent informal employment increased, the growth in the number of informal entrepreneurs was much faster than the overall increase in the number of workers. This is a sign that informal sector employment growth is extensive rather than intensive, as it happens mainly through the creation of new firms rather than the expansion of employment in existing firms. Interestingly, in the period of growth (1998-2001), although dependent informal labour was absorbed in formal enterprises, the absolute number of firms continued to increase, even faster than the overall growth of the employed labour force. This suggests that the informal sector consists of both workers queuing for a formal job and voluntary entrepreneurs (Vaillant et al., 2011). Conversely, in the period of crisis and the following recovery, the decrease in formal employment seems to have been mainly compensated by an increase in informal independent labour (the share in total employment increases from 35% to 38.6%), rather than informal hired or family labour, suggesting that existing firms were not able to absorb the surplus labour released by the formal sector, and most of these workers started an informal activity. Additionally, an important fraction of the fast growth in the number of informal firms is explained by new entries on the labour market. The EPZ paid the highest tribute to the crisis, employment being divided by nearly three. From 2002 onwards, the EPZ recovers its pre-crisis number of jobs. Yet, recovery of domestic formal enterprises seemed to be limited (Cling et al., 2009).
At the macro level, this contra-cyclical evolution of the informal sector employment, taken as a whole, seems to confirm the dualistic hypothesis quoted in the introduction. This interpretation is reinforced by the subsequent trends. As a second political turmoil occurred in 2009 combined with the international financial crisis, which resulted in a new drastic shock, the informal sector ‘re-colonized’ the labour market. The informal sector
1
As in other cities in SSA, the informal sector represents the largest share of employment in Antananarivo. Even if its share is 10 to 15 percentage points lower than in other West African urban centers, it remains the first job provider, totalizing more than one out of two jobs.
employment absorbed nearly two thirds of the labour force in 2010 (65%), its highest share ever (Rakotomanana et al., 2010).
Table 1. Share of employment by institutional sector 1995-2010 (%)
1995 1996 1997 1998 1999 2000 2001 2002 2004 2006 2010
Public sector 14.2 14.3 13.0 13.2 13.1 10.6 10.7 11.2 10.4 8.8 7.8 Private formal sector 25.1 22.6 22.9 24.6 24.2 25.3 25.9 24.9 22.2 25.2 22.4
EPZs 3.1 4.4 4.6 5.5 6.7 8.9 10.2 4.1 8.9 8.0 4.8 Informal sector 57.6 58.8 59.6 56.7 56.0 55.3 53.1 59.9 58.4 58.0 65.1 dependent 27.6 22.6 25.2 22.8 21.5 20.3 18.9 21.3 19.9 21.7 30.6 independent 30.0 36.2 34.4 33.9 34.5 35.0 34.2 38.6 38.5 36.3 34.5 Total 100 100 100 100 100 100 100 100 100 100 100 Total (1,000 jobs) 415 435 455 476 500 530 540 538 604 636 746
Source: 1-2-3 Surveys, Phase 1, 1995-2010, MADIO, DIAL & INSTAT; authors' calculations.
Note: Private formal sector figures do not include EPZs.
The growth process registered at the national level until 2001 is confirmed by the survey data that will be used in this paper. Urban households benefited most from the situation. In Antananarivo, the real average labour income increased by 53% between 1995 and 2001, which corresponds to a huge 8% annual growth rate, an unprecedented pace in Madagascar’s history (Razafindrakoto and Roubaud, 2002 & 2010). Consequently, the poverty incidence decreased from 39% to 19% while income inequality was also reduced. The 2002 crisis stopped this positive trend: the unemployment rate nearly doubled along with a massive increase in time-related underemployment2 and child labour. Real incomes dropped by 5%. Thereafter, despite the quick macroeconomic recovery, household living conditions stagnated: in 2004, earnings were as low as in 2002, and in 2006, they were only 2% higher than during the crisis.
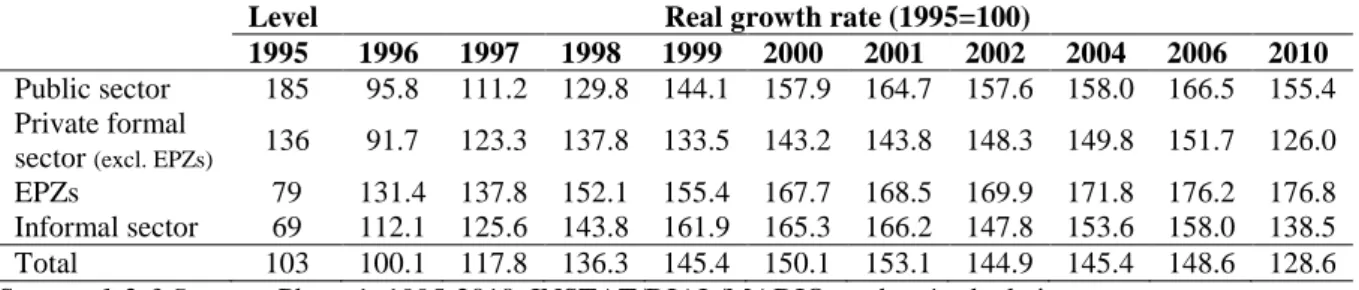
In terms of labour income, the informal sector is, as expected, the lowest paying segment of the urban labour market, with jobs in the public sector at the top of the earnings ladder (first row of Table 2). Interestingly, although it is significant, the earning gap with EPZs jobs is quite low, stressing the potential trade-offs in choosing one sector or the other for low skill workers, especially women (Glick and Roubaud, 2006). The decline in informal sector employment in the second half of the nineties was accompanied by large income gains from informal activities. Between 1995 and 2001, real average informal earnings increased by 66%, this is more than the 53% registered over all sectors together. Given that the informal sector is less exposed to international competition than the formal tradable sector, informal firms have been able to benefit from the increase in domestic demand. In spite of the lower income elasticity of their products and of a decreasing market share for consumption goods (-6 percentage points), informal goods still satisfied nearly three quarters of household consumption in 2001. If only food is considered the share catered by the informal sector was even 95% (Razafindrakoto and Roubaud, 2010).
Conversely, in 2002, the average income in the informal sector was reduced by 11%, while the decline for the whole labour market was ‘only’ 5%. Shrinking aggregate demand combined with the absorption of labour quitting the formal sector are likely to be the main
2 A person is in a situation of time-related underemployment if he works less than 35 hours a week and wishes to work more.
drivers of this sharp contraction. The shift from formal to informal consumption goods following the impoverishment of the population was not sufficient to counterbalance the two former effects (Razafindrakoto and Roubaud, 2010). On the contrary, the formal sector was able to maintain real wages, but at the expense of a massive reduction in jobs. These figures are consistent with the common belief that the formal sector would adjust during downturns through quantity, while price adjustment would be the main mechanism at work in the informal sector. Subsequently, informal sector incomes progressively recover part of their purchasing power, at least up to 2009, before a new drastic drop occurred.
Table 2. Level and growth rates of earnings by institutional sector 1995-2010
Level Real growth rate (1995=100)
1995 1996 1997 1998 1999 2000 2001 2002 2004 2006 2010
Public sector 185 95.8 111.2 129.8 144.1 157.9 164.7 157.6 158.0 166.5 155.4 Private formal
sector (excl. EPZs) 136 91.7 123.3 137.8 133.5 143.2 143.8 148.3 149.8 151.7 126.0 EPZs 79 131.4 137.8 152.1 155.4 167.7 168.5 169.9 171.8 176.2 176.8 Informal sector 69 112.1 125.6 143.8 161.9 165.3 166.2 147.8 153.6 158.0 138.5 Total 103 100.1 117.8 136.3 145.4 150.1 153.1 144.9 145.4 148.6 128.6 Source: 1-2-3 Surveys, Phase 1, 1995-2010, INSTAT/DIAL/MADIO; authors' calculations.
Notes: The first column corresponds to monthly earnings in 1,000 Fmg; the other columns to the earnings dynamics compared to 1995.
Up to now, we analyzed informal sector dynamics through repeated cross sections of labour force survey data. However, such data provide only an aggregate and partial view of the process at stake. Understanding better the informal sector dynamics requires to dig beyond average along two dimensions, by taking into account its intrinsic heterogeneity and individual mobility across sectors. To overcome these limitations, we will take advantage of the availability of panel data for the sub-period 2000-2004 to accurately focus on our main objective, i.e. to assess the formal/informal earnings gaps.
Data description
The data used in this paper are drawn from the 1-2-3 Surveys conducted in the capital city, Antananarivo, since 1995 by the National Statistics Institute, with the technical assistance of DIAL, on behalf of the authors (Rakotomanana et al., 2003). The 1-2-3 Survey is a mixed household/enterprise survey specifically designed at capturing the informal sector in all its dimensions (Razafindrakoto et al., 2009). Phase 1 is an extended labour force survey, providing accurate labour market indicators, including, among others, main and secondary jobs of every member aged 10 years and over by status of firm (formal/informal). Phase 2 is an enterprise survey, carried out on a representative subsample of informal firms identified in Phase 1 and seeking to measure their main economic and productive characteristics. Phase 3 is an income and expenditure type household survey, which sample is drawn from Phase 1 and which aim is to estimate the weight of the formal and informal sectors in household consumption by product and household type.
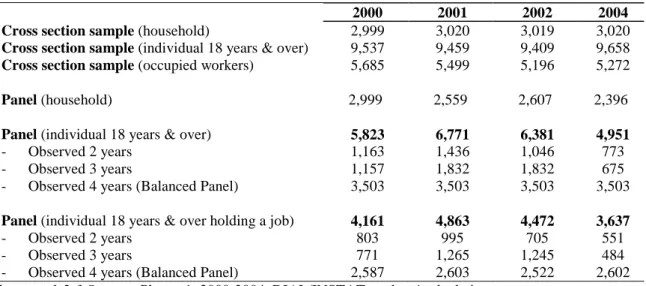
In terms of sample design, the 1-2-3 Surveys are a classical two-stage stratified random survey, covering the ordinary households in the agglomeration of Antananarivo.3 The sample size is constant over years and quite large for this kind of geographical coverage. Approximately, 3,000 households and all household members have been interviewed each year (see details Table 3). Among all individuals, more than 9,000 belong are 18 years and over, of which around 5,500 held a job in the considered years.4 For the purpose of this paper we use exclusively four successive rounds of Phase 1 (2000, 2001, 2002 and 2004), which presents the advantage of including a panel component. From 2000, the 2,999 households have been re-interviewed the three subsequent rounds. In order to keep constant the total number of households surveyed each year (3,000), the disappeared or non-responding households have been randomly renewed from one round to the other.
Table 3. The panel structure of the 1-2-3 Surveys 2000, 2001, 2002 and 2004
2000 2001 2002 2004
Cross section sample (household) 2,999 3,020 3,019 3,020
Cross section sample (individual 18 years & over) 9,537 9,459 9,409 9,658
Cross section sample (occupied workers) 5,685 5,499 5,196 5,272
Panel (household) 2,999 2,559 2,607 2,396
Panel (individual 18 years & over) 5,823 6,771 6,381 4,951
- Observed 2 years 1,163 1,436 1,046 773
- Observed 3 years 1,157 1,832 1,832 675
- Observed 4 years (Balanced Panel) 3,503 3,503 3,503 3,503
Panel (individual 18 years & over holding a job) 4,161 4,863 4,472 3,637
- Observed 2 years 803 995 705 551
- Observed 3 years 771 1,265 1,245 484
- Observed 4 years (Balanced Panel) 2,587 2,603 2,522 2,602
Source : 1-2-3 Surveys, Phases 1, 2000-2004, DIAL/INSTAT; authors' calculations.
Note: In Madagascar the working age population is defined as all individual aged 10 years and over. The number of observations of the balanced panel for occupied workers change a little bit as some individuals enter and exit the labour force.
To build our panel, individuals being matched between the four rounds, we use a common individual identifier across years, cross-checked with name, gender, age and other individual information. After undertaking thorough data cleaning including checking consistency of time-invariant variables between the four survey rounds, we obtain a panel of 23,926 observations (individual*year) with useful information. The structure of the panel is described in Table 3. Among the 7,544 individuals in the working age population, 3,503 are observed the four years (balanced panel), that is nearly half of our sample (47%); 24% are present thrice and 29% twice. If we restrict ourselves to the occupied population, 5,360
3
The primary sample units are census enumeration areas and the secondary sample units correspond to households and individuals. For more details, see Rakotomanana et al. (2003).
4
The full sample consists in all members of the households surveyed in 2000. In this paper we restrict our analysis to the individuals aged 18 years old and over (in 2000), to better control for education achievement. Taking a lower threshold would lead to a censored education variable. Less than 5% of the individuals aged 18 years and over are still at school.
individual hold a job, and the distribution according to the number of time-observations is quite similar (48% for the balanced panel).
As in any panel data analysis, potential selective attrition should be considered and addressed. The attrition rate from one year to the other is 13% in average, and is mainly due to demographic changes (marriage, migration, death), while economic factors (to find a job, etc.) are marginal. Comparisons of means and distribution of earnings and observables between the cross-section samples and the panel sub-sample suggest that selective attrition is not an issue. Age and matrimonial status are the only socio-demographic factors affecting attrition: panel individual are younger and are more often not married than non-panel individuals, but the gap is limited (33 vs. 36.8 years old; 48% vs. 37% are not married). More importantly, no significant difference in labour market related variables, in particular in earnings or type of jobs (formal vs. informal) are observed (Rakotomanana, 2011).
Being specifically designed to capture informal sector jobs, the 1-2-3 Surveys allow us to capture the concept of informal sector following the international definition strictly (ILO, 2003; European Commission et al., 1993). In Madagascar, the informal sector is defined as all private unincorporated enterprises that produce at least some of their goods and services for sale or barter, are not registered (statistics licence, supposed to be compulsory for all kind of businesses) or do not keep book accounts. Apart from our formal/informal sector divide, special care is dedicated to get reliable measures of variables where informality status may lead to sampling and measurement errors, due to its characteristics. In particular, the questionnaire includes a detail set of questions to capture information on activity status, the classical procedures leading to the under-declaration of informal sector workers participation for those with the weakest labour market attachment. We compute the labour income associated with each remunerated job. For wage workers, the survey capture their current monthly wage, while for self-employed workers earnings correspond to the disposable income (before taxation). For those who don't want to declare (or don't know) their precise earnings, a complementary question ask for intervals, proposed in detailed ranges (10) of minimum wage. Hourly earnings used in the econometric analysis are deduced using the total number of hours worked per month. Additionally, all the classical individual and household based socio-demographic variables are appended to our database. Finally, time deflators CPI are used to compute real earnings.
To our knowledge, the database used in this paper is one of the largest and highest quality labour market panel in Sub-Saharan Africa (apart from being one of the few ones available).
3. Econometric Approach to Measuring Informal-Formal Earnings Gaps
The empirical analysis consists of assessing the magnitude of different types of informal-formal earnings gaps using OLS and quantile regressions with log hourly earnings as
dependent variable. Standard earnings equations are thus estimated at the mean and at various conditional quantiles of the earnings distribution. The models are regressed on a pooled sample of workers over years employed formally and informally. The different covariates introduced into the regressions are the completed years of education, the years of potential experience (with quadratic profiles for these two regressors), a dummy for being married, a dummy for being a woman, ten dummy variables of industries to account for technological differences between branches of activity, ten area dummies to capture labour market local specificities and four time dummies to control for macroeconomic trend effects on earnings.5
A number of studies based on data on African manufacturing firms have shown that wages are positively correlated to firm size, conditional on standard human capital variables.6 The literature discusses numerous reasons why wages are positively correlated with firm size. One of the frequently made arguments is that firm size is correlated with omitted worker quality because large firms usually attract more productive workers. Thus, not accounting for this demand side characteristic may induce severe biases in the usual Mincerian equations. Fortunately in this paper, we are able to control for the size of the firms that we aggregated in four ordinate ranges. However, given that firm size is highly correlated with informal/formal status, we systematically estimate our models with and without the firm size in order to disentangle the effect of these two variables.
To account for informal-formal differences in earnings at the mean earnings level, we rely on pooled OLS regressions across years and Fixed Effects OLS regressions (FEOLS), the latter accounting for time-invariant unobserved heterogeneity. The FE model can be written as
= + + + (1)
where denotes the vector of characteristics of individual i observed at time t (which
includes a constant term), represents a dummy taking value one if person i observed at
time t is an informal sector worker. ∝ is the time-invariant individual heterogeneity (or the
individual fixed effect) and is an i.i.d. normally distributed stochastic term absorbing measurement error. Note7 that | , , = 0.
The estimated coefficient is interpreted as a measure of the conditional earnings premium/penalty experienced by workers who change status between informal sector jobs to formal sector employment (or the reversal). However, as mentioned previously, informal employment is extremely heterogeneous and a finer job divide should be considered. We
5 These industry dummies include “Agriculture”, “Food processing”, “Clothing”, “Machinary”, “Other Manufacture”, “Construction”, “Transportation”, “Trade”, “Public services” and “Other services”. The area dummies consist in the ten sampled communes the survey has been drawn from.
6 See Strobl and Thornton (2002), Manda (2002) and Söderbom, Teal and Wambugu (2005). 7
One could use a random effect (RE) model assuming in addition that | , = 0. However, as in many
other cases, this condition is very unlikely to be satisfied as individual unobserved characteristics are generally correlated with workers’ observable characteristics. Hausman's specification test indeed confirmed a systematic difference in the FE and RE estimators.
then define four categories of workers split by job status (wage workers vs. self-employed workers) and institutional sector (formal vs. informal) and create four dummies taking value one if the individual i at time t is an informal wage worker ( ), a formal wage worker
( ), an informal self-employed worker ( ) and a formal self-employed worker ( ).
Taking the formal wage workers as the reference category, the model we estimate can be written as
= + + + + + (2)
The estimated coefficients , and are interpreted, respectively, as the IW – FW, IS – FW
and FS – FW conditional earnings gaps. Identification of these conditional earnings gaps relies on the presence in the sample of movers between employment states over time. Those movers can be compared to the stayers in terms of earnings. As an illustration, we consider a simple two-period example and eight cases of transitions out of the various possibilities of professional trajectories (which are 16 in a two-period example):
2 cases of stayers: − "| " = 1, = 1 = Δ (3) − "| " = 1, = 1 = Δ (4) with Δ = ( − ") 6 cases of movers: − "| " = 1, = 1 = Δ + θ − δ (5) − "| " = 1, = 1 = Δ − δ (6) − "| " = 1, = 1 = Δ + θ (7) − "| " = 1, = 1 = Δ + λ (8) − "| " = 1, = 1 = Δ + λ − θ (9) − "| " = 1, = 1 = Δ − θ (10) with Δ = ( − ")
Equations (3) and (4) give examples of the changes in earnings for stayers, i.e. for workers that do not change their employment state between the two periods. Equations (5) and (6) illustrate the changes in earnings for those workers coming from an informal wage job and moving, respectively, into an informal self-employed job and a formal wage job; equations (7) and (8) represent these earnings differentials for those coming from a formal wage employment and moving, respectively, into an informal employed job and a formal self-employed job. Finally, the cases of informal self-self-employed workers moving to, respectively, formal self-employed and formal wage jobs are considered in equations (9) and (10).
The identification strategy of FE on movers is quite standard but, in practice, one should verify that the number of moves across employment states is sufficient for a valid use of this
estimator. We verify that this is the case in Table 5 in the next section. More generally the identification strategy supposes that movers change employment states more or less randomly, or at least that they do not systematically move for better earnings. However, people may change jobs in particular if they see an opportunity to earn more. We present in the following section earnings matrices showing that this is actually not the case (Table 6). Finally, to allow the earnings gaps between job statuses to differ along the earnings distribution, we rely on Quantile Regressions (QR). Quantile earnings regressions consider specific parts of the conditional distribution of the hourly earnings and indicate the influence of the different explanatory variables on conditional earnings respectively at the bottom, at the median and at the top of the distribution.
Using our previous notation, the model that we seek to estimate is:
)*( ) = (+) + (+) + (+) + (+) + , ∀+ ∈ 0,1 (11)
where )*( ) is the +th conditional quantile of the log hourly earnings. The set of coefficients (+) provide the estimated rates of return to the different covariates at the +th
quantile of the log earnings distribution and the coefficients (+), (+) and (+) measure
the parts of the earnings differentials that are due to informal-formal job differences at the various quantiles. In a quantile regression, the distribution of the error term is left unspecified. The quantile regression method provides robust estimates, particularly for misspecification errors related to non-normality and heteroskedasticity.
We then turn to Fixed Effects Quantile Regressions (FEQR). The extension of the standard QR model to longitudinal data has been originally developed by Koenker (2004). More recently, Canay (2010) proposed an alternative and simpler approach which assumes that the unobserved heterogeneity terms have a pure location shift effect on the conditional quantiles of the dependent variable. In other words, they are assumed to affect all quantiles in the same way. It follows that these unobserved terms can be estimated in a first step by traditional mean estimations (for instance by FE). Then, the predicted 2 are used to correct 1 earnings, such as 2 =1 − 2 , which are regressed on the other regressors by traditional 1 QR.
When running the regressions (2) and (11), we always provide robust standard errors using bootstrap replications.
4. Descriptive Statistics and Validity checks
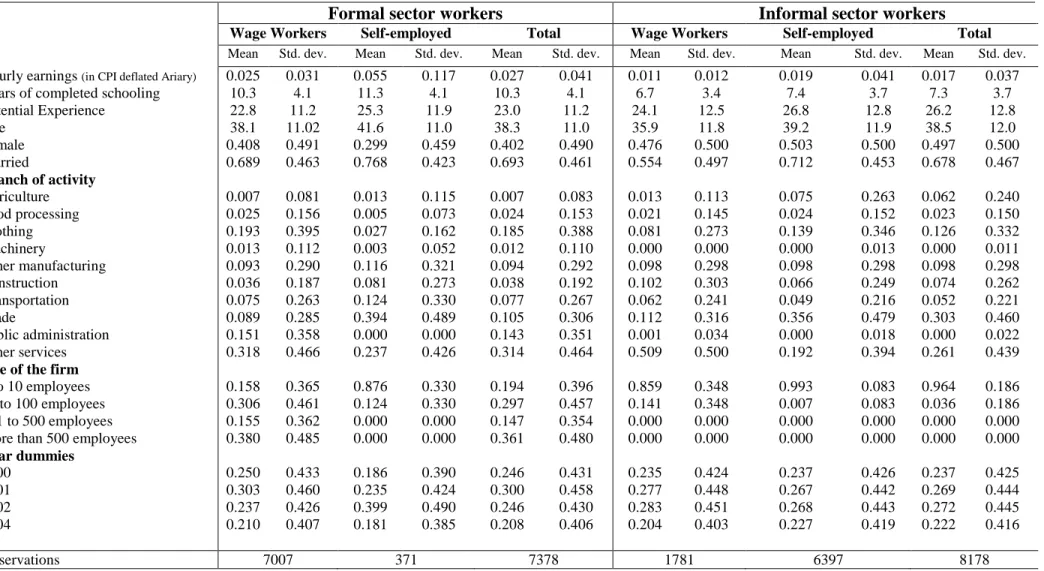
Table 4 presents some basic summary statistics of the main characteristics of the panel data used in our analysis. These descriptive statistics are reported for the sub-samples of wage/self-employed workers, broken down by formal and informal sector jobs.
The results obtained for average earnings are in line with common findings in the literature. Workers holding formal sector jobs earn more on average than those engaged in informal sector jobs. Among each group of formal and informal sector workers, self-employed workers are those with higher earnings in comparison with wage earners. If the average age of the labour force is the same between the two sectors, informal sector wage workers tend to be younger than their formal worker counterparts. Self-employed workers exhibit on average longer potential experience in the labour market (which is calculated as age minus years of reported schooling minus five). As expected, workers having higher level of education are less likely to be engaged in the informal sector and vice versa. The gender ratio varies significantly between formal and informal sector jobs. Female workers have more opportunity to get informal sector jobs, female participation is at its highest in informal self-employment and at its lowest in formal one.
Finally, formal and informal sector workers are differently allocated across branches of activity. Specifically, informal sector employment is found more in trade, restaurants and construction, while formal sector jobs are more concentrated in clothing and services (in particular public administration). Interestingly, the share of manufacture is identical for informal sector jobs than for formal ones (31% in both cases). Within institutional sectors, the distribution is even more unbalanced: informal sector wage workers are stubbornly engaged in services to the person (51%), whereas informal self-employed workers hold trade jobs (36%). Formal sector wage workers are engaged prominently in services (63%), while formal self-employed job’s structure looks like the informal self-employed one. In terms of firm size, formal sector wage workers are as expected over-represented in large enterprises, while the three other groups are quasi exclusively engaged in micro-enterprises (informal self-employed workers operating the smallest ones). These significant differences in the distribution of job structure underline the importance of controlling for sectors of activity and size in our earnings estimations.
14
Table 4. Summary statistics of the variables used in the regressions (pooled rounds 200-2001-2002-2004)
Formal sector workers Informal sector workers
Wage Workers Self-employed Total Wage Workers Self-employed Total
Mean Std. dev. Mean Std. dev. Mean Std. dev. Mean Std. dev. Mean Std. dev. Mean Std. dev.
Hourly earnings (in CPI deflated Ariary) 0.025 0.031 0.055 0.117 0.027 0.041 0.011 0.012 0.019 0.041 0.017 0.037
Years of completed schooling 10.3 4.1 11.3 4.1 10.3 4.1 6.7 3.4 7.4 3.7 7.3 3.7
Potential Experience 22.8 11.2 25.3 11.9 23.0 11.2 24.1 12.5 26.8 12.8 26.2 12.8 Age 38.1 11.02 41.6 11.0 38.3 11.0 35.9 11.8 39.2 11.9 38.5 12.0 Female 0.408 0.491 0.299 0.459 0.402 0.490 0.476 0.500 0.503 0.500 0.497 0.500 Married 0.689 0.463 0.768 0.423 0.693 0.461 0.554 0.497 0.712 0.453 0.678 0.467 Branch of activity Agriculture 0.007 0.081 0.013 0.115 0.007 0.083 0.013 0.113 0.075 0.263 0.062 0.240 Food processing 0.025 0.156 0.005 0.073 0.024 0.153 0.021 0.145 0.024 0.152 0.023 0.150 Clothing 0.193 0.395 0.027 0.162 0.185 0.388 0.081 0.273 0.139 0.346 0.126 0.332 Machinery 0.013 0.112 0.003 0.052 0.012 0.110 0.000 0.000 0.000 0.013 0.000 0.011 Other manufacturing 0.093 0.290 0.116 0.321 0.094 0.292 0.098 0.298 0.098 0.298 0.098 0.298 Construction 0.036 0.187 0.081 0.273 0.038 0.192 0.102 0.303 0.066 0.249 0.074 0.262 Transportation 0.075 0.263 0.124 0.330 0.077 0.267 0.062 0.241 0.049 0.216 0.052 0.221 Trade 0.089 0.285 0.394 0.489 0.105 0.306 0.112 0.316 0.356 0.479 0.303 0.460 Public administration 0.151 0.358 0.000 0.000 0.143 0.351 0.001 0.034 0.000 0.018 0.000 0.022 Other services 0.318 0.466 0.237 0.426 0.314 0.464 0.509 0.500 0.192 0.394 0.261 0.439
Size of the firm
1 to 10 employees 0.158 0.365 0.876 0.330 0.194 0.396 0.859 0.348 0.993 0.083 0.964 0.186
11 to 100 employees 0.306 0.461 0.124 0.330 0.297 0.457 0.141 0.348 0.007 0.083 0.036 0.186
101 to 500 employees 0.155 0.362 0.000 0.000 0.147 0.354 0.000 0.000 0.000 0.000 0.000 0.000
More than 500 employees 0.380 0.485 0.000 0.000 0.361 0.480 0.000 0.000 0.000 0.000 0.000 0.000
Year dummies 2000 0.250 0.433 0.186 0.390 0.246 0.431 0.235 0.424 0.237 0.426 0.237 0.425 2001 0.303 0.460 0.235 0.424 0.300 0.458 0.277 0.448 0.267 0.442 0.269 0.444 2002 0.237 0.426 0.399 0.490 0.246 0.430 0.283 0.451 0.268 0.443 0.272 0.445 2004 0.210 0.407 0.181 0.385 0.208 0.406 0.204 0.403 0.227 0.419 0.222 0.416 Observations 7007 371 7378 1781 6397 8178
15
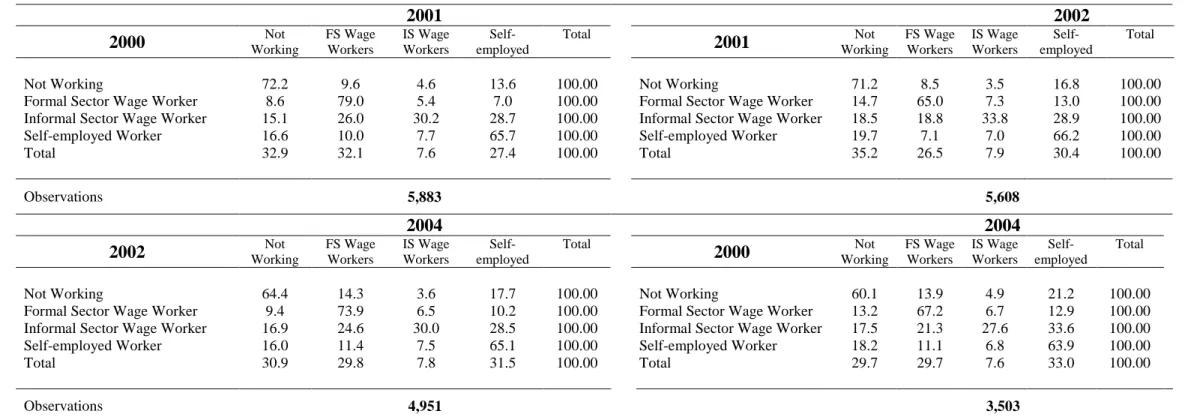
Table 5 reports the job transition matrices by institutional sector and status in employment between 2000 and 2004. All individuals aged 18 years and over are included and split in four groups: formal sector wage workers, informal sector wage workers, self-employed workers and non-working population. To save space and given the small number of observations, formal self-employed workers have been aggregated with informal ones (we will distinguish them in our estimations; see Section 5). Inactive and unemployed are also aggregated into one broad category. First, the proportion of movers (from one category to another) is far from negligible and is quite stable over time. From one year to the next, movers represent around one third of the three samples (from a minimum of 31% between 2000 and 2001 to a maximum of 36% between 2002 and 2004). If we consider only those holding a job, the target of our earnings gap estimations, the rate of mover reduced to one fourth (22% to 26% respectively for the same periods). Formal sector wage jobs are the most stable, followed by self-employment ones. Informal sector wage workers are the most mobile: only 30% keep their status from one year to the other. The flows between sectors follow a consistent pattern. Informal sector wage worker movers mainly get formal sector wage and (informal) self-employed jobs, equally distributed. Formal sector wage worker movers privilege self-employment, but substantial flows go to informal sector wage jobs. Conversely, self-employed workers change more often for formal sector wage jobs than for informal ones, withdrawing from occupation being their first option (retirement).
Another striking evidence is the surprising weak impact of the macroeconomic context on transition flows. Changes in year-to-year transition flows (direction and intensity) are limited, stressing a robust structural pattern. This assessment is confirmed by the long run transition matrix, as shown in the low right panel of Table 5. The 2000-2004 matrix is very similar to the short run matrices. At our four states level, 61% of the sample are stayers, compared to 64-69% in the year to year matrices (73% and 74-79% respectively for those who kept a job). For each of the four initial position, the distribution of movers between categories are surprisingly close to the year-to-year one. However, at the margins, the crisis spell (between 2001 and 2002) shows a significantly lower rate of formal sector wage worker stayers, while the transitions from the informal sector jobs to formal sector ones decline. Bad conditions on the labour market also affect transitions between working and non-working position: in time of crisis, all kind of workers more often become unemployed or inactive than during the growth periods. On the methodological side, the substantial numbers of movers, in both directions, and for all types of jobs, is key for our estimation strategy.
16
Table 5. Transition matrices of employment status between 2000 and 2004 (%)
2001 2002
2000 Working Not FS Wage Workers IS Wage Workers employed Self- Total 2001 Working Not FS Wage Workers IS Wage Workers employed Self- Total
Not Working 72.2 9.6 4.6 13.6 100.00 Not Working 71.2 8.5 3.5 16.8 100.00
Formal Sector Wage Worker 8.6 79.0 5.4 7.0 100.00 Formal Sector Wage Worker 14.7 65.0 7.3 13.0 100.00
Informal Sector Wage Worker 15.1 26.0 30.2 28.7 100.00 Informal Sector Wage Worker 18.5 18.8 33.8 28.9 100.00
Self-employed Worker 16.6 10.0 7.7 65.7 100.00 Self-employed Worker 19.7 7.1 7.0 66.2 100.00
Total 32.9 32.1 7.6 27.4 100.00 Total 35.2 26.5 7.9 30.4 100.00
Observations 5,883 5,608
2004 2004
2002 Working Not FS Wage Workers IS Wage Workers employed Self- Total 2000 Working Not FS Wage Workers IS Wage Workers employed Self- Total
Not Working 64.4 14.3 3.6 17.7 100.00 Not Working 60.1 13.9 4.9 21.2 100.00
Formal Sector Wage Worker 9.4 73.9 6.5 10.2 100.00 Formal Sector Wage Worker 13.2 67.2 6.7 12.9 100.00
Informal Sector Wage Worker 16.9 24.6 30.0 28.5 100.00 Informal Sector Wage Worker 17.5 21.3 27.6 33.6 100.00
Self-employed Worker 16.0 11.4 7.5 65.1 100.00 Self-employed Worker 18.2 11.1 6.8 63.9 100.00
Total 30.9 29.8 7.8 31.5 100.00 Total 29.7 29.7 7.6 33.0 100.00
Observations 4,951 3,503
17
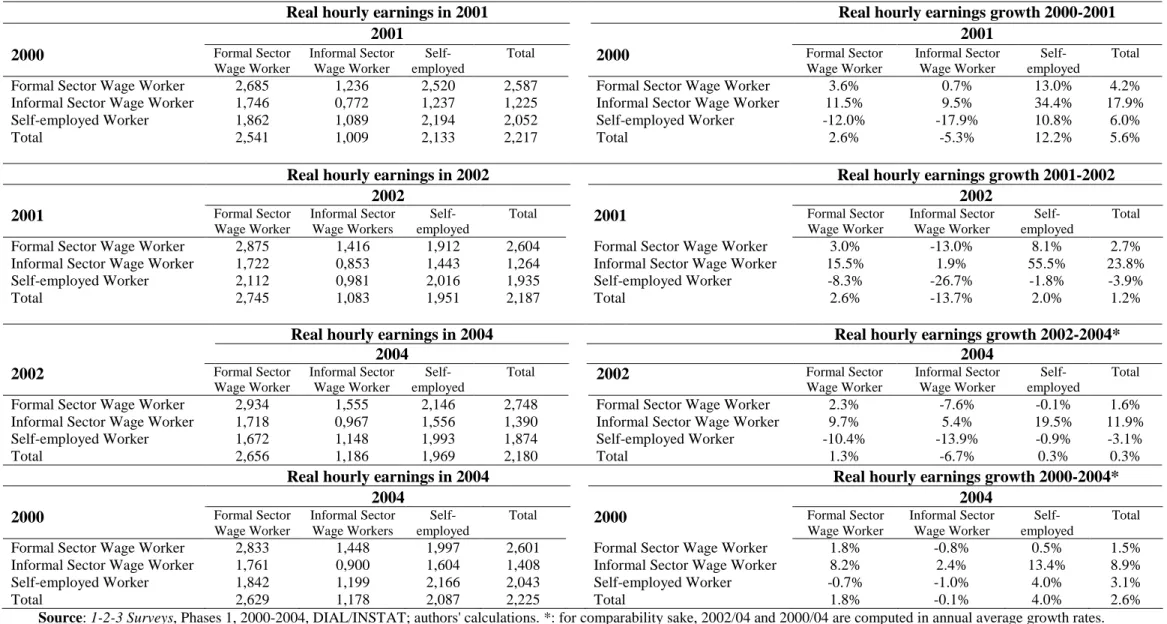
To end this section on descriptive analysis, we turn to the earnings dynamics by institutional sector and status in employment. Table 6 present the levels (in constant 2000 Ariary) and the changes (in %) in real earnings for the three year-to-year periods and the "long run" spell (2000-2004). Compared to Table 5, the panel sample is restricted to the individuals holding a job and having positive earnings in both period. Consequently, those who are not working or unpaid family workers are excluded. The number of observations is around 3,000 for year-to-year matrices and 2,000 for the 2000-2004 matrix.
The left panel of Table 6 shows the level of real hourly earnings in the final date by transition status. Consistently with Table 4, informal sector wage workers get the lowest pay, followed by informal employed, formal sector wage workers and the formal self-employed workers at the highest end of the earnings ladder. If we now take into account transition status, informal sector wage worker stayers systematically perceive less than those who changed to self-employment or formal sector wage jobs. Symmetrically, self-employed stayers get a better remuneration than those who move to formal or informal sector wage jobs, with the exception of the 2001-2002 period. Such exception can be due to a crisis effect (shrink in demand and increased competition), while formal sector wages are more rigid. Finally, formal sector wage worker stayers, as primary labour market insiders, are by far the best compensated workers (compared with the other eight transition status); the only exceptions are formal self-employed workers. This result suggests that, in average, creating an informal firm from a formal sector wage job induces a decline in earnings. Two potential reasons may be invocated: some have been constraint to settle an informal business because of lay-off in formal or institutional factors (like retirement age); non-pecuniary considerations may be at stake, but a lower pay than those who obtained a formal sector wage job.
These unconditional earnings in the end year do not tell much on earning dynamics, initial conditions being only taken into account through the labour status in the base year. Considering growth rates is a first step to control for initial earnings (right panel of Table 6). Moving to informal sector wage jobs is associated with the lowest increase in earnings over all periods, whereas being able to change to a formal self-employed job is associated with the highest earnings growth. Moving out of informal sector wage job ensures higher earnings growth rates, while abandoning self-employment for wage jobs, or formal to informal wage jobs provides lower growth rates. In terms of earnings growth, the picture for those who quit a formal sector wage job to create an informal business is mixed: in two cases out of four they perform better than their stayers counterparts (2000-2001 and 2001-2002), but do worse in the two other cases (2002-2004 and 2000-2004). This suggests a potential trade-off between these two kind of jobs, a stylized feature underlined in the literature, which we will investigate further in Section 5 for the case of Madagascar.
18
Table 6. Earnings dynamics by employment status between 2000 and 2004
Real hourly earnings in 2001 Real hourly earnings growth 2000-2001
2001 2001 2000 Formal Sector Wage Worker Informal Sector Wage Worker Self-employed
Total 2000 Formal Sector
Wage Worker Informal Sector Wage Worker Self-employed Total
Formal Sector Wage Worker 2,685 1,236 2,520 2,587 Formal Sector Wage Worker 3.6% 0.7% 13.0% 4.2%
Informal Sector Wage Worker 1,746 0,772 1,237 1,225 Informal Sector Wage Worker 11.5% 9.5% 34.4% 17.9%
Self-employed Worker 1,862 1,089 2,194 2,052 Self-employed Worker -12.0% -17.9% 10.8% 6.0%
Total 2,541 1,009 2,133 2,217 Total 2.6% -5.3% 12.2% 5.6%
Real hourly earnings in 2002 Real hourly earnings growth 2001-2002
2002 2002 2001 Formal Sector Wage Worker Informal Sector Wage Workers Self-employed
Total 2001 Formal Sector
Wage Worker Informal Sector Wage Worker Self-employed Total
Formal Sector Wage Worker 2,875 1,416 1,912 2,604 Formal Sector Wage Worker 3.0% -13.0% 8.1% 2.7%
Informal Sector Wage Worker 1,722 0,853 1,443 1,264 Informal Sector Wage Worker 15.5% 1.9% 55.5% 23.8%
Self-employed Worker 2,112 0,981 2,016 1,935 Self-employed Worker -8.3% -26.7% -1.8% -3.9%
Total 2,745 1,083 1,951 2,187 Total 2.6% -13.7% 2.0% 1.2%
Real hourly earnings in 2004 Real hourly earnings growth 2002-2004*
2004 2004 2002 Formal Sector Wage Worker Informal Sector Wage Worker Self-employed
Total 2002 Formal Sector
Wage Worker Informal Sector Wage Worker Self-employed Total
Formal Sector Wage Worker 2,934 1,555 2,146 2,748 Formal Sector Wage Worker 2.3% -7.6% -0.1% 1.6%
Informal Sector Wage Worker 1,718 0,967 1,556 1,390 Informal Sector Wage Worker 9.7% 5.4% 19.5% 11.9%
Self-employed Worker 1,672 1,148 1,993 1,874 Self-employed Worker -10.4% -13.9% -0.9% -3.1%
Total 2,656 1,186 1,969 2,180 Total 1.3% -6.7% 0.3% 0.3%
Real hourly earnings in 2004 Real hourly earnings growth 2000-2004*
2004 2004 2000 Formal Sector Wage Worker Informal Sector Wage Workers Self-employed
Total 2000 Formal Sector
Wage Worker Informal Sector Wage Worker Self-employed Total
Formal Sector Wage Worker 2,833 1,448 1,997 2,601 Formal Sector Wage Worker 1.8% -0.8% 0.5% 1.5%
Informal Sector Wage Worker 1,761 0,900 1,604 1,408 Informal Sector Wage Worker 8.2% 2.4% 13.4% 8.9%
Self-employed Worker 1,842 1,199 2,166 2,043 Self-employed Worker -0.7% -1.0% 4.0% 3.1%
Total 2,629 1,178 2,087 2,225 Total 1.8% -0.1% 4.0% 2.6%
19
Of course, these unconditional averages should be controlled for observed and unobserved characteristics, which is the purpose of the following sections. Furthermore, changes in job states are not systematically associated with upwards (or downwards) trends in incomes. Among our 24 groups of movers, 13 of them suffered a lower income growth than their respective stayers, while 11 benefited from a relative increase. This reinforces the identification strategy of earnings gaps based on movers and stayers (see previous section). Finally, our analysis shows that earnings levels and changes are highly dependent on transitions. Transition and earnings matrices are very consistent, confirming the high quality of our data, a feature already stressed in previous methodological papers (Roubaud, 2000; Rakotomanana, 2011). The panel structure fits accurately with our identification strategy to answer the main research question of this paper.
5. Earnings Gaps Analysis
In this section we discuss the earning gaps between formal and informal sector jobs at the aggregate level, estimated using the four estimations procedures presented in Section 3. As discussed earlier, the informal sector is immensely heterogeneous. The theoretical literature, as our own empirical evidence, suggests that a key divide should be considered within the informal jobs, between wage workers and self-employed. If the point is now well established in the literature, formal sector job heterogeneity is rarely acknowledged. So we distinguish between four groups of workers, split by job status (wage workers vs. self-employed) and institutional sector (formal vs. informal). In the following discussion, we compare the three other work status with formal wage workers, as our benchmark. We also investigate the gender issue.
Formal vs. informal sector workers
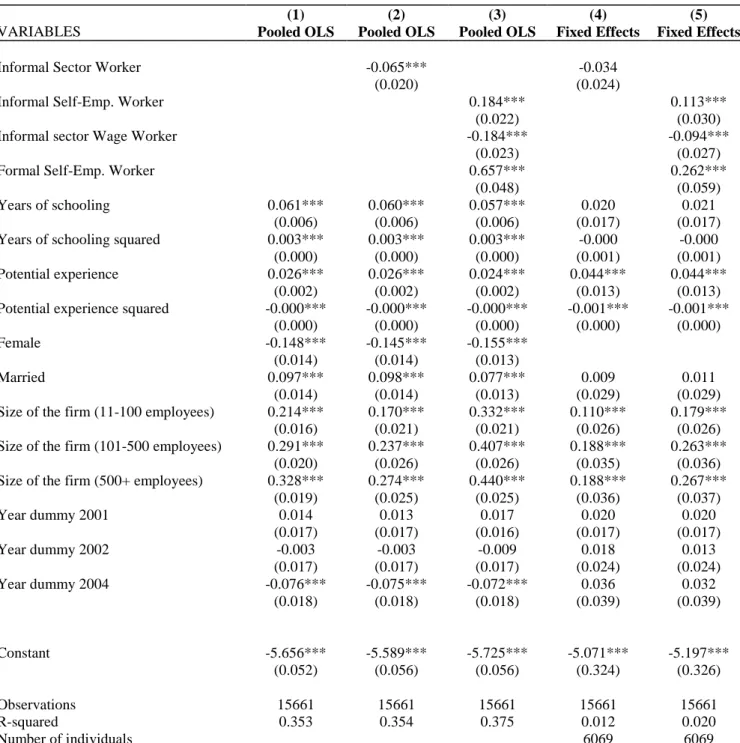
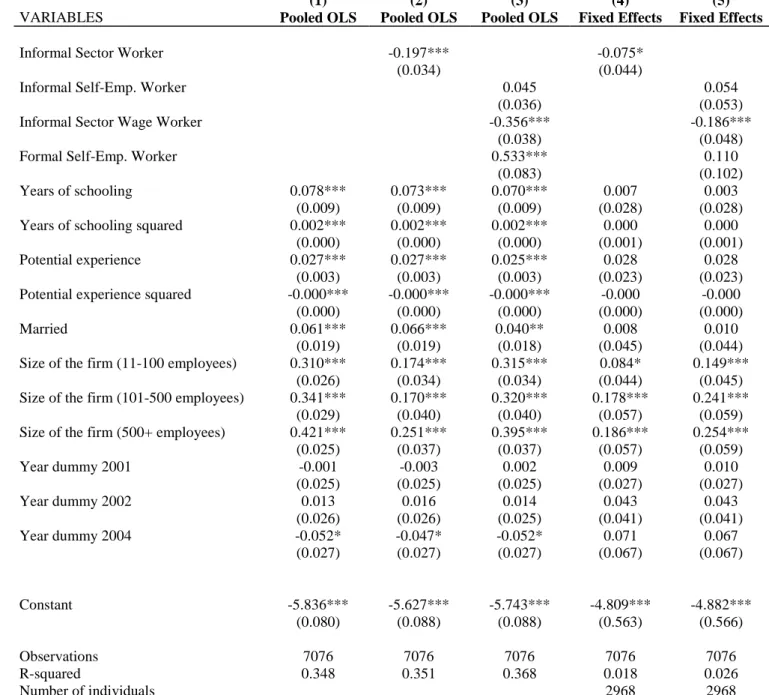
At the aggregate level, not considering firm size, the OLS estimate of the informal sector employment earnings gap is a rather huge -20%.8 Taking into account the (time invariant) unobserved individual characteristics (UICs) through fixed effect OLS estimation (FEOLS) reduces the earnings penalty significantly, down to -10%. Thus, nearly half of the gap can be explained by unobserved characteristics, the most productive workers privileging the formal sector. As always, this standard feature does not tell us much about what specific factors are really at play. On the one hand, the innate ability or the “talent parabola” is commonly stressed in the literature. On the other hand, many other explanations can be put forward. For instance, UICs may have to do with more efficient social networks to get a formal sector job. However, the remaining -10% gap, once we control for UICs, highlights that formal sector jobs provide higher earnings per se. Here again, this result can be due to various
8
20
factors which end up, at the firm level, in a higher productivity or market power, and/or, at the worker level, in a stronger bargaining power of formal workers to negotiate higher earnings.
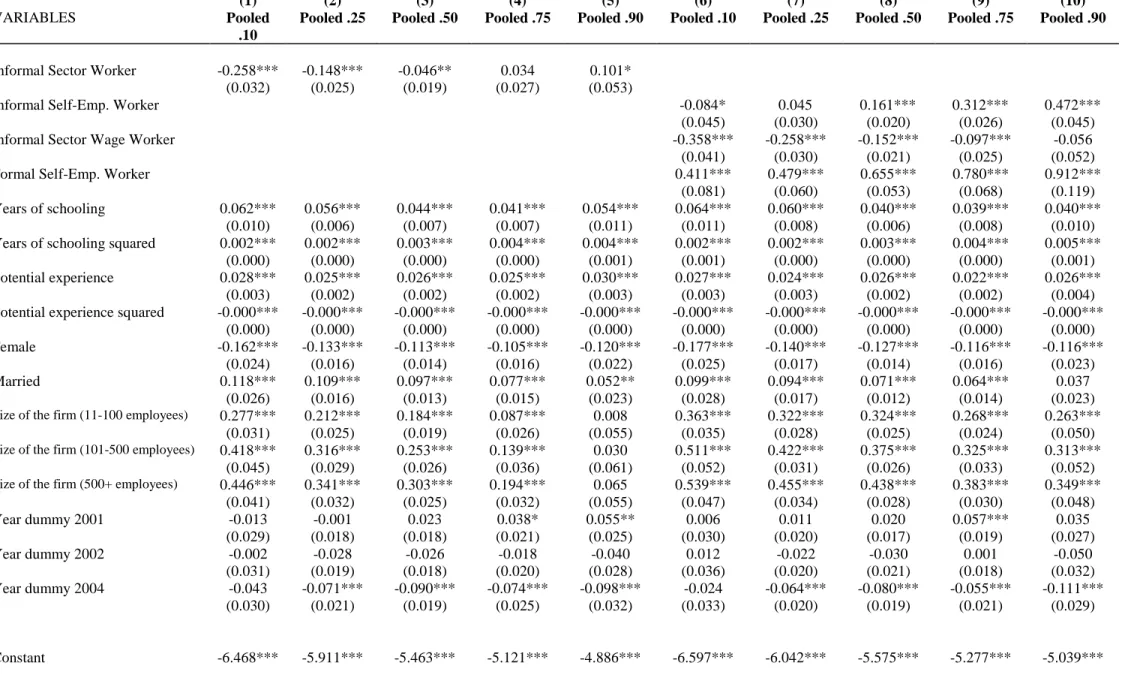
To go beyond average, we ran quantile regressions. While informal sector workers suffer earnings penalties at almost all levels of the conditional distribution, the gap is sharply decreasing from the bottom to the upper part. Beginning with a huge -38% (quantile .10), the gap continuously shrinks to become insignificant around quantile .80. From then, it even reverts to reach +7% at the upper-tier of the distribution (quantile .90). The Fixed Effects Quantile Regression (FEQR) gap not only confirms both the key role of UICs in reducing the “true” gap but also the pattern along the earnings distribution: from -28% for the bottom quantile (quantile .10) to 14% for the upper one (quantile .90).
However, once we control for the size of the enterprises, the average earnings gap nearly disappears. The OLS gap is only -6.3% (Figure 1A and Table A1), while the FEOLS is slightly negative but non-significant. Interestingly, the profiles of the earnings gap along the distribution remain unchanged, with a systematic penalty decline for informal sector workers from the lower to the upper tier (QR, Figure 1A and Tables A4 and A5). The QR estimates range from a -23% penalty for informal sector workers at the bottom (q.10) to a 11% bonus at the top (q.90), while the respective numbers are -13% and 10% for FEQR, the turning point (from penalty to bonus) being around the third quartile in both cases.
The interpretation of the size effect is not straightforward in our informal vs. formal perspective. First, conditional earnings grow with the size of the enterprise, as shown in Table A1. This result is robust to any of our specification and consistent with the literature in this respect. Second, as the informal sector is often defined as enterprises under a certain size threshold (minus 5 or 10 workers), introducing the size in our estimation as an independent variable tends to absorb the impact of informality on earnings. This is all the more the case that the two criteria used to identify the informal sector (size and registration) are highly correlated. In the remainder of this paper we still decide to comment the earnings gaps based on the regression including the size as an independent variable. As a consequence, two important points should be kept in mind: our results focus on the impact of non-registration on earnings, net from the size effect; the exhibited gaps should be interpreted as the most conservative estimates, which are systematically higher without control for the firm size.
Finally, whatever the earnings equation specification (with or without size), the huge gap variations along the distribution point to the intrinsic informal sector heterogeneity. This result is mainly due to the fact that the “dualistic assumption” is too rough, gathering together very diverse categories of workers within each sector, which we investigate below in more details.
21 Formal vs. informal wage workers
As expected, within wage workers, those employed in the informal sector are on average worse-off than their formal sector counterparts (Figure 1B and Table A1, column (3)). The OLS gap (-17%) is significantly reduced to -9% when individual fixed effects are introduced, suggesting that informal wage workers may have a disadvantage in terms of their unobserved productive attributes. Taking or not taking into account the fixed effects, the gap is continuously decreasing (Figure 1B and Tables A4 and A5): from -30% (quantile .10) to -5% (quantile .90; non-significant) for the latter, and from -16% to 1% (non-significant) respectively, when controlling for UICs. In both cases, formal sector wage workers conserve an earnings advantage at any position in the pay ladder. Even if we cannot exclude that non-pecuniary disadvantages of formal wage jobs may be compensated by earnings (such as poor working conditions),9 these results could be taken as an acceptable validation of the exclusion hypothesis (for this category of workers), according to which informal wage workers are constraint in their job choice, and are probably queuing for formal jobs.
Formal wage vs. informal self-employed workers
For the bulk of the labour force, this alternative choice is probably the main trade-off, and also the most discussed in the literature. At odd with the previous case considered and more generally the dualistic approach, the conditional OLS gap is positive, with a significant premium of +20% for the informal self-employed (Figure 1C and Table A1, column (3)). Furthermore, the FEOLS models increase the premium further to +12% (column (5)). Again, this would mean that informal self-employed workers have an advantage in terms of their unobserved productive characteristics (probably in terms of their entrepreneurial skills), which produces an overestimation of the premium associated with being an informal self-employed worker compared to exerting as a formal wage worker if this individual heterogeneity is not accounted for. We nevertheless should be cautious before claiming that the exit option may be at stake, as the self-employed earnings may be overestimated for at least two reasons: first, the measure of earnings we computed remunerates both labour and capital factors (mixed income), the latter being far from negligible in the informal sector (Vaillant et al., 2011); second, the self-employed earnings include the share which should be attributed to the productive contribution of unpaid family workers. As we do not have any order of magnitude of these two phenomena, it is difficult to exclude the possibility that the premium we obtain may not turn into a penalty, once these two factors are taken into account.10
9
For a detailed analysis of the possible existing pecuniary compensations for working conditions along the earnings distribution, see Fernández and Nordman (2009) in the case of UK.
10 The definitive assessment is even more complex as measurement errors in incomes are usually considered as more important for self-employed than for wage workers, as the former usually do not know their precise level of income (especially informal self account workers who do not have book accounts), and the richest ones tend to understate their level of activity.
22
When turning to quantile regressions (Figure 1C and Tables A4 and A5), the distributional profile of the gap presents the same now clear pattern, as in the two previous cases. The gap steeply increases with earnings level, and is in favour of the informal self-employed workers. In absolute terms, informal self-employed labourers suffer a penalty only at the lowest end of the conditional distribution (up to about the first quartile where the gap is not significant). Afterwards, the gap is reversed into a significant premium, growing continuously up to 60% for the richest decile (quantile .90), crossing the OLS estimate at the median point of the earnings distribution. FEQR confirm this trend, the only difference being that the range of variation of the gap along the distribution is attenuated. Once the UICs are controlled for, informal self-employed workers are better-off at all points of the pay scale above the first quartile up to 39% at quantile .90. All in all, and given the size of the premium, we can confidently conclude that informal self-employment may be more lucrative that formal wage alternatives, especially for the richest workers. As a matter of consequence, we have good presumptions to assert that, in Madagascar, a substantial part of the labour force has deliberately chosen to work in the informal sector as non-wage workers, for pecuniary reasons.
Formal wage vs. formal self-employed workers
The earnings comparison of formal wage workers and formal self-employed workers is clearly in favour of the latter, whatever the model chosen (Figure 1D and Tables A1, columns (3) and (5)). The OLS estimate presents a +93% premium, just slightly reduced with fixed effects (+30%). As with the informal self-employed workers, their unobserved productive attributes may be better than those of the formal wage workers. As in the case of informal self-employed workers, the premium is continuously increasing with earnings levels, but is translated upwards, a pattern in line with the empirical results obtained in the literature for developed countries. Controlling for UICs or not, formal self-employed workers are always better-off in terms of earnings than formal sector wage workers, the premium culminating at +149% (QR) and +69% (FEQR). Overall, it seems that the Malagasy labour market functions under a regime of wage repression. Whatever the reasons - macro pressures of international integration, deliberate policies to control inflation, or weak bargaining power of the wage workers; the latter being the most plausible -, it seems globally preferable to work as an independent (even in the informal sector) than as a wage worker (at least in non-farm activities).
Formal vs. informal self-employed workers
Lastly, we turn to the comparison between the two kinds of self-employed workers: formal and informal. Formal self-employed workers are rarely considered in the literature on LDCs, maybe because they are too few in the countries considered. But there are many reasons to focus on this category of workers: first, to compare our results with those obtained in developed countries on salaried vs. non-salaried workers’ earnings gap, as in these countries self-employed workers are quasi-exclusively formal; second, because it allows us to
23
establish the link with the existing formal/informal sector literature from a business perspective (not job). Finally, the comparison appears more legitimate as the nature of incomes and unobservables potentially at play are in both cases equivalent (which is not true concerning wage workers).
Formal self-employed workers are systematically in a better position than their informal counterparts, all along the pay scale (Figure 1E; the reference group is now informal self-employed workers; regressions tables are not reported to save space). Returns to firm’s formalization is always positive and increasing with the net earnings, even when controlling for entrepreneurial skills and other unobserved characteristics, the most favoured in this respect choosing disproportionately the formal sector. This advantage of formal household businesses may be due to higher initial level of physical capital or more productive combination of factors (our models do not provide elements on this point), but it is compatible with the potential causal benefits of getting formal (access to credit and markets) as found in the literature.
A gender perspective
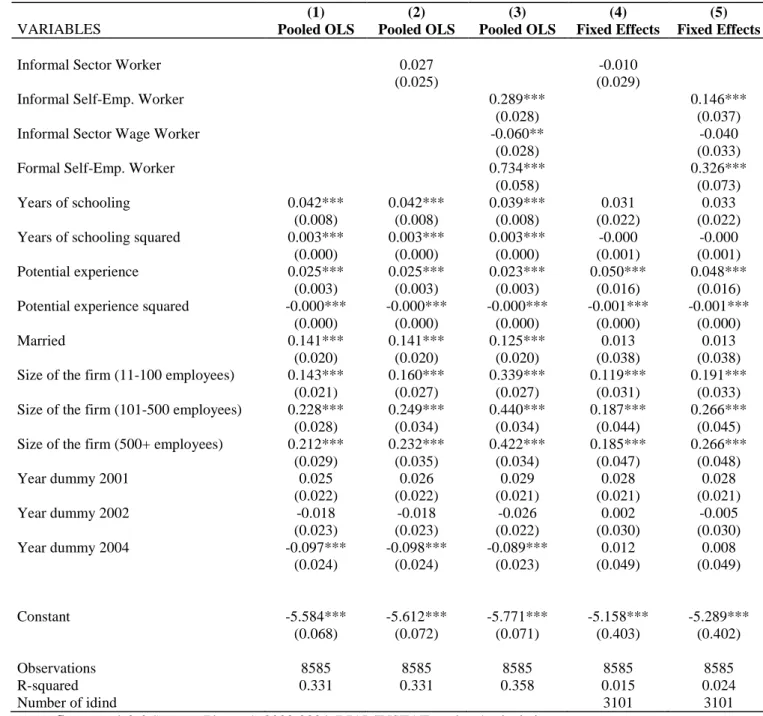
Exploring the gender dimension associated with informality is crucial for various reasons. First, there is strong imbalances in the job structure, female being more prone to hold informal sector jobs than their male counterparts. Second, the raw gender earnings gap is in general significantly higher in the informal sector.11 Finally, and more importantly, the motivation to hold informal sector jobs is highly dependent on gender. Women may have a welfare function which is less dependent on income incentives, as they take more care of extra professional activities (as family life, children care, social relations, etc.), where informal sector jobs could be a more satisfying option. Without going into details, we highlight the main findings displayed in Figures 2 and Figures 3 and their corresponding regression tables reported in Tables A2, A3 and A6 to A9.
Firstly, whatever the models’ specifications and the category of workers considered, females always financially suffer more (or benefit less) when they are employed in the informal sector. For instance, at the aggregate informal vs. informal level (Figures 2A and 3A), the OLS gap is slightly (but not significant) for men while reaching -18% for women; the FEOLS being respectively 1% (non-significant) and -7% (significant at the 10% level). Such a feature is compatible with the idea mentioned above, that women may accept lower wages in the informal sector because it provides other non-pecuniary advantages, relatively more valuable to them. However, it can also reveal barriers or labour market segmentation, which would be more pronounced for women competing for formal sector jobs.
11
For Africa, see Nordman, Robilliard and Roubaud (2011) for estimates of the gender earnings gap in the formal and informal sectors of different West African capital cities using household surveys, Nordman and Wolff (2010) for formal sector gender earnings gaps using matched worker-firm datasets for seven African countries and Nordman and Roubaud (2009) and Nordman, Rakotomanana and Robilliard (2010) for the case of Madagascar.