D
OCUMENT DE
T
RAVAIL
DT/2002/11
Those in Kayes.
The impact of remittances on their
recipients in Africa
Jean-Paul AZAM
Flore GUBERT
THOSE IN KAYES.
THE IMPACT OF REMITTANCES ON THEIR RECIPIENTS IN AFRICA1 Jean-Paul Azam
(ARQADE, IDEI, University of Toulouse Institut Universitaire de France and CSAE, Oxford)
Flore Gubert
(DIAL – UR CIPRE de l’IRD) [email protected]
Document de travail DIAL / Unité de Recherche CIPRE Octobre 2002
RESUME
Cet article décrit rapidement les migrations des Soninké et les interprète comme une stratégie de diversification des risques, à la lumière des développements théoriques récents. Les études historiques et ethnologiques de ces mouvements migratoires suggèrent que ce n'est pas seulement le bien-être des familles restant au village qui est assuré, mais également l'honneur du clan. Un modèle théorique en équilibre partiel est proposé pour saisir aussi simplement que possible ce phénomène. Celui-ci met en évidence le problème de risque moral qui en découle. Un test économétrique de cette prédiction est effectué sur des données d'enquête collectées par l'un des auteurs au sein de la région de Kayes (Mali), la principale zone d'origine des migrants maliens en France.
ABSTRACT
This article briefly describes the Soninke labor migration, and interprets it as a means of diversifying risk in a context of missing insurance and credit markets. Historical and anthropological studies on this ethnic group are briefly surveyed, and suggest that it is not only the well-being of those left behind which is insured by the migrants, but also the pride of the clan. A simple partial-equilibrium model is developed to capture this phenomenon, which gives rise to moral hazard problems. This prediction is tested econometrically using an original data set collected by one of the authors in the Kayes area (Western Mali), the main source of Soninke labor migration to France.
1This paper is a revised version of the contributed papers at the Harvard Africa Seminar, the Commissariat Général au Plan, at seminars in Paris, Clermont-Ferrand, Oxford and Toulouse, and at the World Congress of the Econometric Society in Seattle. We are grateful to Jean-Louis Arcand, Robert Bates, François Bourguignon, Pierre Dubois, Denis Fougère, François Héran and Thomas Picketty for useful comments, without implicating. We are also grateful to the Institut de Recherche pour le Développement (IRD) for financial support and to Boubou Konaté, Moussa Sidibé and Adama Sow for excellent field support.
Table des matières
1. Introduction……….1
2. The Genesis of the Soninke Migration ………..………..………..7
History ...………8
Social Anthropology ………..9
3. Theoretical Framework ………..11
The Incentive to Shirk ……….12
The Combined Impact on Utility ……….17
Determination of the Effort Level ………19
4. Data and Summary Statistics……….21
Household Characteristics ……….22
Farming Performance ………25
5. Empirical Analysis ……….28
Estimation of Households’ Productive Efficiency ………28
The Determinants of Households’ Efficiency ………32
6. Robustness Checks ………35
7. Conclusions ………..37
Appendix References
Liste des tableaux
Table 1. Distribution of sample households by migration status and ethnic group ……….22Table 2. Amount of Remittances Received per Household in 1996 ………23
Tableau 3. Sources of Income in 1996 ………24
Table 4. Distribution of Common Plots by Primary Crop and Migration Status in 1996 …………25
Table 5. Farm Tools and Cultivation Labor, by Migration Status ………26
Table 6. Value of Aggregated Crop Output, by Migration Status (1,000 CFA F) ………..27
Table 7. Determinants of technical efficiency ………34
Table A.1. Summary Statistics for the Variables ……….39
Table A.2. Cobb Douglas Production Function: Regression Results ……….40
Table A.3. Probit Model of Remittances ……….41
Table A.4. Mean Predicted Probabilities by Place of Residence ………42
Table A.5. Results of the Selection Model ……….44
Liste des graphiques
Map. 1: Geographical Origin of the Soninke Migrants ………..………..7
Figure 1: Expected Consumption as a Function of Effort ……….17
Figure 2: Determination of the Effort Level ……….20
1. INTRODUCTION
There is a very active literature on the impact of emigration on those residing in the country of origin. From a general equilibrium point of view, Rivera-Batiz (1982) showed that, without remittances from the migrants, those remaining behind suffer a welfare loss when migrants leave. His argument is based on the shrinkage of the set of possible transactions, insofar as those remaining behind cannot anymore exchange non-tradable goods with those who left, what they were initially able to do. Under standard assumptions about preferences and technology, this entails a fall in welfare. However, this neglects the important phenomenon of remittances that the migrants send back to their relatives stayed behind. Djajic (1986) then showed that these transfers improve the welfare of the residents of the country of origin, even of those who do not receive the remittances, because they enlarge the set of possible exchanges between tradable and non-tradable goods. The net effect of remittances thus turns out to be ambiguous in this framework.
Then, the issue of the impact of remittances becomes as important as that of the decision to migrate, and many empirical studies have been devoted to it. This problem arises in similar terms with international migrations and with rural-urban migrations within the same country. The paper by Rempel and Lobdell (1978) put out the first challenge in this literature, by concluding that remittances from the migrants to the city had very little impact on the development of the region of origin, after an econometric analysis of some rural household data from Kenya. This result has been criticized by Collier and Lal (1984), who show in the case of Kenya again, how remittances enabled the recipient families to have more productive capital than the others. In his early study of migration from Kasumpa village in Zambia, Bates (1976) shows that households earning lower incomes in the village receive more remittances from town than richer ones, after controlling for demographic composition. Stark, Taylor and Yitzhaki (1988) show that this type of transfers tend to reduce income inequality in a Mexican village having migrants in the USA, but suggest that the poorest are excluded from migrating. Banerjee and Kanbur (1981) and Faini and Venturini (1993) conclude, by different routes, that migration and its benefits concern more the middle income classes of the society of origin than the two extremes of the distribution, in the cases of India and Southern Europe, respectively. On the contrary, Gustafsson and Makonnen (1993) analyze the impact on poverty in Lesotho of the transfers sent by the migrants working in the mines in South Africa, and conclude that the incidence of poverty would go up by about 15 % were this flow of transfer to stop, and that it would affect many social and demographic groups that are immune from it nowadays.
Hence, there is a wide diversity of results in this literature on the effects of migration and remittances on the migrants’ economy of origin. However, a weakness of these works is often to offer an evaluation of the effects of the remittances without referring to the motivations behind them, which probably determine their impact to some extent. A variety of theoretical models has been proposed to explain migration. The early models focus on the differentials in wages and employment conditions between rural and urban areas or between countries. In the Todaro model, for example, what matters to the potential migrant is the present value of expected urban earnings compared to the present value of rural earnings (Todaro, 1969). Bates (1976) emphasizes the intertemporal investment dimension, within a life-cycle framework. The “new economics of labor migration” (Stark, 1991), in contrast, views migration as reflecting an intra-family co-insurance arrangement aimed at minimizing income risks and facilitating consumption smoothing. Stark and Levhari (1982) and Katz and Stark (1986), among others, develop this theory. The starting point for this approach is the recognition that income risks have a strong spatial dimension in rural areas of low-income countries, individual risks being strongly and positively correlated locally. This feature implies that the formal institutions for managing risk are imperfect or absent, giving rural households an incentive to self-insure through the geographical dispersion of their members. In the
incidence of disease, pests and fire, variations in the price of marketed output, etc.) families can rely on the migrants for financial support.
Lucas and Stark (1985) analyze in detail various potential motivations that could explain why migrants transfer some income to their relatives remained behind in the village, with a view to test various forms of altruistic or egoistic behavior. Using survey data on Botswana, they conclude that mixed motivations of moderate altruism or enlightened egoism seem to prevail. Their empirical analysis supports the view that the migrants do provide some insurance services, by transferring more money when a drought threatens the livestock. However, they also show that wealthier families receive more than the poorer ones. Several other indications suggest that the migrants are motivated by the defense of their inheritance rights or their ability to come back to the village with dignity. Our analysis below provides some additional elements regarding this point, shedding some more light on why richer families get more remittances. The insurance role of remittances is also brought out by Drèze and Sen (1989) who show that many rural households in Kenya have been protected from the effects of the 1984 food crisis by transfers from their relatives or friends, in particular by the urbanites.
However, several authors have pointed out that the geographical dispersion of the individuals who might benefit from a risk-pooling arrangement makes such arrangements difficult, given the need to monitor performance as a consequence of moral hazard (for example: Rothschild and Stiglitz, 1976, Binswanger and Rosenzweig, 1986, Newbery, 1989, Platteau, 1991). Indeed, without monitoring device, each participant in the insurance pool has an incentive to underreport income or to reduce his labor effort in order either to be eligible for financial assistance or to be dispensed from supporting others. Thus, while the distance between contracting agents provides a risk-pooling benefit, it also increases information and enforcement costs.
Though many theoretical papers have emphasized the trade-off between incentives and insurance, few empirical tests have appeared in the recent literature. Exceptions include Ai, Arcand and Ethier (2002), Dubois (2002) and Wydick (1999). However, we are not aware of a paper investigating empirically whether migration as an insurance mechanism actually gives rise to moral hazard. The present paper aims at filling this gap. We use original data collected in the Kayes area in Western Mali to investigate whether migration and remittances are an impediment to technical efficiency in agriculture because of moral hazard. In other words, we test whether the farmers left behind in the village indulge in some “shirking”, when they benefit from some insurance by one or several migrants from their family. The data set is based on a sample survey conducted by one of the authors in eight villages of the area, between January and April 1997. More than 300 randomly selected households were surveyed. Remittances from migrant workers form an important part of their incomes, and there is some evidence that migration is to some extent an insurance arrangement. Gubert (2002) has tested this by showing that the amount of remittances sent is indeed affected by various negative shocks affecting their families. The findings presented below accord with conventional wisdom about the effects of insurance in a context of imperfect monitoring of effort: the more insurance is provided by the migrants, the less incentive their families have to work. This result provides some insights into the relationship between labor migration and agricultural production.
The Kayes area is especially interesting for several reasons. First it turns out that most Malian migrants to France come from this place. In view of the political turmoil surrounding the issue of illegal immigration from this country that has occurred in France, there is a need for some dispassionate empirical analysis of the determinants and the consequences of this migration flow. In 1997, just after our survey was performed, France has launched a policy of “co-development” in this area, aimed at complementing repressive measures against illegal immigration at the other end with an aid program designed to promote stay-at-home development in this area. Documenting the
effects of remittances on the families left behind is thus important for designing appropriate policies to be implemented there.
Second, a close examination of the data shows that all the people of the Kayes area are not equally concerned by migration to France. One ethnic group is significantly more involved in it than the others, namely the Soninke. Its region of origin straddles the borders between Mali, Mauritania, and Senegal, along the Senegal river (see map.1). In fact, among these African migrants to France, and nowadays to many other countries, including Japan and the USA, their nationality, from Mali, Mauritania or Senegal, matters less than their ethnic origin. Because of the role of migrant networks in facilitating the adjustment to the French, or other foreign, way of life of the new migrants, and in helping them to find a job and an accommodation, people connected by ethnic links are vastly more represented than the others.
Fortunately, and correlatively, this group that has been involved in migrations for centuries has been thoroughly studied by anthropologists and historians. This provides a rich opportunity for combining the tools of the empirical economist with those from these neighboring social sciences. The recent book by the late François Manchuelle (1997) is an incredible sum of the historical and anthropological information that we have on this group, whose history has been dominated by the phenomenon of migration for centuries. The next section is based on this book, and summarizes some relevant aspects of this historical experience. They suggest that the economist’s view of migration as an insurance device, while basically correct, must be refined to fit the facts. A social-anthropological dimension must be added, in order to understand its determinants more accurately. It does not seem that the objective pursued by this insurance system is simply to protect the family left behind from income or consumption fluctuations. It rather seems to aim at defending a given social status. This is an important nuance, which does not however entail any major theoretical revolution. The social status of the whole clan would be seriously tarnished if the consumption of those remaining in the village was to fall drastically in the wake of a failed harvest because of a drought or for any other reason. It seems that the defense of the pride of the family or the clan is the main motivation behind the willingness of the migrants to cover the risks of those remaining in the village by transfers (see e.g. Manchuelle, p.20). It is less an aversion to consumption fluctuations which is at stake than the shame that would affect the whole clan if the family was to be visibly weakened after an exogenous shock.
The simple theoretical model presented in section 3 aims at capturing this type of phenomenon, by emphasizing the utility cost of a shortfall of consumption below some family-specific threshold, rather than the usual consumption-smoothing objective. This view was very much supported by our survey, showing that the village families think in terms of “needs” and “deficits”, which they can quantify with some precision. This model also lays the ground for the econometric analysis that follows, by bringing out the type of moral hazard that this behavior entails, assuming that the effort level of the village family cannot be contracted between them and the insuring migrant. After a presentation of the data and some summary statistics in section 4, the main prediction of our model is tested, after estimating a production function using panel data with household-specific fixed effects in section 5. Some robustness checks are performed about the moral hazard diagnosis in section 6. Section 7 summarizes the findings of the paper.
1. THE GENESIS OF THE SONINKE MIGRATION
The Soninke were originally settled in the upper Senegal River Valley, which encompasses what are nowadays Eastern Senegal, Southern Mauritania and Western Mali. Today, some of their descendants may be found in Central Africa, in Europe and even in North America and Japan.
castes, which is still affecting people’s behaviour. More particularly, there existed a strong caste separation between slaves, artisans, and aristocrats from the “chiefdom”, i.e. members of the village community with specialized functions (either economic, religious or military). In fact, the fate of the slaves was often preferable to that of many craftsmen, if they had belonged to rich families for more than one generation.
Map. 1: Geographical Origin of the Soninke Migrants
Source : Manchuelle (1997) (originally from Diarra, 1969).
2.1. History
During the 18th century, the upper Senegal River area was the chief grain producer of West Africa, and exported its millet both to the north, in its trade with the white nomads of the desert, and to the south. Production was then largely performed by slaves, who accounted for between one third and one half of the population. Many religious men and other free people were highly involved in trade. The Soninke country was in direct contact with the desert people, who were selling salt, livestock, and gum Arabic, in exchange for grain and slaves, as well as for grazing rights during the dry season. The Soninke were thus importing more of these goods from the desert than their consumption needs, and formed trading expeditions toward the south, for on-selling these goods and the millet as far south as the north of modern Côte d’Ivoire and Guinea. They brought back such southern products as cola nuts, and most importantly slaves.
At the end of the 18th century, traders from Europe, especially from France, came to intervene in this commerce. The French built the fort of Bakel, on the Senegal river, to the west of the Soninke land, for housing a trading post. Their aim was to take advantage of the possibility of shipping the cargo down the Senegal river, downstream of Bakel, up to Saint Louis and the Atlantic ocean. The Soninke soon realized that it was quite inefficient to keep on producing in the upper Senegal river valley, and then to transport the produce to Bakel for trading it against slaves and the manufactured goods brought there by the European traders. Sailing on this part of the river, upstream from Bakel, is uneasy, and becomes impossible from November on, especially during the driest years. They found far more efficient to migrate for the rainy season to the Bakel area, to go and grow cereals,
and then more and more groundnuts, on rented land. The produce could be sold on the spot, and this allowed to sail back upstream much earlier in the year. This so-called “navetane” system of temporary migration formed the basis of the enrichment of many Soninke families.
Later, as this trade was growing in size, new jobs became available on the steam boats used for transporting these goods up to Saint-Louis, and from there to France. The Soninke migrants were then hired as “laptots” on these boats, getting in these jobs higher earnings than as “navetanes”. Even young men of royal lineage were attracted by these earnings, which allowed them to accumulate quickly a substantial capital, and thus to improve their position within their clan. At first, they were content with sailing between Bakel and Saint-Louis, and sometimes went out further up to Dakar. A direct route to Dakar was also opened in 1923, as the railway between Thiès and Kayes was completed. This one runs through the main groundnut basin of Senegal, and many young men then migrated as “navetanes” in this area, around the city of Kaolack. However, aristocrats were more attracted by sailor positions. They quickly found jobs on ocean going ships sailing from Dakar to Bordeaux or Marseilles. There, they established the first Soninke communities in France, from which they moved to other cities, including the Paris area. This movement went on expanding up to the present time. Most of the time, they hold jobs requiring low qualifications and live in poor conditions in immigrants' hostels. However, they save a large fraction of their earnings for preparing their return to their country. They invest in small productive projects there to some extent, but mainly in their social network, which will ensure their dignity and their subsistence for their old days.
2.2. Social Anthropology
In fact, Soninke migrants do not uniformly come from all the social strata of the society. Only families with a fairly high social status are investing in this type of circular migration. Among them, the religious caste and the aristocrats, and their slaves, are particularly concerned. The participation of slaves in circular migration needs to be clarified. The Soninke aristocracy has been widely criticized in the literature because of the way it treated slaves. This is particularly true for slaves of the first generation, who were living with their masters. But as soon as they got married, slaves of the second generation benefited from a more favorable treatment, close to the one assigned to serfs in Europe in the Middle Ages or in Russia before the October revolution. They could cultivate their own plot of land in exchange for some labor time spent on their masters' plots. Many slaves were thus reasonably well off and could buy their own slaves to support them in their old days.
Initially based on the ownership of the fertile land located near the river, power and honor in the Soninke society were highly dependent on wealth and on the number of clients. Slaves were playing a major part, and many of them were able to gain some political and economic influence within their master's clan. Observers are often surprised that most slaves decided to stay with their masters after the abolition of slavery, although they could legally leave them. What the abolition of slavery actually did was to strengthen their bargaining position to some extent, by allowing them to leave their former masters in case of conflict. But it did not fundamentally alter the economic link between them. Former slaves were still highly dependent on their master to find a spouse, and their children were still entrusted to them. The lot of slaves owned by wealthy families was actually much preferable than that of most free individuals (especially the artisans). Former slaves and their descendants did improve their legal rights, but even today, they still bear the constraints related to their social status. The most surprising is their role in the migration system. Very often, they are allowed to migrate far away, even in France. This is partly due to the fact that their wife and children are staying behind, but this is endogenous to some extent. A returning migrant with a large capital can earn a fairly high social status in his society, even if he belongs to the former slave caste. He must give a share of it to his master, who will give him in return a position in his clientele, with
some positive fall out. His new status within the clientele will be marked by the performance of some visible tasks in some ceremonies, and by various gifts that he will receive regularly.
Therefore, the Soninke, who comprise a large share of the African migrants to France, or to other places in Africa, Europe, or even America, belong in fact to some relatively high-ranking clans, whose wealth and size ensure prestige and political clout in their society of origin. Prestige belongs to the one who gives, here as in most other African societies, and the welfare of his clientele guarantees it (N’Diaye, 1995). The “griots” (praise singers) will ensure his reputation, as a function of the gifts received, and it will spill over to the whole clan. By giving away a share of his earnings in favor of his clan, the migrant reinforces both his position within the clan, and the status of his clan within the Soninke society. His own position within the society thus depends as much on that of his clan as on his own one.
The model that follows aims at capturing some of these features, in as simple a setting as possible. It is a partial equilibrium model, leaving aside many interesting complications, with a view to focus on the main point of the subsequent empirical exercise.
3. THEORETICAL FRAMEWORK
The first salient feature of production conditions in the Kayes area is that returns are extremely unpredictable, may be even more so than elsewhere in the Sahel, after the climatic changes of the 1970s and 1980s. A drought or an invasion of insects can reduce drastically output, or even wipe it out. Denote y output and e the effort level exerted by the family to get it, with a productivity α. Risk can be simply captured by the following production function:
e
y=α , (1)
where α∈[0,α], with a cumulative distribution function F(α), and a density function f(α). Its expected value is denoted Eα.
Then we want to capture simply the effect of remittances. As suggested by the data and by many discussions with migrants during our fieldwork, we know that remittances may be seen as part of a partial insurance arrangement between the migrants and their families, as sketched above.2 Because
of high fixed transaction costs in sending funds or goods, one does not observe frequently the small transfers that are involved in the usual neo-classical theory of insurance, which views the latter as geared towards smoothing consumption finely. Here, we observe a coarser mechanism, aimed at avoiding the damage resulting from a fall in consumption below a given level.3 This threshold,
which triggers the transfer, varies across households, according to their social status. It is much higher for families belonging to the upper social strata than for artisans or small farmers. Indeed, in the highly hierarchical Soninke society, the loss of prestige that would affect a family forced to lower significantly its standards of living in times of hardship would be considerable, and much higher for noble families than for families belonging to the lower social strata. This risk has two opposing effects on the production effort of the village family. On the one hand, the family could step up its effort, in order to self-insure against the shame and hardship that a consumption shortfall would entail. On the other hand, the promised support by the migrants mitigates the expected damage, and reduces the incentive to work hard. Let us start by analyzing the latter effect.
2 Gubert (2002) provides empirical evidence consistent with this theoretical approach to migration and remittances. She finds that
negative agricultural shocks substantially raise transfers of funds in the form of cash and in kind remittances. Her findings also suggest that remittances are responsive to unforeseen bad events such as funerals or illness.
3.1. The Incentive to Shirk
Let γ denote the family’s consumption norm. Each family is assumed to have an entitlement over an
amount of remittances γ - y whenever its income falls below γ. This assumes that the migrant can observe the level of output, may be indirectly through trusted witnesses. But he cannot base its promised transfer on the effort level made for producing it, either because it is not observed, or at least not verifiable. Hence, migrants cannot use credible threats for punishing moral hazard, of the type discussed by Fafchamps (1992). Moreover, households remaining in the village do use tricks for blurring the signals that the migrant could receive about their effort. For example, a comparison of family output with that of others could serve as an indicator of effort, according to the mechanism of yardstick competition, well known in industrial or labor economics (Shleifer, 1985, Lazear and Rosen, 1981). Unfortunately, this signal can be manipulated, if the agricultural households collude in order to send false signals to the migrants. Acts of collusion, such as the announcement of fictitious natural disasters, were actually observed in the Kayes area. Peer pressure could also make family output an unreliable signal, for “zealous” families (i.e. those which do not take advantage of their informational rent) could well be constrained by others to reduce their effort. Thus, this mechanism may induce the household to shirk and to rely on the migrant for its subsistence.
According to Fafchamps (1992), ex-ante financial support is another way to mitigate opportunistic behavior. In the case of the Kayes area, survey data suggest that even if the bulk of remittances occurs after the crop has been harvested, some liquid assets are supplied by the migrants before the start of the agricultural season, so that their families may have access to key factors of production. Nevertheless, this does not prevent shirking.
The discussion so far has not taken into account the presence of another informational asymmetry which is beneficial to the migrant. Indeed, the migrant freely decides whether he sends funds or not. If he decides not to, his family cannot ascertain whether this decision is due to temporary money problems or to his intentional default on the contract. Various factors, among which moral commitment or the migrants’ concern about other persons’ opinions of themselves, induce most migrants not to take advantage of this informational asymmetry.4 We do not model this in our
partial-equilibrium analysis. Yet, the possible occurrence of money problems affecting the migrant is introduced in the model since it alters the reliability of the insurance mechanism. We assume that there are escape clauses allowing the migrant to default licitly on its commitment, like illness or a spell of unemployment.
Let λ denote the probability that the family be financially supported by the migrant when a shock occurs. In other words, it represents the reliability of the insurance mechanism. In the empirical analysis that follows, λ is assumed to be positively correlated with the ratio of the number of family out-migrants to the number of family members residing in the country of origin. But in our theoretical model, λ is considered as exogenous. Under this assumption, expected consumption conditional on y is given by:
{
,0}
max y y y Ec = +λ γ− . (2)4 Additional support for this assumption comes from our survey data. Of those who had migrated to France for more than six months at
the time of interviews, 86.8% had remitted money or goods in the previous twelve months. During this period, cash and in kind remittances sent per migrant amounted to 400,465 CFA F, worth about US $ 600.
In this model, the incentive to shirk comes from the impact of effort on the expected value of the transfer entitlement so defined, denoted H( eγ, ). This is captured in the following proposition. PROPOSITION 1:
(i) The expected consumption level can be written as a function of effort as follows:
) , ( e H e E e Ec = α +λ γ . (3)
(ii) It is an increasing and convex function of e.
PROOF: Let us start with the case wheree≥γ /α . This entails that the production effort is high enough for the probability of output reaching the consumption norm not to be zero. Then it is easily checked that the following relation holds:
∫
∫
+ − + = α γ γ α α α α α α λ γ γ λ e e d f e d f e e F e Ec / / 0 ( ) ( ) ) 1 ( ) / ( . (4)In order to express this in a more convenient fashion, let us first define the index of productivity below the consumption norm as follows:
∫
= e f d e / 0 ( ) ) / ( ~ γ α α α γ α . (5)It is a measure of the set of possible values of α such that output falls below the consumption norm. It can be interpreted in an ambivalent way. On the one hand, it is proportional to the expected productivity of labor in case of bad luck. As such, the higher it is, the better. However, it is not exogenous, and is affected by the choice of effort. Hence, it can more fruitfully be interpreted as an index of exposure to productivity risk. The largerα~(γ/e), the more chances is the family taking to be exposed to a consumption shortfall. It is clearly a decreasing function of the level of effort e. In other words, the village family can reduce its exposure to productivity risk by increasing its production effort. Its maximum value isα~(γ/e)=Eα ; in this case the family is bound to face a production shortfall below the consumption norm.
Then, the expected value of the transfer entitlement may be written as:
) / ( ~ ) / ( ) , ( e F e e e H γ =γ γ − α γ . (6)
It is the difference between the expected value of getting the consumption norm to which the family is entitled and the expected output in case of bad luck. Notice that (minus) the productivity risk index measures the marginal impact of effort on the expected value of the transfer entitlement, as the other terms in the derivative of H(.) with respect to e cancel out. Hence, the larger the exposure to risk chosen by the village family, the more counter-productive is the marginal production effort in terms of transfer entitlement.
The first and second derivatives of (3) can now be calculated as:
0 ) / ( ~ ≥ − = ∂ ∂ e E e e Ec α λα γ , (7)
and: 0 3 2 2 2 > = ∂ ∂ e f e e e Ec λγ γ . (8)
In order to complete the proof, we must now deal with the case where e<γ /α . Then, the effort level is too low, so that output falls below the consumption norm with probability 1. In this case, (3) still holds, with H(γ,e)=γ −Eαe, asF(γ/e)=1 and α~(γ/e)=Eα. Expected consumption is then a simple linear function of effort:
γ λ α λ + − = E e e Ec (1 ) . (9) This completes the proof of proposition 1.
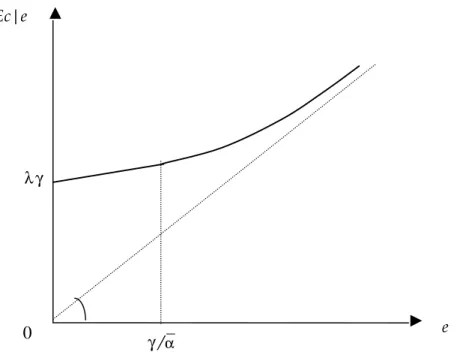
COMMENT: The convexity of the relationship between expected consumption and effort creates a disincentive to effort, as the return to the latter becomes lower, the lower the effort level. Figure 1 illustrates this effect. Proposition 1 makes it clear that this results from the partial insurance mechanism entailed by the transfer entitlement expected from the migrant.
Figure 1: Expected Consumption as a Function of Effort
3.2. The Combined Impact on Utility
Let us now turn our attention to the second effect of the risk of a consumption shortfall, which mitigates the disincentive effect identified above. We want to capture the fact that it would be a shame for all the members of the family if the living standards of those remaining in the village was visibly affected by a negative shock. This may be interpreted as the impact of a substantial loss in social status imposed on the family whenever its consumption falls below γ . This can be taken into account by assuming that a consumption shortfall below the norm has an additional negative
γ λ α E 0 γ /α e Ec|e
impact, beyond the mere cut in consumption. A simple way to capture this is to assume that the utility derived by the village family from consumption c is:
{
,0}
max c
c
u= −β γ − . (10)
The positive parameter β captures the additional negative effect resulting from a decrease in consumption belowγ . This specification entails that there is a kink in the utility function, at the level of the family’s consumption norm.
Define now the risk-adjusted reliability of the migration-based insurance system analyzed here as:
β λ λ
λ~= −(1− ) . (11)
This parameter captures the combined effect of the two opposing effects identified above. It is increasing inλ, and it is positive if:
β β λ + > 1 . (12)
The λ~ parameter so defined allows to determine conveniently the relationship between expected utility and effort as in the following proposition.
PROPOSITION 2:
(i) The expected utility achieved by the household can be written as a function of effort as follows:
) , ( ~H e e E e Eu = α +λ γ . (13) (ii) It is an increasing function of e, and it is convex if
β β λ + ≥ 1 .
PROOF: If e≥γ /α , the relationship between expected utility and effort can be written as:
∫
∫
+ − + − + = α γ γ α α α α α γ β α β λ γ γ λ e e d f e d f e e F e Eu / / 0 [(1 ) ] ( ) ( ) ) 1 ( ) / ( . (14)One can then derive (13) by using definition (11), and re-arranging the terms. The steps are similar to the ones followed for proving proposition 1.
The first and second derivatives of this function can be calculated as:
0 ) / ( ~ ~ > − = ∂ ∂ e E e e Eu α λα γ , (15) and: 0 ~ if , 0 ~ 3 2 2 2 > > = ∂ ∂ λ γ γ λ e f e e e Eu . (16)
The case where e<γ /α can be analyzed in a straightforward way, as in the proof of proposition 1. This completes the proof of proposition 2.
3.3. Determination of the Effort Level
Now assume that the family is a unitary household seeking to maximize:
2 2 maxEue e e ω − , (17)
where ωe is the marginal disutility of effort, which is increasing in e.
Because of the kink in the utility function at c=γ , this specification is not exactly quasi-linear. Nevertheless, apart from this point, it relies more on the substitution effect than on the income effect which could actually affect the level of effort chosen by the family. However, giving more importance to the income effect would not affect significantly the predictions of this model, provided that consumption and leisure are normal goods.
Solving (17) shows that effort is a decreasing function of the risk-adjusted reliability of the transfer entitlement system. This is stated in the following proposition.
PROPOSITION 3:
(i) If e≥γ /α , the effort level is given by:
ω γ α λ α ~~( / *) * E e e = − ; (18) (ii) if e<γ /α , the effort level is given by (18) after substituting α~(γ/e*)=Eα .
PROOF: Equation (18) is easily derived, using (15), from the first-order condition of problem (17):
e e e u E =ω ∂ ∂ . (19)
REMARK: Notice that e* is a fixed point of equation (18). There might thus be multiple equilibria, as both the left-hand side and the right-hand side of (18) are increasing in e. It is easily checked that the following conditions are sufficient for ensuring uniqueness:
) ( 3 ) (' and , ) ( 3 α α γ γ ω α α f < f >− ef . (20)
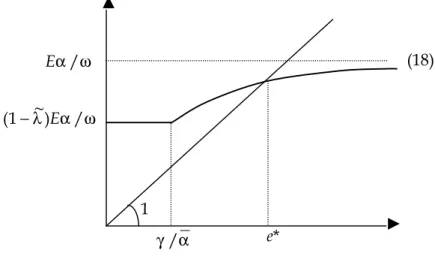
These are technical conditions ensuring that the kink in the effort-supply function at e=γ /α is not “too sharp”. They are easily satisfied, for example if F(α) is uniform. Figure 2 depicts the determination of e* in a simple case, assumingλ~>0.
Figure 2: Determination of the Effort Level
One can easily imagine from figure 2 what a case of multiple equilibria would be like. We do not pursue this idea here. In the case depicted, there is a unique equilibrium effort level, and it is a decreasing function of λ~, the risk-adjusted reliability of the transfer entitlement system. Notice that the same property would follow, were the equilibrium point located on the horizontal segment of the effort function. This is the main property on which the empirical part focuses. It carries over from the effort supply function (18) to the expected output function, as follows:
ω α γ α λ α ~~( / *)) / ( * E e E Ey = − , (21) in the case where e* is above the kink, and:
ω α λ~) / 1 ( * E 2 Ey = − , (22) otherwise.
It is easily checked that Ey* is a decreasing function of the reliability of the transfer entitlement system λ~, taking due account of the fact that the index of productivity below the consumption target α~ is increasing in λ~. Hence, the property found in the effort function also holds for the expected output function.
To sum up, the main prediction of the model is the following: the more reliable is the insurance mechanism, after adjusting for risk, the higher is the incentive to shirk, and the lower is the expected output. The remainder of the paper is devoted to substantiating this hypothesis through the estimation of a production function with household-specific effects.
4. DATA AND SUMMARY STATISTICS
The data set comes from a survey conducted by one of the authors in eight villages located in the Kayes area, along the Senegal River, between January and April 1997.5 Two main ethnic groups are
5 i.e. Djimekon, Fanguine Koto, MoussaWaguya, Kerouane, Dyalla Khasso, Somankidi, Diakandape and Gakoura.
α γ / e* ω α λ~) / 1 ( − E ω α / E 1 (18) e* e*
living there, generally in separate villages: the Soninke and the Khassonke. In order to have roughly an equal number of households from each group, the villages have been separately drawn at random by ethnic affiliation, within about 50 kilometers from Kayes, both upstream and downstream along the Senegal river. Because Khassonke villages are generally smaller in size, a sample of three Soninke villages and five Khassonke villages was drawn. In the former, households were drawn at random, while the whole population was included in the sample for the latter. The resulting sample has 305 rural households. Following Meillassoux (1975), a household was defined as “a group of individuals who produce in common on at least one field, receive food out of a common store and eat from a single pot”. It corresponds to what we call “family” in our theoretical model above. In the Sahelian area, it is typically comprised of the family head, his wives, his young brothers, and their dependents over two or three generations.
4.1. Household Characteristics
A migrant household is defined by the following characteristics: at least one person who was previously a member of the household has left for more than six months to live or work elsewhere, either in Mali or abroad. Women who out-migrated for marriage and children below 18 years of age at the time of interviews were excluded.6 Of the 305 rural households in the survey, 224 sent at least
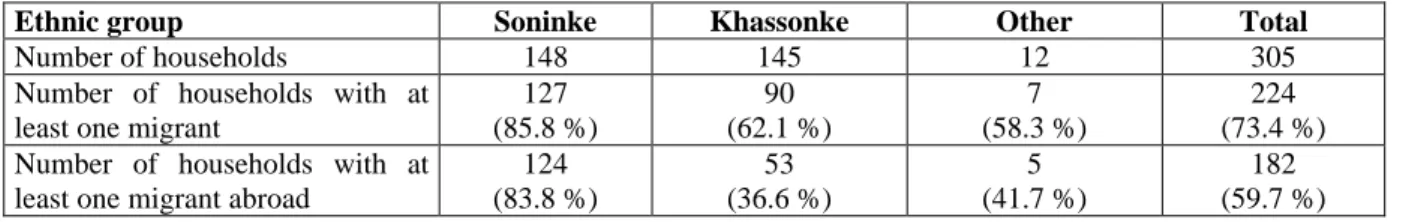
one household member in the migrant labor force (73.4%) and 182 sent at least one household member abroad (59.7%). Their distribution by ethnic group is given in table 1. It shows that the incidence of migration is more frequent among Soninke households, and especially so for migration abroad.
Table 1. Distribution of sample households by migration status and ethnic group
Ethnic group Soninke Khassonke Other Total
Number of households 148 145 12 305
Number of households with at least one migrant
127 (85.8 %) 90 (62.1 %) 7 (58.3 %) 224 (73.4 %) Number of households with at
least one migrant abroad
124 (83.8 %) 53 (36.6 %) 5 (41.7 %) 182 (59.7 %) Source: Gubert, 2000.
Migrant households reported on average 2.6 migrants, with a minimum of 1 and a maximum of 11. Table 2 reports the average amount of remittances received per household according to the number of out-migrants. The figures include both cash and in kind remittances and concern the year 1996.7
The amounts at stake are considerable: using the World Bank's poverty line of $1 a day (or, equivalently of CFA F 700 a day), remittances received per household represents on average no less than the annual income required for keeping three individuals just above the poverty line.
6 Women provide only minimal assistance to their parents once they are married. Hoddinott (1994) reports a similar result using survey
data from Kenya.
7 Migrants residing in France often send goods instead of money. More precisely, families receive order forms that can be traded for
goods with local suppliers. Suppliers are then directly paid by the migrants. This is probably aimed more at involving witnesses in the transfer process than at influencing the consumption pattern of the village household, because of fungibility.
Table 2. Amount of Remittances Received per Household in 1996 Number of Migrants Within the Household (*) Mean Amount of Remittances Received Number of Households Number of Migrants in France within the
Household Mean Amount of Remittances Received (**) Number of Households 0 100,856 81 0 48,188 167 1 479,802 72 1 1,040,057 65 2 1,004,857 70 2 1,656,593 39 3 1,143,994 28 3 1,995,484 15 4 1,415,631 18 4 2,546,413 8 5 1,562,826 14 5 2,598,363 6 6 2,401,997 16 > 5 3,918,465 5 > 6 2,182,542 6 - - -All 799,918 305 All 740,145 305 Source: Gubert, 2000.
(*): Male adults aged 18 or more, who have left their village for more than six months. (**): Remittances from France only.
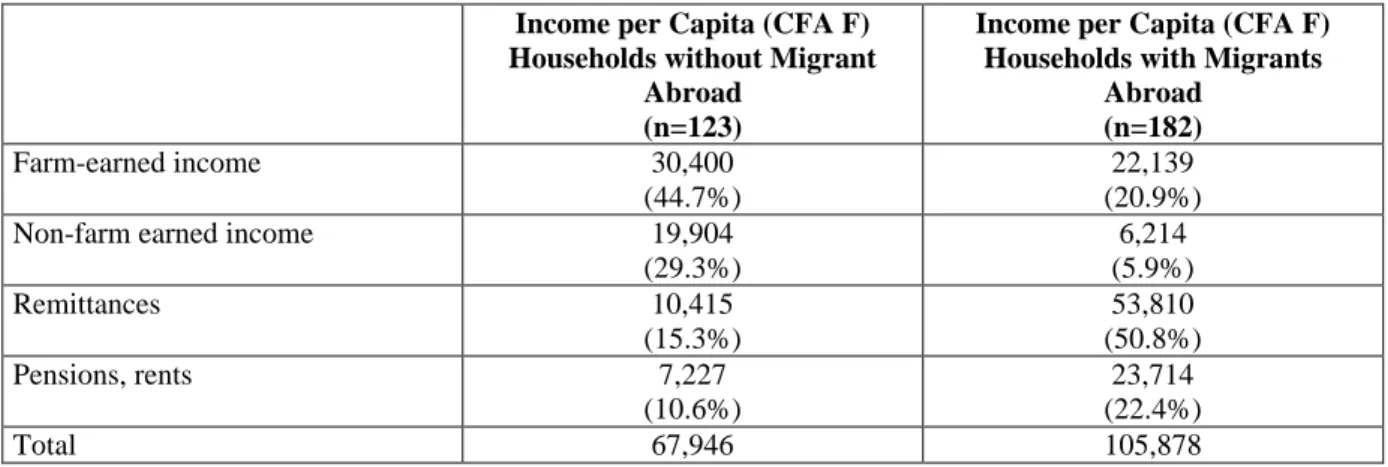
As a result, remittances play a critical part in the economies of the sample households, as shown by table 3. In 1996, they accounted for 40.1% of total gross income in value terms for all the 305 households, and 50.8% of total gross income for all the 182 households with at least one member abroad. For households not involved in international migration, farm revenues, measured as the sum of the value of all crops and animal products either marketed or home-consumed during the year, are by far the most important source of income. Another striking feature emerges from the figures, which provides some support to the prediction of our model. Farm- and non-farm earned incomes per capita in households with international migrants are much lower on average than those of non-migrant households. Such a result might reflect the disincentive effect of remittances on the productive behavior of agricultural households. Some stronger evidence is provided below.
Tableau 3. Sources of Income in 1996
Income per Capita (CFA F) Households without Migrant
Abroad (n=123)
Income per Capita (CFA F) Households with Migrants
Abroad (n=182) Farm-earned income 30,400 (44.7%) 22,139 (20.9%)
Non-farm earned income 19,904
(29.3%) 6,214 (5.9%) Remittances 10,415 (15.3%) 53,810 (50.8%) Pensions, rents 7,227 (10.6%) 23,714 (22.4%) Total 67,946 105,878 Source: Gubert, 2000. 4.2. Farming Performance
The lower income earned from farming by migrant households is not due to obvious differences in cultivation practices, like crop choice or use of farming equipment. The survey was specifically designed to assess the impact of migration and remittances on agriculture, and it provides some rich and reliable information on each household’s cultivated plots of land. The data include location of
plots, types of crop, production levels, amounts of male and female labor inputs and amounts of other inputs such as hired labor, fertilizer and equipment. Data on the level of outputs were first collected using local units of measure (muud) and then converted to kilograms. Information on farm operations, inputs and outputs on each of the households’ plots concerns the 1996 wet season.
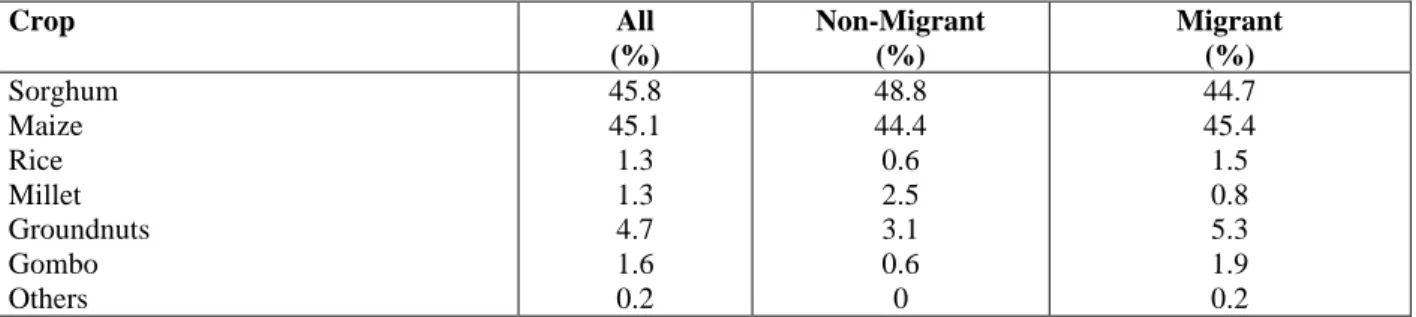
Table 4. Distribution of Common Plots by Primary Crop and Migration Status in 1996
Crop All (%) Non-Migrant (%) Migrant (%) Sorghum Maize Rice Millet Groundnuts Gombo Others 45.8 45.1 1.3 1.3 4.7 1.6 0.2 48.8 44.4 0.6 2.5 3.1 0.6 0 44.7 45.4 1.5 0.8 5.3 1.9 0.2 Source: Gubert, 2000.
The farming system is typical of rain-fed agriculture in Sahelian Africa. Active members of a household work on common plots, the output from which is used for fulfilling the basic consumption needs of the household. Each household owns on average two such common plots. In addition, each woman of the household cultivates one or more individual plot and has an entire control over the output from her field(s). On average, each woman controls two individual plots8.
Crop choice is different by gender: plots controlled by men are generally devoted to cereals (sorghum and maize) while plots controlled by women are mainly devoted to groundnuts. Migrant and non-migrant households show similar patterns in crop choices with all farms cultivating sorghum, maize and groundnuts, as shown by table 4. Agricultural production is mainly assigned to family consumption: sales of crops are infrequent and account for a negligible fraction of total income. Despite increased population pressure, land remains abundant and extensively farmed in all eight villages.
Tables 5 and 6 provide information concerning farm tools, labor force and crop output among the sample households, by migration status. Two farming units were dropped from the sample because they did not actually cultivate any fields during the 1996 wet season. A significant difference comes out from comparing the two sub-samples regarding their equipment. The figures shown in the top part of table 5 suggest that the adoption of modern agricultural tools such as ox plow or cart is strongly and positively correlated with out-migration. Moreover, discussions with farmers during our fieldwork revealed that the acquisition of productive agricultural assets always followed migration, suggesting that migration contributes to relax the credit constraint through remittances.
8 The data reveal no statistically significant difference in the number of common plots per household and in the number of individual
Table 5. Farm Tools and Cultivation Labor, by Migration Status All (n=303) Non-Migrant (n=81) Migrant (n=222) z (*) P>|z| Farm Tools
% of households owning ox plow % owning donkey plow
% owning cart % owning seeder % of plots with plow
19% 50% 45% 13% 77% 15% 30% 25% 9% 70% 20% 58% 53% 15% 80% -1.07 -4.46 -4.46 -1.42 -2.49 0.28 0.00 0.00 0.16 0.01 Cultivation Family Labor
Adult male labor Adult female labor Child labor 4.0 5.5 1.0 3.0 3.4 0.7 4.4 6.3 1.1 -4.24 -6.21 -1.97 0.00 0.00 0.05 Source: Gubert, 2000.
(*): Mean comparison test.
Table 6. Value of Aggregated Crop Output, by Migration Status (1,000 CFA F)
Crop Output All
(n=303) Non Migrant (n=81) Migrant (n=222) t P>|t| 1995 crop output 435.8 303.9 484.0 -4.15 0.00 1996 crop output 365.7 311.3 385.6 -1.85 0.07
1995 crop output per cultivator 45.2 46.3 44.9 0.37 0.71
1996 crop output per cultivator 42.9 54.4 38.07 3.28 0.00
Source: Gubert, 2000.
Note: For the computation of the number of cultivators, family members from 14 to 65 years of age were counted as one irrespective of gender, elders over 65 and children below 14 as one half.
The lower part of table 5 shows that these migrant households have also a higher labor endowment than the non-migrant ones. However, this evident richer endowment in agricultural productive assets does not translate into higher output. In fact, we have already seen exactly the opposite emerging from table 3, with farm income per capita being lower by about a third than that of non migrant households. The data suggest that this is due to lower productivity. Table 6 shows that despite a better endowment in physical assets, migrant households do not achieve significantly higher yields in terms of the value of output per working household member than non migrant households. 9 Although yields do not differ appreciably across the two groups in 1995, they do
significantly differ in 1996, with higher yields on non-migrant farms. Therefore, although the evidence presented so far only allows for an impressionistic assessment, it does not contradict the view that migrant households are exerting less effort in production. However, a more thorough econometric analysis is required to confirm this impression. The empirical analysis presented in the next section aims at bringing out more rigorously the technical inefficiency of the migrant households, while controlling for many other potential sources of lower performances.
9
5. EMPIRICAL ANALYSIS
Our first objective in this section is to construct a relevant indicator of each household's unobserved technical efficiency with which to test the hypothesis formulated above. We follow Udry (1996) and estimate a plot-level production function using a panel estimation technique with household-specific fixed effects. We are able to do so because each household in our sample simultaneously cultivates several plots. On average, we have eight plots per household in 1996. The two dimensions of the panel are therefore plots and households. After eliminating observations with missing data, the sample consists of 291 farm households with usable data on a total of 2,248 cultivated plots. We then use the measure of unobservable household-specific fixed effects, which is a measure of their technical efficiency, to explicitly test the main prediction of our theoretical model.
5.1. Estimation of Households’ Productive Efficiency
Let the production technology on each plot be described by the function:
ε µh ih i ih ih ih f X W G Y =ln ( , , )+ + ln . (23)
where i indexes plots of land and h indexes households (i = 1,…,P, h = 1,…,H); Xih is a vector of
physical inputs used on plot i; Wi is a vector of observable plot characteristics; Gih is a vector of
characteristics of the individual who controls the plot; µh is a measure of unobservable household characteristics, and εih is a disturbance term that summarizes the effects of unobserved plot quality variables and plot-specific production shocks. The error-component µh may be treated either as a fixed effect or as a random effect (Greene, 1997). The fixed effects approach takes µh to be a household constant term in the regression model. The appropriate estimator in that case is the “within-groups” or “fixed effects” estimator. By contrast, the random effects approach specifies that
h
µ is a household-specific random disturbance. The model may then be estimated by generalized least squares, which can yield unbiased and consistent coefficient estimates. Although it is possible to argue in favor of one or the other model, the main problem with the random effects approach is that unobserved heterogeneity, embodied in the error componentµh, might be correlated with observed inputs. When such a correlation is present, least squares and generalized least squares yield biased and inconsistent estimates of the parameters. The traditional technique to overcome this problem is to use a fixed effects procedure, i.e. to purge the household-specific effect µh by transforming the data into deviations from household means (Hausman and Taylor, 1981). In that case, a sufficient condition for the OLS estimates based on the transformed variables to be unbiased and consistent is that the elements of X and W be uncorrelated with the regular disturbance term εih. The classic test for orthogonality of the random effects with the regressors has been proposed by Hausman (1978). It is based on the idea that under the hypothesis of no correlation, the fixed and random effects estimates should not differ systematically. In our case, use of a random effects approach was statistically rejected in favor of a fixed effects approach (Chi248=592.3). Still, two potential limitations may remain when using the fixed effects approach. First, transforming the data into deviations from household means sweeps out all plot-invariant variables from the regression. Since our model does not include such variables, however, the estimation procedure based on within-groups estimators seems to be relevant. Second, inputs may be correlated with the disturbance term εih. An instrumental variable procedure based on exogenously determined plot-level instruments could overcome this problem. These are not available in our data set.
The last important issue to be addressed involves the specification of the functional form for )
, , (Xih Wi Gih
f . Cases of zero-values of some input variables in our data set prevent the Cobb-Douglas specification from being directly applicable. One option to solve this problem is to confine the analysis only to those farmers who have positive values of the key inputs. However, this method is not satisfactory, since it may result in seriously biased estimators. Another option is offered by Battese (1997), who shows that the “zero-observation” problem in the estimation of Cobb-Douglas production function may be solved by the use of dummy variables such that efficient estimators are obtained using the full data set. The functional form that is used is thus given by:
(
)
[
ih]
w i g ih h ih x ih D X D W G Y =δ +δ lnmax , +δ ln +δ ln +µ +ε ln (24) where D = 1 if Xih = 0 and D = 0 if Xih > 0.The following variables are included in the regression:
Physical inputs (Xih): number of male cultivators aged 65, number of female cultivators aged
14-65, hired labor costs (including seasonal workers' wages), use of fertilizer (dummy variable with value 1 if fertilizer was used on the plot, 0 otherwise), use of equipment (dummies); number of plowing tools;
Observable plot characteristics (Wi): type of crop (dummies), location of plot (distance from
village), type of plot (dummy variable with value 1 if common and 0 if individual), type of crop interacted with type of plot, type of crop interacted with village dummies (which capture climatic and environmental effects). Due to unreliable data, we do not have any precise information on plot size. This does not seem to be a clear concept in our sample farmers’ minds. However, in a context of extensive farming, they don’t need it, as there is a very strong correlation between labor input and plot size. Therefore, labor input combined with agricultural tools may be used as a proxy for the size of a plot.
Observable characteristic of the individual who controls the plot (Gih): age (gender is not included
here since it is strongly correlated with the type of the plot).
Summary statistics for these variables are presented in Table A.1. (see Appendix).
The results of estimating equation (24) are reported in table A.2. (see Appendix). Only the coefficients on physical inputs, location of plot, type of plot and type of plot × type of crop are reported, but village indicators interacted with type of crop were also included in the regression.10
Even if the analysis of technical efficiency is concerned primarily with the error terms rather than the parameter estimates, some results command attention. First, all input coefficients have positive and highly significant coefficients. The estimated coefficient for the dummy variable for no plow use is significantly negative implying that the intercept of the production function is lower for farmers who do not use plowing implements. Conversely, the estimated coefficient for the dummy variable for no use of hired labor is significantly positive implying that the intercept of the production function is higher for farmers who do not hire labor from outside the household. The reason for this result may be as follows. Binswanger and Rosenzweig (1986) have shown that whenever a worker is not the sole residual claimant of farm profits there is an incentive problem relative to work effort. This implies that hired labor is more costly than family labor because it either requires some supervisory inputs by family members or it leads to less effort in the absence
10 Interaction effects were also included to test the hypothesis of an identical technology across plots controlled by migrant and
of supervision. Second, the distance of the plots from the village is positively related to production levels up to a certain point (around 6.5 kilometers). More distant plots, however, are associated with lower production levels. Such a pattern may be due to high fixed travel costs for working on distant plots. Lastly, common plots, generally controlled by household heads, have significantly higher output than individual plots controlled by women. This result may be due to systematic differences in the size or quality of land farmed by men and women or to differences in labor intensity as women often combine cultivation activities with child care (Udry, 1996).
5.2. The Determinants of Households’ Efficiency
Now that equation (23) has been estimated, the hypothesis that we want to test is whether the reliability of the migration-based insurance mechanism, denoted byλ in our theoretical model, is negatively correlated with our measure of unobservable household-specific productivity level, measured byµh. We thus regress the household-specific fixed effects derived from equation (23) on a vector of observable household characteristics including our proxy forλ. By doing so, we assume that the household’s decision to reduce its level of effort affects all plots equally. Household characteristics include the size of the household, the percentage of educated members within the household, a dummy variable indicating whether the household earned any off-farm wages or rents during 1996, dummy variables related to the household's social status11, the number of common
plots divided by the total number of cultivated plots among the household, and the adjusted number of out-migrants divided by the number of residents members in the household. In order to get a dependable indicator of the reliability of the insurance mechanism, each migrant was first weighted by his estimated propensity to remit (see appendix A.1 for details). A dummy variable indicating whether the main ethnic group of the village is Khassonke is also included. The results from estimation by OLS are presented in Table 7. Estimates indicate that the null hypothesis of moral hazard, corresponding to a statistically negative coefficient associated with our measure of insurance reliability, is strongly supported by the data. The implicit insurance contractual arrangement between the migrants and their family could thus partly explain the poor performance of agriculture among migrant households.
This result is represented in Figure 3, which plots the distribution of the households’ predicted technical efficiencies. The latter is computed from the estimated fixed effects using the following formula (Schmidt and Sickles, 1984):
) ˆ ˆ exp( EFFIh= µh−µ , (25) where µˆ maxµˆ h h = with 0≤EFFI≤1.
11 As might be expected, the survey that we carried out included no direct question on social status. However, households’ last name is
a very reliable indicator of social status. Consider, for instance, the Diabira and Sarambounou families in the village of Gakoura, the Konaté family in the village of Fanguiné, the Sissoko family in both the villages of Moussawaguia and Djimékon and the Kouma family in the village of Kérouané, all belong to the upper social strata (i.e. all have a long period of residence in the village or can trace their
Table 7. Determinants of technical efficiency
Dependent variable: Predicted household-specific fixed effects (µˆh)
Variables Coef. t P>|t|
Intercept - 0.21 - 1.12 0.27
Household observable characteristics
Sum of weighted out-migrants/household size - 1.19 - 2.12 0.03 **
% of educated members in the household - 0.02 - 0.10 0.92
Household size - 0.001 - 0.26 0.79
Number of common plots
/total number of cultivated plots - 0.93 - 3.26 0.00 ***
Social status (dummies)
Noble 0.14 1.59 0.11
Artisan caste 0.03 0.19 0.85
Off-farm work (dummy) - 0.10 - 1.27 0.20
Village observable characteristic
Main ethnic group (dummy: 1 if Khassonke) 1.10 12.54 0.00 ***
Number of observations 291
F(8, 282) 27.73
Prob>F 0.00
Adjusted R² 0.44
Note: t-ratios and test statistics are based on heteroscedastic-consistent estimates of the variance-covariance matrix. The omitted social category is “all others” (former slaves, shepherds).
Figure 3. Distribution of technical efficiency
Households’ technical efficiency levels are influenced by other variables. The negative sign associated with the proportion of collectively cultivated plots may reflect an incentive problem insofar as each cultivating member is not the sole residual claimant on profits on those fields. It may
0 0,1 0,2 0,3 0,4 0,5 0,6 0,7 < 10% [ 10%;20%] [20%;30%] [30%;40%] [ 40%;50%] [50%;60%] > 60% Technical efficiency Relative frequency
Nonmig rant household s M ig rant households
also capture an organizational effect, as the work on common plots is performed under the authority of the elders, while the work on individual plots allows more personal initiative. More appropriate decisions might be taken in the second case, while some more rigid behavior might be required in the former one, for comforting the elders’ authority. Second, households’ efficiency levels are significantly higher in Khassonke villages. The explanation may be as follows: the involvement of Khassonke villages in migration is more recent and far less intense than in neighboring villages. Acts of collusion between households and peer pressure are thus less likely to emerge, and a comparison of family output with that of others may provide the migrants with an efficient mechanism for monitoring productivity. Lastly, it is worth mentioning that the dummy variables related to social status are not significant. This result suggests that all the variables included in the first regression to control for land quality actually did their job. Indeed, noble families are usually entitled to plots of higher fertility, mostly by the riverside.
6. ROBUSTNESS CHECKS
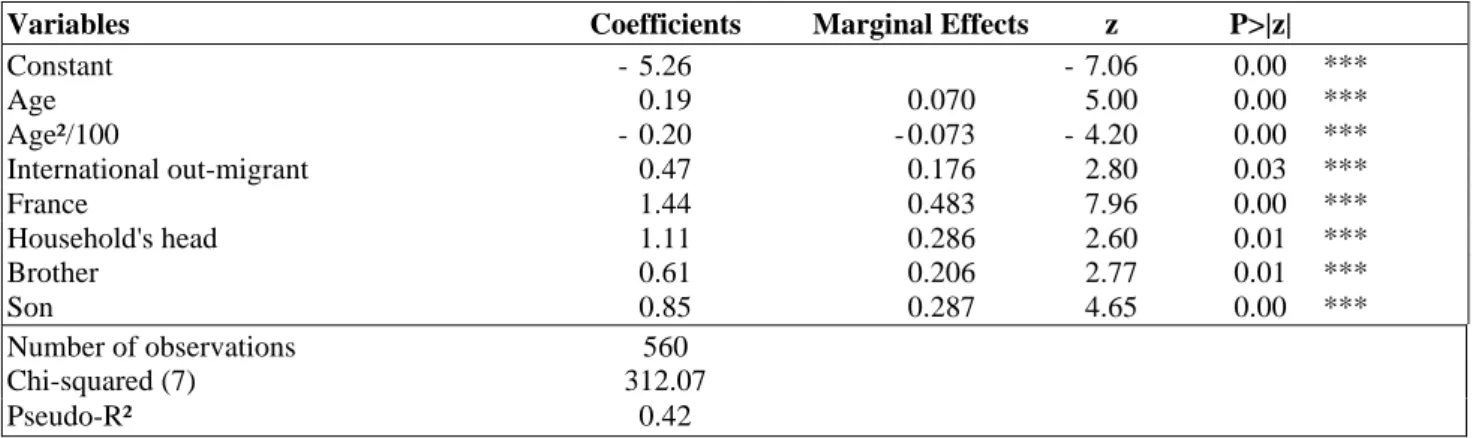
The empirical analysis raises a number of econometric concerns. The most important one regards our proxy for λ, namely the ratio of the weighted sum of migrants to household size. First, does it properly measure the effect of the reliability of the insurance mechanism on technical efficiency? Following Greene (1997, p.981), the answer is no if the typical household who chooses to purchase insurance through migration was relatively less efficient to start with, whether or not it had a migrant.12 The problem here is one of self-selection. If this argument is proved correct, then it
implies that the least squares coefficient in the regression of µh on λ actually overestimates the insurance effect. What we have to do, thus, is to separate moral hazard effects from potential selection effects in the second regression. For this purpose, we adopt the approach used in Horowitz and Lichtenberg (1993). We construct a model based on a dichotomous selection mechanism known as a “treatment effects model” in the empirical literature.13 The estimation techniques are as follows
(Heckman, 1979): we first model insurance decisions, i.e. migration participation, as a dichotomous choice. The model is estimated as a Probit equation using maximum likelihood methods. The estimated coefficients are then used to compute the selection variable which is included, in a second stage, in the efficiency model (see appendix for details). A test for selectivity bias is a test for a correlation between the errors of the Probit and the corrected OLS regression being not significantly different from zero. The results are presented in Table A.3. Since there does not appear to be any significant correlation between the error terms, the selection variable and, consequently, household self-selection do not play much of a role in our analysis.
Second, it might be argued that since λ is likely to be strongly correlated with household relative wealth, the observed inverse relationship between λ and µ may simply result from a higher opportunity cost of labor for migrant families, assuming that consumption and leisure are normal goods. However, our survey data does not provide any support to this argument. To begin with, summary statistics reveal that the correlation coefficient between λ and income per capita (including remittances) is rather low (0.18). To be more persuasive, we also introduced an indicator of household wealth in the regression in order to control for the opportunity cost of labor. The data show that the richest families within our sample are those with retired migrants who receive a pension from France. We therefore use the amount of old age pension received in 1996 divided by the number of persons living in the household to measure household wealth. Estimates show that there is no evidence of a lower technical efficiency among wealthy families (Table A.5.). There is