Étude de la dispersion d’un gisement d’or dans les
sédiments glaciaires : Le cas d’Amaruq (Nunavut,
Canada)
Mémoire
Victor De Bronac de Vazelhes
Maîtrise interuniversitaire en sciences de la Terre - avec mémoire
Maître ès sciences (M. Sc.)
Étude de la dispersion d’un gisement d’or dans les
sédiments glaciaires : Le cas d’Amaruq (Nunavut,
Canada)
MémoireVictor de Bronac de Vazelhes
Sous la direction de :
Georges Beaudoin, directeur de recherche Isabelle McMartin, codirectrice de recherche
Résumé
La minéralisation aurifère de la propriété Amaruq (Nunavut, CA) est recouverte par divers sédiments glaciaires ayant formé des traînées de débris minéralisés sur des surfaces impor-tantes. Ce projet a pour objectif de caractériser la signature minéralogique et géochimique du gisement aurifère dans le till de surface afin de développer des méthodes de prospection pour les travaux d’exploration. 61 échantillons de till ont été récoltés le long de quatre transects pour déterminer les variations de composition dans la direction principale de l’écoulement glaciaire (NNO). Quatre profils verticaux d’ostioles, un par transect, ont été échantillonnés pour documenter la variation de la signature géochimique avec la profondeur. La signature chimique de la scheelite dans le gisement est comparée à celle retrouvée dans le till et permet de tester son utilisation comme outil de prospection glacio-sédimentaire.
Trois des quatre profils d’ostioles présentent des concentrations stables des éléments traces avec la profondeur, indiquant une bonne homogénéisation du till par les processus cryogé-niques. Les ostioles sont donc un milieu d’échantillonnage pertinent en région de pergéli-sol. Les analyses en composantes principales (ACP) de la géochimie des échantillons d’une campagne de till fournie par Mines Agnico Eagle ltée (AEM), et les données des transects, décrivent la variance de la roche encaissante mafique/ultramafique et de la minéralisation aurifére (CP1 et CP2 respectivement). Le krigeage des scores de la CP1 et CP2 indiquent des trains de dispersion vers le NNO, en aval glaciaire des zones minéralisées. Les comptages des minéraux indicateurs (MI : or et scheelite) augmentent de façon importante à environ 1.4 km en aval de la minéralisation dans le secteur est de la propriété, dans un till distal formant des formes drumlinoides. Dans le secteur ouest, recouvert d’un till proximal formant des crêtes morainiques, les comptages des MI et les scores de la CP1 augmentent directement en aval de la minéralisation. Les différences de distance de transport entre ces deux secteurs reflètent un changement de la dynamique glaciaire et démontrent l’importance du contexte local dans les travaux de prospection glaciaire.
La comparaison de la signature géochimique de la scheelite entre le gisement et et des échan-tillons de till du transect de Whale Tail, grâce à des diagrammes discriminants et spectres des terres rares, montrent d’importantes similitudes, démontrant sa potentielle utilisation en prospection glacio-sédimentaire pour des gisements de type orogéniques.
Abstract
On the Amaruq property (Nunavut, CA), the gold mineralization is covered by a patchwork of glacial sediments, including trains of mineralized debris dispersed over large surfaces. This project aims to define the deposit mineralogical and multi-elemental signatures in surface sediments to guide exploration in the area. A total of 61 samples were collected from frost boils along four NNW transects, parallel to the major ice flow direction, in order to assess the spatial variability of the deposit signature using till matrix geochemistry and indicator minerals. Four profiles in frost boils were sampled, one in each transect, in order to document trace elements depth variation. The scheelite geochemical signature from the deposit is compared to that in till from the Whale Tail transect to test its applicability in drift prospecting.
Three out of four frost boil profiles exposed constant trace elements concentrations at depth, reflecting a good till homogenization by cryoturbation. Therefore, frost boils are a suitable medium of sampling for exploration purpose in permafrost terrain. Principal component analysis (PCA) of a previous till survey by Agnico Eagle Mines ldt (AEM) and transect samples define the ultramafic/mafic host rock of the mineralization and a pathfinder element suite characteristic of lode gold deposits (PC1 and PC2, respectively). Kriging of PC1 and PC2 defines a dispersal train oriented NNW, down ice of known mineralization. In the eastern part of the property, covered mostly by a distal till forming drumlinoid ridges, indicator mineral counts (IM: gold and scheelite) increase to a maximum approximately 1.4 km down ice from the outcropping zone. Western transects, largely covered by a proximal till forming morainal ridges, show a sharp increase of counts directly down-ice of mineralization. The difference in glacial transport between these two sectors represents a local change of ice dynamic and shows the importance of understanding the local context in exploration when interpreting glacial dispersal patterns.
The comparison of the trace element signature between the deposit and the till scheelite using discriminant diagrams and REE abundance shows similarities, supporting its usefullness in drift prospecting for orogenic gold deposits
Table des matières
Résumé ii
Abstract iii
Table des matières iv
Liste des tableaux vi
Liste des figures vii
Remerciements xi Avant-propos xii Introduction 1 La prospection glacio-sédimentaire . . . 1 Problématique . . . 3 Objectifs. . . 3 Méthodologie . . . 4
Échantillonnage de sédiments glaciaires . . . 4
Échantillonnage de minéraux indicateurs dans le gisement . . . 5
Géochimie de la fraction fine du till. . . 5
Minéraux indicateurs . . . 6
Composition chimique de la scheelite . . . 7
Présentation de l’article . . . 8
Bibliographie 9 1 Dispersal of the Amaruq gold deposit signature in glacial sediments using geochemical and mineralogical data 13 1.1 Introduction. . . 13
1.2 Geological setting. . . 14
1.2.1 Regional geology . . . 14
1.2.2 Local geology and gold mineralization . . . 15
1.2.3 Surficial geology . . . 18
1.3 Methodology . . . 20
1.3.1 Field sampling . . . 20
1.3.2 Till geochemistry . . . 20
1.3.4 Scheelite chemistry . . . 23
1.3.5 Statistical methods . . . 24
1.4 Results. . . 25
1.4.1 Till geochemistry in the AEM survey. . . 25
1.4.2 Till geochemistry along the transects . . . 28
Principal component analysis . . . 28
Variations along transects . . . 30
1.4.3 Geochemical profiles in frost boils . . . 32
1.4.4 Indicator mineral counts and grain morphology . . . 38
1.4.5 Scheelite petrography and geochemistry . . . 42
Scheelite texture in gold mineralization . . . 42
Scheelite geochemistry in mineralized bedrock and till . . . 44
1.5 Discussion . . . 50
1.5.1 Deposit signature in glacial sediments . . . 50
Dispersal patterns . . . 50
Glacial transport distances and inferred local ice sheet dynamic . . . 52
1.5.2 Frost boil profiles geochemistry . . . 55
1.5.3 Scheelite as an indicator mineral for orogenic gold deposit . . . 56
Scheelite signature in the Amaruq deposit . . . 56
Assessing the provenance of till scheelite in the Whale Tail transect using trace elements . . . 58
1.6 Conclusions . . . 58
References 61 Conclusion 67 Annexes 70 A Données de terrain 71 A.1 Description des échantillons de till le long des transects, coordonnées en NAD83 UTM 14N . . . 71
A.2 Description des échantillons des profils verticaux d’ostioles . . . 81
A.3 Description des échantillons de till régionaux . . . 84
B Résultats des travaux de laboratoire 89 B.1 Géochimie de la fraction fine du till. . . 89
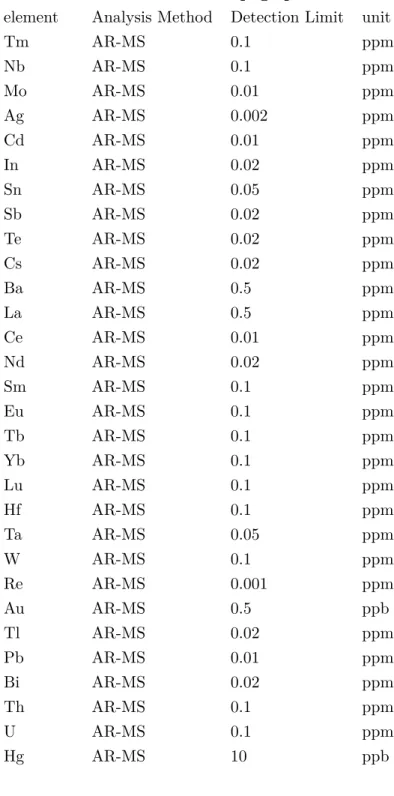
B.1.1 Limites de détection des analyses de la fraction fine du till. . . 89
B.1.2 Résultats de la géochimie par activation neutronique . . . 93
B.1.3 Résultats de l’analyse géochimique de la fraction fine du till par fusion 99 B.1.4 Résultats de l’analyse géochimique par digestion Aqua regia . . . 136
B.2 Minéraux indicateurs . . . 167
B.2.1 Comptage des grains d’or par ODM . . . 167
B.2.2 Comptage des grains de scheelite dans les concentrés de minéraux lourds et les concentrés de table. . . 172
B.2.3 Résultats des analyses par microsonde des grains de scheelite du gisement et du transect de Whale Tail . . . 174
B.2.4 Limites de détections et résultats des analyses par ablation laser des
Liste des tableaux
1.1 Variograms parameters used. . . 26
1.2 Summary statistics for elements of interest in frost boil vertical profiles. Major elements analysed by a fusion ICP-MS whereas trace elements are analysed by an Aqua regia digestion followed by an ICP MS/OES analysis. See Figure 1.12 and 1.13 for geochemical vertical variations. Abbreviations : n (number), min
(minimum), max (maximum), SD (standard deviation). . . 37
1.3 Summary statistics of gold grain size in till by shape for the Amaruq dataset
for each class of gold grains shape identified by ODM. . . 38
1.4 Summary statistics of LA-ICP-MS element analyses on deposit and till schee-lite. Concentration are given in ppm, with the exception of Ca and W, given in percent. Abbreviations : min (minimum), max (maximum), SD (standard
Liste des figures
1.1 Location of the Amaruq deposit in the eastern part of Nunavut and regional ice flow patterns. The red line shows the last position of the Keewatin Ice Divide (KID) and arrows show ice flow directions. Ice extent at 8 14C ka BP is marked by the blue dashed line from Dyke (2004). Modified after McMartin
and Henderson (2004) . . . 14
1.2 (A) Local geology of the Amaruq property. Location of sub-cropping minera-lization is highlighted in black with location of mineralized zones discussed in the text. Lakes are outlined in white with transparence ; map projection used : NAD83/UTM Zone 14N. Courtesy of Agnico Eagle Mines Limited ; (B) Sche-matic cross-section of the Whale Tail sector ; (C) Mineralized iron formation ; (D) Hydrothermal silicification with pyrrhotite and arsenopyrite ; (E) Minera-lized quartz veins croscutting a mafic/ultramafic volcanic rock. Cross-section
and core pictures modified from Côté-Mantha et al. (2017). . . 17
1.3 Simplified preliminary map of the surficial geology in the Amaruq deposit area, modified after Boulianne-Verschelden et al., 2017. The boulder unit is mainly represent by boulders of glacial origin, associated with proximal till. It also include local felsenmeer near outcrops or in distal. Scarce residual Boulders are
found near lakes and rivers. Map projection used : NAD83/UTM Zone 14N . . 19
1.4 Transect and profile sample locations for the 2016 and 2017 surveys. Subcrop-ping mineralization is highlighted in red. Map projection used : NAD83/UTM
Zone 14N . . . 21
1.5 PC1 and PC2 loading plot of log-centered and standardised 2875 Aqua regia
analyses from Agnico-Eagle Mines Ltd. till survey. . . 25
1.6 Semivariogram map used in the PC1 kriging showing a moderate NNW
aniso-tropy. . . 26
1.7 Interpolated map of PC1 scores of Aqua regia digestion analysis on the fine fraction (<63µm) of AEM till survey ; map projection used : NAD83/UTM Zone 14N. Positive PC1 values show a clear NNW trend for Mammoth East and West sectors and a NNE trend in the IVR sector, representing the mine-ralization and mafic/ultramafic geochemical signatures. Geological boundaries are shown in black lines, see Figure 1.2 for associated lithologies. Black dots represent location of transect samples. Top left arrows show ice flow directions
from the oldest (1) to the youngest (3). . . 27
1.8 Map values of the semivariogram used in the PC2 kriging showing a very weak
1.9 Interpolated map of PC2 scores of Aqua regia digestion analysis on the fine fraction (<63µm) of the AEM till survey. Positive interpolated scores are mainly located down-ice of mineralization, whereas negative scores are located up-ice and in the north easternmost part of the maps. Top left arrows show ice flow
directions from the oldest (1) to the youngest (3). . . 29
1.10 (A) PC1/PC2 loading plot on the log-centered and standardised Aqua regia dataset (B) PC1/PC2 loading plot for the log-centered and standardised fu-sion/INAA dataset, (C) PC1/PC2 Aqua regia score plot classified by transect, (D) Samples projected on the PC1/PC2 Aqua regia score plot classified by
position up- or down-ice of known mineralization.. . . 31
1.11 PC1 and PC2 scores in each transect to display elemental association variations along transects parallels to the major NNW ice-flow direction. Scores for (A)
Whale Tail, (B) Mammoth East, (C) Mammoth West. . . 33
1.12 (A) IVR and (B) Whale Tail frost boil geochemical profiles. Trace elements from Aqua regia digestion followed by an ICP-MS/OES analysis whereas major
elements were analysed by fusion ICP-MS.. . . 35
1.13 (A) Mammoth East and (B) Mammoth West frost boil geochemical profiles. Trace elements from Aqua regia digestion followed by an ICP-MS/OES analysis
whereas major elements were analysed by fusion ICP-MS. . . 36
1.14 Gold and scheelite grain counts and gold grain shape proportions for till samples along the three transects : (A) Whale Tail, (B) Mammoth East and (C)
Mam-moth West. . . 41
1.15 (A) 1- UV and natural light composite photomicrograph of a silicified chert with an amphibole, arsenopyrite, loellingite and pyrrhotite ribbon in the Whale Tail sector. Blue color highlights the scheelite short wave UV luminescence, 2-photomicrograph of anhedral scheelite grains nearby an arsenopyrite with pyr-rhotite inclusion, 3 - gold inclusion in arsenopyrite ; (B) Subhedral, fractured, scheelite grain in iron formation with biotite and epidote, nearby a quartz vein ; (C) Subhedral to euhedral scheelite grains and pyrite within a carbonate vein cutting an iron formation. Dashed line highlights vein limit ; (D) Large euhedral scheelite grain in a vein crosscutting a mafic volcanic unit ; (E) Cathodolumi-nescence microphotograph of a scheelite grain showing patchy zonation. The scheelite is found within a vein in a mafic unit. Gold grade in this interval is
6.39 ppm. . . 43
1.16 Boxplot for trace elements concentration by LA-ICP-MS. Scheelite trace ele-ments concentration in several orogenic gold deposit is from Sciuba et al. (in press). The first and last hinges represent the 25thand 75thpercentile. The
up-per whisker goes no further than the 1.5xIQR with IQR the interquartile range. The lower whisker goes no further below than the 1.5xIQR. Points represent
outliers. . . 47
1.17 Scheelite rare earth elements patterns in the Amaruq deposit and Whale Tail
1.18 Discriminant diagrams for scheelite from the Amaruq deposit and Whale Tail till transect. (A) Ternary diagram of Fe, Mg and Mn, (B) Discriminant diagram for scheelite using Sr/Mo vs Eu*, modified after Sciuba et al. (in press). Data for greisen, polymetallic veins, porphyry and porphyry related, VMS, W-Mo stockwork and other Au deposits are from Poulin et al. (2016, 2018). Data for skarn and skarn related deposits are from Song et al. (2014) ; Fu et al. (2017) ; Ren et al. (2010) ; Poulin et al. (2016, 2018). Data for W-Cu-Mo polymetal-lic are from Sun and Chen (2017). Data for orogenic gold deposit are from Ghaderi et al. (1999) ; Cave et al. (2017) ; Dostal et al. (2009) ; Hazarika et al. (2016) ; Poulin et al. (2016, 2018) ; Sciuba et al. (in press). Density contour are
calculated using data from orogenic gold deposits. . . 49
1.19 Distance parameters of transport for the PC2 Aqua regia scores, gold and schee-lite grain counts. C is the distance needed for the mineralized plume to reach the surface ; K is the distance between the first occurence of mineralized be-drock to the maximum of the variable used, i.e. the head of the dispersal train ; M is the maximum distance of the dispersal train, i.e. the tail of the disper-sal train. Doted end-lines represent a minimum distance of the M parameters, where the last samples down-ice of the mineralization is still in the dispersal
train. Parameters from Bouchard and Salonen (1990). . . 53
A.1 Location of till regional samples (black dots). Location of Amaruq
[...]
LMP Oh, hey ! Wait a minute – CDR What ?
LMP – where are the reflections ? I’ve been fooled once. There is orange soil !
CDR Well, don’t move till I see it ! LMP It’s all over ! Orange ! CDR Don’t move it until I see it. LMP I stirred it up with my feet. CDR Hey, It is ! I can see it from here ! LMP It’s orange !
CDR Wait a minute, let me put my visor up. It’s still orange ! LMP Sure it is ! Crazy ! Orange ! I’ve got to dig a trench, Houston. CDR Hey, he’s not - he’s not going out of his wits. It really is. — LMP It’s almost the same color as the LMP decal on my camera. CDR That is orange, Jack ! —
LMP It’s trench time. You can see this in your color television, I’ll bet you.
CDR How can there be orange soil on the Moon ? CDR Jack, that is really orange. It’s been oxidized. —
LMP It looks just like - an oxidized desert soil, that’s exactly right. [...]
Conversation between E.A. Cernan (CDR) and H.H Schmitt (LMP) about the discovery of orange soil on the moon,
Apollo 17 voice transcript pertaining to the geology of the landing site, N.G Baily and G.E. Ulrich, U.S. Geological Survey, Branch of Astrogeology, Flagstaff Arizona, 1975
Remerciements
Je souhaite remercier toutes les personnes qui m’ont accompagné et soutenu lors de ma maî-trise. Georges Beaudoin et Isabelle McMartin, directeur et codirectrice de recherche, ont su diriger mes travaux de recherche en me guidant lors de mes questionnements. Leur expertise et connaissance multidisciplinaire ont été un atout primordial dans ce projet et dans le cadre de ma formation scientifique en géologie.
Je remercie aussi l’ensemble de l’équipe Agnico Eagle d’Amaruq et du bureau d’exploration de Val-d’Or, pour leur soutien logistique sur le terrain sans lequel ces travaux n’auraient pu être entrepris dans une zone aussi reculée du subarctique canadien. Je remercie particulièrement Olivier Côté-Mantha et Marjorie Simard qui ont su faire le lien entre Agnico Eagle et mes travaux de recherches à l’Université Laval. J’espère que les travaux que j’ai entrepris seront utiles dans les futurs travaux de prospection glacio-sédimentaire dans le subarctique canadien. Mes travaux ont bénéficié à l’Université Laval du soutien d’Edmond Rousseau, Martin Plante, Marc Choquette et Guylaine Gaumond. Mes micro-analyses au LA-ICP-MS ont été réalisées au laboratoire LabMaTer de l’Université du Québec à Chicoutimi avec l’aide de Dany Savard et Audrey Lavoie.
Mes collègues de bureau, Marjorie Sciuba, Jean-Philippe Fleury, Antoine Godet, François Xa-vier Masson, Haiming Liu, Chao Yang, Sheida Makvandi m’ont permis d’élargir mes connais-sances lors de nos nombreuses discussions scientifiques. Je remercie particulièrement Nicolas Boulianne-Verschelden, collègue irremplaçable sur le terrain avec ses chansons des spices girls, et au laboratoire pour toute l’aide qu’il a pu m’apporter.
Je remercie aussi mon père, ma mère, mon petit frère et mes amis de Québec et d’ailleurs. Je n’oublierai pas Raphaële Piché pour son soutien sans faille et ses corrections de la langue de Shakespeare.
Avant-propos
La totalité de ce mémoire a été écrite par Victor de Bronac de Vazelhes. L’auteur a réalisé l’échantillonnage sur le terrain d’étude et la préparation des échantillons avec l’aide de Nicolas Boulianne-Verschelden. Le traitement des données et les interprétations ont été effectués par l’auteur. Un jeu de données géochimiques de sédiments de surface fourni par Mines Agnico Eagle Limitée a été utilisé dans le cadre d’une étude statistique et spatiale afin de comparer les résultats aux analyses réalisées à l’Université Laval. Les travaux de maîtrise ont été encadrés par Georges Beaudoin (Université Laval) et Isabelle McMartin (Commission géologique du Canada à Ottawa).
Introduction
L’étude présentée dans ce mémoire de maîtrise fait parti de l’étude de cas de la dispersion gla-ciaire du gisement Amaruq pour la Chaire de recherche industrielle CRSNG - Agnico Eagle en exploration minérale. Cette chaire de recherche, a pour but de développer de nouvelles méthodes d’exploration en utilisant la forme et la composition chimique des minéraux indi-cateurs. Ce projet de maîtrise a pour objectif de définir la signature de la minéralisation dans les sédiments glaciaires quaternaires tardi-Wisconsiniens à l’aide la géochimie et des miné-raux indicateurs du till afin de définir de nouveaux métallotectes pour guider l’exploration, localement et régionalement. Ce projet est associé à un autre projet de maîtrise ayant pour but de cartographier et caractériser la géologie de surface, à l’échelle locale et régionale dans le secteur d’Amaruq, réalisée par Nicolas Boulianne-Verschelden.
La prospection glacio-sédimentaire
Une partie importante du territoire canadien était recouverte par une épaisse calotte glaciaire pendant la dernière glaciation du Wisconsinien supérieur (Dyke et Prest, 1987). Les mouve-ments de cette calotte ont induit des processus d’érosion, de transport, et de sédimentation de matériaux dérivés du socle sous-jacent, produisant ainsi une couverture de dépôts glaciaires (principalement de till) d’épaisseur variable, et pouvant masquer l’observation des roches du socle et des minéralisations associées.
La prospection glacio-sédimentaire a pour but la recherche et la découverte de gîtes grâce à l’utilisation des connaissances et outils dérivés de la géologie économique et de la géologie glaciaire. La compréhension des mouvements glaciaires et du transport de blocs minéralisés appliquée à la prospection glacio-sédimentaire est décrite pour la première fois au début du 20e siècle au Canada (Prest,1915) et en Scandinavie (Sauramo,1924). Plus tard, dans les années 70 et 80, l’étude en trois dimensions de la couverture glaciaire autour de zones minéralisées a permis de proposer un modèle mono-couche de remontée du panache géochimique et clastique (Drake, 1983; Miller, 1984). Ce modèle présente une remonté à faible angle de l’anomalie clastique à partir de la source érodée dans la direction d’écoulement glaciaire, impliquant un retard à son apparition en surface par rapport à la position de la minéralisation. Les travaux postérieurs ont mis en avant les nombreux facteurs qui peuvent influencer la géométrie et l’expression des traînées de dispersion glaciaire. Ils se regroupent en quatre grandes catégories (McClenaghan et Paulen,2018) : facteurs associés à la source (érodibilité, composition, dureté, etc.), aux conditions glaciaires (température à la base du glacier, vitesse, disponibilité d’eau), aux conditions de transport/dépôt (transport sous-, en- ou supraglaciaire, till de fond ou
d’ablation), et ceux associés aux changements post-sédimentation (météorisation, processus hydromorphiques, processus cryogéniques, etc.).
L’apparition des méthodes d’analyses géochimiques pour la prospection de gîtes minéraux a permis de mettre en avant et visualiser spatialement les relations inter-élémentaires dans le socle, le sol, les alluvions (Garrett et al., 2008) et les sédiments glaciaires (Shilts,1996). Les sédiments glaciaires sont généralement interprétés comme reflétant localement ou régionale-ment la chimie et la minéralogie de la roche sous-jacente (Shilts, 1973). Plusieurs facteurs peuvent influencer la signature géochimique du till tel que : (1) la classe granulométrique terminale des différentes espèces minéralogiques en fonction des lithologies érodées et trans-portées/broyées par les processus glaciaires (Dreimanis et Vagners, 1971) ; (2) la séparation granulométrique de la signature géochimique avec un enrichissement en métal dans la fraction silteuse et/ou argileuse (DiLabio,1985;Shilts,1984;DiLabio,1995;Nikkarinen et al.,1984) ; et (3) la séparation géochimique en présence d’argiles et d’oxyde/hydroxyde de Fe-Mn lors de la météorisation du till (Nikkarinen et al.,1984). L’impact de la présence d’oxyde/hydroxyde de Fe-Mn sur la signature en éléments traces peut être limité dans certains cas, suggérant une efficacité relative de piégeage de ces minéraux ou une mise en solution partielle des métaux selon la solubilité des minéraux lors de l’altération de surface (Shilts,1984,1996).
La systématisation des campagnes d’échantillonnage géochimique de surface a mené à la génération de jeux de données de taille importante, difficilement interprétable sans traitement préalable. L’utilisation d’outils de statistiques multivariées, d’interpolation spatiale, et de visualisation à l’aide de systèmes d’informations géographiques permet de mettre en avant les associations géochimiques et de les projeter en carte, simplifiant ainsi l’interprétation de ces dernières. Il est alors possible de comparer les données géochimiques à d’autres sources (photos satellites, comptages de clastes et de minéraux indicateurs, etc.). Cette approche a été appliquée à l’échelle régionale ou locale dans le cadre de nombreux projets de prospection glaciaire (e.g. Grünfeld,2007;McMartin et al.,2016;Eppinger et al.,2013).
L’utilisation des minéraux indicateurs est l’une des plus anciennes méthode de prospection minérale avec le pannage de l’or et des pierres précieuses et des méthodes classiques de concen-tration densimétrique ont montré leur efficacité pour localiser des gisements d’or (Boyle et Gleeson,1972). L’utilisation des minéraux indicateurs en terrain glaciaire a montré son utilité lors d’études de cas de kimberlites diamantifères ( e.g. McClenaghan et Kjarsgaard 2001), de gisements d’or (Averill,2001;McClenaghan,2001), d’un gisement de terres rares ( McClena-ghan et al., 2017b) et d’un gisement de tungstène-molybdène (McClenaghan et al., 2017a). Les minéraux indicateurs associés aux gisements d’or incluent l’or, les sulfures, les tellures, la scheelite, la cassitérite, le rutile, certains minéraux secondaires (McClenaghan et Cabri,2011) et la tourmaline (Grzela,2017). Les grains d’or, en raison de leur malléabilité, peuvent se dé-former lors du transport glaciaire, renseignant alors sur une potentielle distance de transport par rapport à la source (DiLabio,1990;Averill,2001).
Des études en cours se concentrent sur la caractérisation de la signature en éléments traces de plusieurs minéraux indicateurs, comme la scheelite, afin de développer de nouveaux outils applicables à la prospection de gisements minéralisés dans de nombreux contextes (Manéglia et al.,2018; Poulin et al., 2018;Sciuba et al., sous presse). L’utilisation de la signature en éléments traces de la scheelite peut permettre dans certains cas d’identifier les caractéristiques chimiques et compositionnelles du fluide lors de sa précipitation (Ghaderi et al.,1999;Brugger et al.,2008), les processus minéralisateurs (Brugger et al.,2000) ou le grade métamorphique atteint lors de la cristallisation de la scheelite (Sciuba et al.,sous presse).
Problématique
Le gisement d’or Amaruq est situé à 120 km au NNO du village de Baker Lake, dans la région du Kivalliq au Nunavut (Canada). Les travaux de prospection et de développement du gisement permettent un accès à la région grâce au support logistique de Mines Agnico Eagle Limitée. Les sources minéralisées dans le socle sont bien identifiées. Ces dernières sont encaissées dans les roches de la ceinture de roches vertes néoarchéennes du Groupe de Wood-burn Lake, dont le grain structural est sub-orthogonal à la direction d’écoulement glaciaire principale (Zaleski et al.,2000;McMartin et al.,2013).
La zone d’étude est recouverte par une couverture de till d’épaisseur variable, laissant ap-paraître localement le socle sous-jacent. La présence de ces sédiments glaciaires quaternaires témoigne de l’érosion et du transport glaciaire ainsi que de la déposition de diamictons par l’Inlandsis Laurentidien lors de la glaciation wisconsinienne. Plusieurs trains de dispersion en arsenic ont été définis par une campagne d’échantillonnage du till réalisée en 2015 par Mines Agnico Eagle Limitée (AEM). Ces trains de dispersion sont localement associés à des blocs minéralisés. Ces trains de dispersion sont présents dans différents types de till et de modelés glaciaires identifiables en photo aérienne sur la propriété. De plus, le terrain d’étude est localisé dans une zone de pergélisol continu impliquant des processus de cryoturbation dans la partie supérieure des dépôts quaternaires. Il est donc justifié de se questionner sur les modalités d’expression de la signature géochimique et minéralogique du gisement dans les sédiments glaciaires, sur la géométrie de la dispersion glaciaire en surface, et sur les impacts des processus cryogéniques dans la couche active. Ces connaissances vont alors permettre de proposer de nouvelles stratégies de prospection en terrain pergélisolé sous couverture glaciaire.
Objectifs
Ce projet de maîtrise a pour objectif de contraindre la signature de la minéralisation aurifère dans les sédiments glaciaires :
— Caractériser la géochimie de la fraction fine du till et identifier l’expression de la miné-ralisation,
— Définir la géométrie des trains de dispersion reliés à la minéralisation,
— Caractériser la signature en minéraux indicateurs dans le till (comptage/forme des grains d’or et comptage des grains de scheelite),
— Étudier le fractionnement géochimique vertical le long de profils d’ostioles pour identifier l’impact de la cryoturbation sur la signature de la minéralisation,
— Étudier la signature en éléments traces de la scheelite dans les zones minéralisées du gisement et la comparer avec celle des grains extraits du till.
Méthodologie
Échantillonnage de sédiments glaciaires
Afin de répondre à la problématique et aux objectifs du projet, quatre transects, parallèles à la direction d’écoulement glaciaire principale, ont été échantillonnés dans des ostioles sur une distance maximale de 6 kilomètres. Le pas d’échantillonnage spatial est de 250 mètres proche de la minéralisation, et 500 mètres pour les échantillons aux extrémités des transects. Les quatre transects sont localisés sur des anomalies en arsenic qui ont été préalablement reconnues par la géochimie du till grâce au levé d’AEM. Les échantillons des transects ont été pris en amont et en aval de la minéralisation afin de capturer l’apparition de la minéralisation en surface et de déterminer la nature des teneurs de fond. À chaque localité, trois échantillons ont été récoltés à une profondeur moyenne de 34 cm : (1)∼10 kg de sédiments pour l’étude des minéraux indicateurs ; (2) ∼3 kg de sédiments pour l’analyse géochimique en laboratoire et (3)∼800 g pour des analyses à la fluorescence X portative (pXRF). Une description détaillée de chaque site d’échantillonnage a été réalisée, incluant granulométrie de la matrice, couleurs, natures et formes des clastes, profondeur, taux d’humidité, présence de matière organique et/ou d’oxydation. Quatre profils verticaux d’ostioles ont été échantillonnés, un pour chaque transect, afin d’identifier la variabilité de la composition géochimique du till en profondeur dans la zone active d’un ostiole. Des échantillons de till à distance d’Amaruq ont aussi été collectés selon le même protocole afin de contraindre le bruit de fond régional en minéraux indicateurs.
Localisation de la zone d’étude, des échantillons des transects et de profils par rapport aux zones minéralisées connues. Projection cartographique utilisée : NAD83/UTM Zone 14N
Échantillonnage de minéraux indicateurs dans le gisement
Des échantillons de forage contenant de la scheelite dans les différentes zones minéralisées reconnues par AEM ont été collectés dans les secteurs Mammoth Ouest, Mammoth Est et Whale Tail. Des intervalles d’intérêt à forte teneur en or ont été sélectionnés à l’aide des fiches descriptives et des données géochimiques des forages afin de focaliser l’échantillonnage en périphérie et dans les zones minéralisées. L’inspection de carottes de forage à l’aide d’une lampe UV a permis de sélectionner les échantillons les plus prometteurs. Une description et des photos de chaque échantillon ont été réalisées sur le terrain (lithologie, altération, minéralisation en sulfures, type de minéralisation, etc.).
Géochimie de la fraction fine du till
Les échantillons pour la géochimie ont été séchés à l’Université Laval à température ambiante. Un sous-échantillon de 900 g a été séparé et archivé. Des duplicata, standards (TILL-1,-2,-3, Lynch, 1996) et des blancs analytiques (“Ottawa sand” C-190, Constantin 2008, acide
silicique) ont été ajoutés aux échantillons pour contrôler la qualité des données. Ils représentent 14% des échantillons envoyés au laboratoire. ActLab (Activation Laboratories) a procédé au tamisage des échantillons pour récupérer la fraction granulométrique inférieure à 63 µm. Trois différents types d’analyses ont ensuite été réalisées : (1) analyses partielles suite à une digestion Aqua regia par ICP-MS/OES sur des aliquots de 0,5 g pour Li, Be, B, Na, Mg, Al, P, S, K, Ca, V, Cr, Ti, Mn, Fe, Co, Ni, Cu, Zn, Ga, Ge, As, Se, Rb, Sr, Y, Zr, Sc, Pr, Gd, Dy, Ho, Er, Tm, Nb, Mo, Ag, Cd, In, Sn, Sb, Te, Cs, Ba, La, Ce, Nd, Sm, Eu, Tb, Yb, Lu, Hf, Ta, W, Re, Au, Tl, Pb, Bi, Th, U, Hg ; (2) analyses totales par activation neutronique sur des aliquots de 1,4 g pour Au, As, Br, Cr, Ir, Sb, Sc, Se ; (3) analyses totales par fusion ICP-MS sur des aliquots de 3 g pour SiO2, Al2O3, Fe2O3, MnO, MgO, CaO, Na2O, K2O, TiO2, P2O5, Sc, Be, V, Ba, Sr, Y, Zr, Cr, Co, Ni, Cu, Zn, Ga, Ge, As, Rb, Nb, Mo, Ag, In, Sn, Sb, Cs, La, Ce, Pr, Nd, Sm, Eu, Gd, Tb, Dy, Ho, Er, Tm, Yb, Lu, Hf, Ta, W, Tl, Pb, Bi, Th, U. Les échantillons de la campagne d’échantillonnage d’AEM ont été analysés avant ce projet. Ils ont été tamisés par voie humide pour récupérer la fraction inférieure à 63 µm. Les échantillons ont été ensuite séchés à 160 degrés pendant 10 à 12 heures puis analysés au laboratoire ALS Chemex à Val-d’Or pour une digestion par Aqua regia suivit d’une analyse ICP-MS d’aliquots de 0,5 g pour Ag, Al, As, Au, B, Ba, Be, Bi, Ca, Cd, Ce, Co, Cr, Cs, Cu, Fe, Ga, Ge, Hf, Hg, In, K, La, Li, Mg, Mn, Mo, Na, Nb, Ni, P, Pb, Pd, Pt, Rb, Re, S, Sb, Sc, Se, Sn, Sr, Ta, Te, Th, Ti, Tl, U, V, W, Y, Zn, Zr.
Suite au contrôle de la qualité, les données ont fait l’objet d’une analyse exploratoire à l’aide de statistiques uni- et multi-variée afin d’identifier et caractériser la structure des données (Grunsky,2010). L’analyse a permis le calcul de statistiques univariées classiques (min, max, moyenne, médiane, 1eret 3equartile), la création de figures pour chaque élément (histogramme de fréquence et courbe de probabilité de densité, diagramme Q-Q, boîte à moustaches) et la visualisation de la distribution mono élémentaire en carte. Une approche bivariée a ensuite utiliser les coefficients de corrélation de Pearson et Spearman et des matrices de nuage de points sur les données brutes et ouvertes à l’aide de la transformation log centrée ( Aitchi-son, 1986) afin de caractériser les couples élémentaires associés. Une analyse en composante principale (ACP) sur les données imputées et ouvertes selon le protocole de Makvandi et al.
(2016) a été réalisée avec le logiciel R (R Core Team, 2018) et la visualisation spatiale des données avec le logiciel QGIS (QGIS Development Team, 2009). La grille d’échantillonnage géochimique d’AEM a fait l’objet d’une interpolation par krigeage ordinaire avec le logiciel ArcMap (ESRI).
Minéraux indicateurs
Les concentrés de minéraux lourds contenant les minéraux indicateurs ont été préparés par Overburden Drilling Management Limited (ODM) selon le protocole de la Commission
géolo-gique du Canada (McClenaghan et al.,2000;Spirito et al.,2011). Le protocole est le suivant : avant tout traitement, un échantillon témoin est archivé. Le reliquat est ensuite tamisé par voie humide à 2 mm. Le passant est séparé par densité à l’aide d’une table à secousse, puis reconcentré à la batée. Le comptage de grains d’or et la caractérisation de la forme des grains d’or sont réalisés sur le concentré de batée et retournés dans le concentré de table. Ce dernier est ensuite tamisé par voie sèche à 0.25 mm et le passant stocké. La fraction 0.25 à 2 mm est ensuite séparée par densité à l’aide de liqueur lourde de densité 3. Les grains de densité supérieure à 3 sont ensuite séparés pour les minéraux magnétiques à l’aide d’un aimant. La portion non magnétique est de nouveau divisée à l’aide d’une liqueur lourde de densité 3.2. Dans le cadre de cette étude, uniquement la fraction de densité supérieure à 3.2 a été utilisée, la densité de la scheelite étant 6.09. Le concentré de minéraux lourds d’intérêt a été tamisé à l’aide d’une colonne composée de tamis de 1, 0.5 et 0.25 mm à l’Université Laval. Chaque fraction granulométrique a été pesée et la scheelite identifiée et comptée à l’aide d’une lampe UV sous une loupe binoculaire. Comme le concentré de batée n’a pas été retourné dans le concentré de table pour les échantillons de 2016, celui-ci a aussi été tamisé selon la même colonne, avec l’ajout d’acétone sous hotte pour éviter de perdre les grains collés sur le tube en plastique. Les grains de scheelite ont été comptés selon le même protocole que les concentrés de minéraux lourds. Un contrôle partiel de la chimie des grains a été réalisé grâce à un MEB équipé d’un capteur EDS afin de valider les observations.
Composition chimique de la scheelite
Suite à la préparation des sections polies à l’Université Laval, une analyse pétrographique au microscope optique a été réalisée afin de définir l’assemblage minéralogique associé à la scheelite. Les grains extraits des échantillons de till ont été montés dans des pastilles d’époxy. La composition chimique des grains de scheelite du gisement et du transect Whale Tail a été quantifiée à l’aide de la microsonde électronique (CAMECA SX-100) à l’Université Laval selon le protocole de Sciuba et al. (sous presse). Les analyses ont été effectuées en utilisant une différence de potentiel de 15 Kv, un courant de 20 nA et une taille de faisceau de 10 µm pour les éléments majeurs (Ca, W). Les éléments traces (Fe, Mo, Sr, Y et Na) ont été quantifiés en utilisant une différence de potentiel de 15 kV, un courant de 100 nA et une taille de faisceau de 10 µm. Une étude par cathodoluminescence à la microsonde électronique a été exécutée afin de documenter la potentielle zonation des grains de scheelite.
La quantification des éléments traces des grains de scheelite a été réalisée par ablation laser et spectroscopie de masse à plasma à couplage inductif au laboratoire LabMaTer de l’Université du Québec à Chicoutimi (UQAC), équipé d’un laser Resolution M-50 Excimer 193 nm associé à un spectromètre de masse Agilent 7700x. Lors de l’acquisition, les lignes ont été préférées aux points, permettant ainsi de documenter de potentielles zonations chimiques. La taille de
faisceau du laser utilisée est 33 µm, avec une fluence de 5.0 et 5.5 J/cm2, une fréquence de 10 Hz et une vitesse de déplacement de 10 µm/s. Les standards NIST-610, NIST-612, Gprobe6, GSE et GSD on été analysés toutes les 20 analyses, aux pauses, et à chaque début et fin de sessions analytiques. La réduction a été réalisée à l’aide du logiciel Iolite en utilisant le standard GSE et une valeur de44Ca de 13,9% (composition moyenne obtenue dans la scheelite du gisement et dans la scheelite des échantillons de surface) comme standard interne pour la liste d’éléments suivant : 7Li, 11B, 23Na, 24Mg,29Si, 39K, 43Ca,47Ti, 49Ti, 51V, 53Cr,55Mn, 57Fe, 58Fe, 59Co, 63Cu , 65Cu, 66Zn,75As, 88Sr, 89Y,93Nb,95Mo,107Ag, 118Sn,137Ba, 139La, 140Ce, 141Pr, 146Nd, 147Sm, 153Eu, 157Gd, 159Tb, 163Dy, 165Ho, 166Er, 169Tm, 172Yb, 175Lu, 181Ta, 182W,208Pb,232Th et 238U.
Présentation de l’article
Le chapitre 1 est écrit en anglais sous forme d’un article intitulé « Dispersal of the Amaruq gold deposit signature in glacial sediments using geochemical and mineralogical data ». Il a été écrit par Victor de Bronac de Vazelhes (premier auteur) sous la supervision de Georges Beaudoin (Université Laval) et Isabelle McMartin (Commission géologique du Canada). Après l’introduction, ce chapitre présente le contexte quaternaire et géologique avec une brève des-cription du gisement Amaruq. La méthodologie est suivie d’une desdes-cription détaillée des profils des ostioles, de la géochimie des transects ainsi que de la grille géochimique à l’aide de statis-tiques uni- et multi-variées. Les comptages de minéraux indicateurs sont aussi décrits ainsi que l’analyse de la morphologie des grains d’or. L’analyse pétrographique et chimique des grains de scheelite de la minéralisation est comparée à celle des grains provenant des échantillons de surface du transect de Whale tail. Ce transect a été choisit pour tester la signature des grains de scheelite comme outil de prospection glacio-sédimentaire à cause de la diversité des unité de surface échantillonnés ; ainsi que la présence d’un till dit distal ayant une composant régionale significative, multipliant les probabilités d’observation de différent type de grains de scheelite. Ce chapitre se conclut par une discussion des résultats et une conclusion.
Bibliographie
Aitchison, J. 1986, The statistical analysis of compositional data, Monographs on statistics and applied probability, Chapman and Hall, London, 416 p..
Averill, S. A. 2001, « The application of heavy indicator mineralogy in mineral exploration with emphasis on base metal indicators in glaciated metamorphic and plutonic terrains », dans
Drift Exploration in Glaciated Terrain, édité par M. B. McClenaghan, P. T. Bobrowsky,
G. E. M. Hall et S. J. Cook, Geological Society, London, Special Publications 185, p. 69–81. Boyle, R. W. et C. F. Gleeson. 1972, « Gold in the heavy mineral concentrates of stream sediments, Keno Hill area, Yukon Territory », Geological Survey of Canada, vol. Paper 71-51.
Brugger, J., B. Etschmann, M. Pownceby, W. Liu, P. Grundler et D. Brewe. 2008, « Oxidation state of europium in scheelite : Tracking fluid–rock interaction in gold deposits », Chemical
Geology, vol. 257, p. 26–33.
Brugger, J., Y. Lahaye, S. Costa, D. Lambert et R. Bateman. 2000, « Inhomogeneous distri-bution of REE in scheelite and dynamics of Archaean hydrothermal systems (Mt. Charlotte and Drysdale gold deposits, Western Australia) », Contributions to Mineralogy and
Petro-logy, vol. 139, p. 251–264.
Constantin, M. 2008, « Trace Element Data for Gold, Iridium and Silver in Seventy Geoche-mical Reference Materials », Geostandards Newsletter, vol. 33, no 1, p. 115–132.
DiLabio, R. N. W. 1985, « Gold abundance vs. grain size in weathered and unweathered till »,
Geological Survey of Canada, vol. Paper 85-1A, p. 117–122.
DiLabio, R. N. W. 1990, « Classification and Interpretation of the Shapes and Surface Textures of Gold Grains From Till On the Canadian Shield », Geological Survey of Canada, vol. Paper 90-1C, p. 323–329.
DiLabio, R. N. W. 1995, « Residence sites of trace elements in oxydized till », Geological
Survey of Canada, vol. Papers 1995-2, p. 139–148.
Drake, L. D. 1983, « Ore plumes in Till », The Journal of Geology, vol. 91, no 6, p. 707–713.
Dreimanis, A. et U. J. Vagners. 1971, « The effect of lithology upon texture of till », dans
Research methods in pleistocene geomorphology, édité par E. Yatsu et A. Falconer, p. 66–82.
Dyke, A. S. et V. K. Prest. 1987, « Late Wisconsinan and Holocene Retreat of the Laurentide Ice Sheet », Geological Survey of Canada, vol. Map 1702A.
Eppinger, R. G., D. L. Fey, S. A. Giles, E. C. Grunsky, K. D. Kelley, B. J. Minsley, L. Munk et S. M. Smith. 2013, « Summary of Exploration Geochemical and Mineralogical Studies at the Giant Pebble Porphyry Cu-Au-Mo Deposit, Alaska : Implications for Exploration Under Cover », Economic Geology, vol. 108, no 3, p. 495–527.
Garrett, R. G., C. Reimann, D. B. Smith et X. Xie. 2008, « From geochemical prospecting to international geochemical mapping : a historical overview », Geochemistry : Exploration,
Environment, Analysis, vol. 8, p. 205–217.
Ghaderi, M., J. M. Palin et I. H. Campbell. 1999, « Rare earth element systematics in scheelite from hydrothermal gold deposits in the Kalgoorlie-Norseman region, Western Australia »,
Economic Geology, vol. 94, p. 423–438.
Grünfeld, K. 2007, « The separation of multi-element spatial patterns in till geochemistry of southeastern Sweden combining GIS, principal component analysis and high-dimensional visualization », Geochemistry : Exploration, Environment, Analysis, vol. 7, p. 303–318. Grunsky, E. C. 2010, « The interpretation of geochemical survey data », Geochemistry :
Ex-ploration, Environment, Analysis, vol. 10, p. 27–74.
Grzela, D. 2017, Chemical composition of indicator minerals from orogenic gold deposits and
glacial sediments of the Val-d’Or district (Québec, Canada), mémoire de maîtrise, Université
Laval.
Lynch, J. 1996, « Provisional Element Values for Four New Geochemical Soil and Till Refe-rence Material, TILL-1, TILL-2, TILL-3 and TILL-4 », Geostandards Newsletter, vol. 20, no 2, p. 277–287.
Makvandi, S., M. Ghasemzadeh-Barvarz, G. Beaudoin, E. C. Grunsky, M. Beth McClena-ghan et C. Duchesne. 2016, « Principal component analysis of magnetite composition from volcanogenic massive sulfide deposits : Case studies from the Izok Lake (Nunavut, Canada) and Halfmile Lake (New Brunswick, Canada) deposits », Ore Geology Reviews, vol. 72, p. 60–85.
Manéglia, N., G. Beaudoin et M. Simard. 2018, « Indicator minerals of the Meliadine oro-genic gold deposits, Nunavut (Canada), and application to till surveys », Geochemistry :
Exploration, Environment, Analysis, vol. 18, p. 241–251.
McClenaghan, M. B. 2001, « Regional and local-scale gold grain and till geochemical signatures of lode Au deposits in the western Abitibi Greenstone Belt, central Canada », dans Drift
Exploration in Glaciated Terrain, édité par M. B. McClenaghan, P. T. Bobrowsky, G. E. M.
Hall et S. J. Cook, Geological Society, London, Special Publications, p. 201–224.
McClenaghan, M. B. et L. J. Cabri. 2011, « Review of gold and platinum group element (PGE) indicator minerals methods for surficial sediment sampling », Geochemistry : Exploration,
Environment, Analysis, vol. 11, p. 251–263.
McClenaghan, M. B. et B. A. Kjarsgaard. 2001, « Indicator mineral and geochemical methods for diamond exploration in glaciated terrain in Canada », dans Drift Exploration in
Glacia-ted Terrain, édité par M. B. McClenaghan, P. T. Bobrowsky, G. E. M. Hall et S. J. Cook,
Geological Society, London, Special Publications, p. 83–123.
McClenaghan, M. B., M. A. Parkhill, A. G. Pronk, A. A. Seaman, M. W. McCurdy et M. I. Leybourne. 2017a, « Indicator mineral and geochemical signatures associated with the Sis-son W–Mo deposit, New Brunswick, Canada », Geochemistry : Exploration, Environment,
McClenaghan, M. B. et R. C. Paulen. 2018, « Application of till mineralogy and geochemistry to mineral exploration », dans Past Glacial environments, édité par J. Menzies et J. J. M. van der Meer, p. 689–751.
McClenaghan, M. B., R. C. Paulen, I. M. Kjarsgaard et R. Fortin. 2017b, « Rare earth element indicator minerals : an example from the Strange Lake deposit, Quebec and Labrador, eastern Canada », dans Exploration 17 Workshop 5 : Application of Indicator Mineral
Methods to Bedrock Sediments, édité par M. B. McClenaghan et D. Layton-Matthews,
Exploration 17, p. 71–78.
McClenaghan, M. B., L. H. Thorleifson et R. N. W. DiLabio. 2000, « Till geochemical and indicator mineral methods in mineral exploration », Ore Geology Reviews, vol. 16, p. 145– 166.
McMartin, I., R. G. Berman, P. X. Normandeau et J. A. Percival. 2013, « Till composition of a transect across the Thelon tectonic zone, Queen Maud block, and adjacent Rae craton : results from the Geo-Mapping Frontiers’ Chantrey project », Geological Survey of Canada, vol. Open File 7418, p. 26.
McMartin, I., L. A. Dredge, E. Grunsky et S. Pehrsson. 2016, « Till geochemistry in west-central Manitoba : Interpretation of provenance and mineralization based on glacial history and multivariate data analysis », Economic Geology, vol. 111, no 4, p. 1001–1020.
Miller, J. K. 1984, « Model for clastic indicator trains in till », dans sixth international
Pros-pecting in areas of glaciated terrain symposium, Institution of Mining and Metallurgy, p.
69–77.
Nikkarinen, M., E. Kallio, P. Lestinen et M. Ayräs. 1984, « Mode of occurrence of Cu and Zn in till over three mineralized areas in Finland », Journal of Geochemical Exploration, vol. 21, p. 239–247.
Poulin, R. S., D. J. Kontak, A. McDonald et M. B. McClenaghan. 2018, « Assessing Schee-lite As an Ore-deposit Discriminator Using Its Trace-element and REE Chemistry », The
Canadian Mineralogist, vol. 56, p. 265–302.
Prest, W. H. 1915, The Gold Fields of Nova Scotia , A prospector Handbook, Halifax, N.S : Industrial Pub. Co., The industrial Publishing Co, Limited.
QGIS Development Team. 2009, QGIS Geographic Information System, Open Source Geo-spatial Foundation. URLhttp://qgis.osgeo.org.
R Core Team. 2018, R : A Language and Environment for Statistical Computing, R Foundation for Statistical Computing, Vienna, Austria. URL https://www.R-project.org/.
Sauramo, M. 1924, « Tracing of Glacial Boulders and its Application in Prospecting », Bulletin
de la Commission Géologique de Finlande, vol. 67, p. 44.
Sciuba, M., G. Beaudoin, D. Grzela et S. Makvandi. sous presse, « Trace element composition of scheelite », Mineralium Deposita.
Shilts, W. W. 1973, « Drift prospecting ; geochemistry of eskers and till in permanently frozen terrain : District of Keewatin, Northwest Territories », Geological survey of Canada, vol. paper 72-45.
Shilts, W. W. 1984, « Till geochemistry in Finland and Canada », Journal of Geochemical
Exploration, vol. 21, p. 95–117.
Shilts, W. W. 1996, « Drift Exploration », dans Past Glacial Environments Sediments, Form
and Techniques, édité par J. Menzies, p. 411–561.
Spirito, W. A., M. B. McClenaghan, A. Plouffe, I. McMartin, J. E. Campbell, R. C. Paulen, R. G. Garrett et G. E. M. Hall. 2011, « Till sampling and analytical protocols for GEM projects : from field to archive », Geological Survey of Canada, vol. Open File 6850, p. 83. Zaleski, E., S. Pehrsson, N. Duke, W. J. Davis, R. L’Heureux, E. Greiner et J. A. Kerswill. 2000, « Quartzite sequences and their relationships, Woodburn Lake group, western Chur-chill Province, Nunavut », Geological Survey of Canada, vol. Current Research 2000-C7, p. 10.
Chapitre 1
Dispersal of the Amaruq gold
depo-sit signature in glacial sediments using
geochemical and mineralogical data
1.1
Introduction
For the most part, northern Canada is covered by a blanket of Quaternary glacial sediments of variable thickness. These deposits are largely the result of ice sheet advance and retreat during the last Wisconsinan glaciation, and post-glacial processes, molding and shaping the landscape. Part of this environment is also underlain by continuous permafrost (Brown et al.,
1997), causing cryoturbation processes during summer months with development of an active layer in the upper part of the sediments/soils. As northern latitudes have been under-explored for mineral deposits, and discovery is complicated by the quaternary cover, there is a need to document the signature of mineral deposits in glacial sediments to develop efficient methods for mineral exploration. The Amaruq gold deposit in Nunavut (Figure 1.1) is located in an area of continuous permafrost and is covered by a complex patchwork of glacial and post-glacial sediments. Subcropping mineralization, with a strike almost orthogonal to the regional ice flow direction, makes the deposit an ideal case study for the characterization of glacial dispersal and application for gold exploration. Till matrix geochemistry, indicator mineral abundance and chemical composition, multivariate statistical analysis and map interpolation are used to capture the mineralization signature and its dispersal in glacial sediments, and to assess the impact of cryoturbation. The chemical signature of scheelite from the deposit is compared to that from till samples from the Whale Tail transect in order to test the applicability of scheelite trace element signature as an exploration tool in drift prospecting. This transect was chosen due to its complex surficial glacial cover and the occurence of a till unit with a significant regional component, increasing the probabilities of scheelite grains occurrences unrelated to the deposit.
100 km
?
?
60° 64° 68° -105° -100° -95° -90° -85° Dubawnt Lake ice stream Amaruq Hudson Bay N.W .T. NunavutKID
NFigure 1.1 – Location of the Amaruq deposit in the eastern part of Nunavut and regional ice flow patterns. The red line shows the last position of the Keewatin Ice Divide (KID) and arrows show ice flow directions. Ice extent at 814C ka BP is marked by the blue dashed line from Dyke(2004). Modified afterMcMartin and Henderson (2004)
.
1.2
Geological setting
1.2.1 Regional geologyThe Amaruq gold deposit is located in the western part of the Churchill Province within the Archean Rae craton, bordered to the northwest by the Taltson-Thelon magmatic zone and to the southeast by the Archaean or Paleoproterozoic Snowbird Tectonic Zone (Hoffman,1988;
Berman et al.,2007;Pehrsson et al.,2013;Hanmer et al.,1995). The Rae craton is made up of Meso- to Neoarchean intrusive rocks (Pehrsson et al.,2013) and NE-SW trending greenstone belts (Zaleski et al., 2000; Pehrsson et al., 2013). The Neoarchean Woodburn Lake is one of the volcanosedimentary belts, hosting the Amaruq deposit. It consists of ultramafic to
felsic volcanic/intrusive rocks and sedimentary packages, including silicate/oxide facies iron formations, cherts and greywackes (Zaleski et al., 1997, 1999, 2000). The Woodburn Lake Group is subdivided in six assemblages from the oldest Half Way Hills (2.74 Ga), Wading assemblage, North Meadowbank assemblage (2.72 Ga), Rumble assemblage, Pipedream (2.71 Ga) to the youngest, > 2.68 Ga, Amarulik assemblage (Jefferson et al.,2015;Janvier et al.,
2015; Sherlock et al.,2004). Sherlock et al. (2004) suggested a continental margin rifting or back-arc basin tectonic setting.
1.2.2 Local geology and gold mineralization
The Amaruq gold deposit is hosted by the Rumble assemblage of the Woodburn Lake Group supracrustal rocks, between the Meadowbank River Deformation Zone to the south and the Paleoproterozoic Amer Group to the north. The Rumble assemblage consists of three rock units, forming a NE-SW trending, steeply dipping, greenstone belt at Amaruq (Figure 1.2). In the Whale Tail sector, graded bedding in sedimentary rocks suggests that the sequence youngs towards the south (Côté-Mantha et al.,2017). The northern domain (ND) is mainly composed of greywackes, mudstones and cherts topped by tholeitic ultramafic flows and thin silicate facies iron formation beds ending with a thick iron formation sequence. The central sedimentary sequences (CSS) consist of siliciclastic (greywackes and mudstones) and chemical (chert and minor iron formations) sedimentary rocks, respectively characterized by a high carbon content, with locally graphite, and preserved sedimentary/diagenetic sulfure texture (Côté-Mantha et al., 2017). The southern rock package (SD) begins with transitional to calc-alkaline mafic-ultramafic flows, followed by greywackes. To the south, this sequence is intruded by a diorite pluton. The metamorphic grade ranges from upper greenschist to the lower amphibolite facies (Thompson,2015;Valette et al.,2018).
Based on host rocks and mineralization styles, three sectors are defined on the property: IVR, Whale Tail and Mammoth (Côté-Mantha et al.,2017, Figure 1.2). Three styles of gold mineralization are documented in the deposit (Côté-Mantha et al.,2017;Valette et al.,2018). The first consists of stratabound and locally discordant replacement in iron formations where gold is found as inclusion of fractures filling in pyrrhotite or arsenopyrite, with a gangue composed of amphibole, carbonate, and quartz. They are observed forming lenses, layers or disseminated within the iron formation (Figure 1.2C). Garnet, biotite and stilpnomelane also occur but their relationship with the mineralization is still unclear. This mineralization style is well developed within or near Whale Tail high strain zones, which is also marked by hydrothermal silicification and/or quartz veins. The second type of mineralization consists of gold associated with pyrrhotite (and/or pyrite), arsenopyrite and loellingite in three zones of hydrothermal silicification within the Whale Tail Central sediment sequence (Figure 1.2
recrystallized arsenopyrite (Lauzon et al., 2017). The third style consists of native gold in deformed and recrystallized quartz veins associated with base metal sulfides (chalcopyrite, sphalerite, galena) and arsenopyrite (Figure 1.2E). This style occurs throughout the deposit but is more abundant in biotite/carbonate (± sericite) altered ultramafic rocks.
The Amaruq deposit is currently interpreted as a “mesothermal lode-gold mineralization, including (but not restricted to) hybrid, stratabound and vein-type iron-formation-hosted gold deposits” (Côté-Mantha et al.,2017).
Legend Geology chert diorite iron formation gabbro granite quartzite felsic volcanic rocks intermediate volcanic rocks
ocks ocks sedimentary rocks gold mineralization lakes N IVR Whale Tail Mammoth cross-section Figure 1.2 B Diorite Chert, mudstone s Iron formation c Sediments Mineralized zone 9900Elev 10100Elev 10000Elev 9900Elev 9800Elev 9700Elev 9600Elev 10100Elev 10000Elev 9800Elev 9700Elev 9600Elev Surface North South 50 m B A C D E ND CSS SD
Figure 1.2 – (A) Local geology of the Amaruq property. Location of sub-cropping min-eralization is highlighted in black with location of mineralized zones discussed in the text. Lakes are outlined in white with transparence; map projection used : NAD83/UTM Zone 14N. Courtesy of Agnico Eagle Mines Limited; (B) Schematic cross-section of the Whale Tail sector; (C) Mineralized iron formation; (D) Hydrothermal silicification with pyrrhotite and arsenopyrite; (E) Mineralized quartz veins croscutting a mafic/ultramafic volcanic rock. Cross-section and core pictures modified from Côté-Mantha et al.(2017).
1.2.3 Surficial geology
The area was covered by the Keewatin Sector of the Laurentide Ice Sheet (LIS) during the last Wisconsinan Glaciation. Ice cover in North America reached its maximum around 18 14C ka BP, stayed relatively stable for thousands of years, and retreated after 1414C ka BP (Dyke,2004). Multiple crosscutting ice flow indicators at the regional scale show instabilities during LIS lifetime and the migration of the Keewatin Ice Divide across the region (McMartin and Henderson, 2004; Hodder et al.,2016). The Amaruq deposit region was deglaciated by approximately 7 to 6 ka BP (Dyke et al., 2003; Dyke, 2004). Amaruq is located within an area characterized by well-developed ribbed moraines, drumlin fields and eskers (Aylsworth and Shilts, 1989), about 100 km northwest of the last position of the Keewatin Ice Divide (McMartin and Henderson,2004, Figure1.1). A regional surficial geological map byThomas
(1981) shows a cover of silty-sandy till. According toThomas(1981), reworked till is also found where the till fine-grained fraction is removed by periglacial processes, or mixed with sand from marine, lacustrine or glaciofluvial sediments. Numerous glacial landforms are visible in the area, with crag-and-tail and other streamlined landforms southwest of Whale Tail Lake, as well as moraine ridges southwest and northeast of the deposit (Thomas,1981). Those landforms show a general paleo-glacial flow direction oriented NNW to NW, confirmed by local ice-flow indicators measured in the field (Boulianne-Verschelden et al.,2017) and regional indicators reported in McMartin et al. (2013). Three major sets of ice-flow indicators are apparent near the deposit, with the oldest oriented NNW, and younger NW to WNW ( Boulianne-Verschelden et al., 2017), revealing an anticlockwise ice-flow rotation also recognized to the south in the Baker Lake area (McMartin et al., 2006). Eskers, trending mainly NW, are associated with ice-contact or other glaciofluvial deposits (Thomas, 1981). Locally, late re-orientations of ice flow indicators towards the esker tunnels are observed.
Boulianne-Verschelden et al. (2017) identified three types of till in the Amaruq area (Figure
1.3). The first is a distal till with significant components derived from regional bedrock lithologies up-ice of the deposit, typically forming drumlinoid ridges. This distal till unit is commonly covered by frost boils and reveals solifluction on the slopes of the landforms reflecting an important proportion of fine-grained particles. Bedrock outcrops and boulders are rarely associated with this unit. Boulder cover do not exceed 20%. The second type is a proximal till forming small moraines. Most of its surface is covered by a layer of glacial boulders with scattered frost boils. Outcrops are more common. The third type is a hybrid till with characteristics of both the distal and proximal tills, and which typically forms small moraines; frost boils are scattered but in higher proportion compared to the proximal till. The boulder cover is less dense (30 to 40%) than that of the proximal till (>70% ). A NNW-trending esker extends on either sides of Whale Tail Lake, crosses the IVR zone and continues north towards a large glaciofluvial outwash deposit (Figure 1.3).
1 2 3 600000 602000 604000 606000 608000 610000 7258000 7256000 7254000 7252000
N
2 km 1 0 Melt w ater channelCrag-and-tail Drumlinoid Morainic ridge Esk
er Ice flo w idicato r Outcrop Kame Surficial material Lak e Anthrop ogenic material
Glaciofluvial sediments Glaciolacrustine sediments Undifferentiated till Distal till Hyb
rid till Pro ximal till Ice flo w Directions Bedro ck
Boulders Organic veneer
Legend Figure 1.3 – Simplified preliminary map of the surficial geology in the Amaruq dep osit area, mo dified after Boulianne-V ersc helden et al. , 2017 . The b oulder unit is mainly represen t b y b oulders of glacial origin, asso ciated with pro ximal till. It also include lo cal felsenmeer near outcrop s or in distal. Scarce residual Boulders are found near lak es and riv ers. Map pro jection used : NAD83/UTM Zone 14N
1.3
Methodology
1.3.1 Field samplingDuring the 2016 and 2017 field seasons, till samples were collected in frost boils at an average depth of 34 cm following the protocols developed at the Geological Survey of Canada (Spirito et al., 2011) for indicators minerals (10 kg) and till geochemistry (3 kg). Sixty-one samples were collected in four transects parallel to the main ice-flow direction (NNW) with samples collected up-ice, over and down-ice of mineralization. The transects were centered on known arsenic anomalies defined from a previous detailed till survey (100 m spacing) by Agnico Eagles Mines Ltd., covering an area of 40 km2 around the deposit. The spacing between samples along the transects was approximately 250 m, but extended to 500 m intervals at the extremeties of the transects (Figure 1.4). For each transect, a vertical profile in a frost boil was sampled for geochemistry (3 kg) at 10 centimeters intervals from the surface to a maximum depth of 115 cm. A 10 kg sample was also collected for each profile at ∼33 cm depth. In order to assess the gold grain count background, 19 regional samples were collected mainly up-ice of known mineralization. Sample location are available in appendix A.
Bedrock samples from drill cores containing scheelite were collected within the deposit from mineralised intervals preselected using AEM log and gold assay database. The use of a field short wave UV lamp with a set-up to avoid the polar midnight sun was useful to locate scheelite-bearing samples.
1.3.2 Till geochemistry
For the transect and regional samples, a 900 g split was archived prior to preparation from the 3 kg sample. The remaining material was dried at room temperature at the Université Laval, and sent to Activation Laboratories (Ancaster, ON). After sieving by the lab at 63 µm, 1.5 g was analysed for Au, As, Br, Cr, Ir, Sb, Sc, Se by instrumental neutron activation; 3 g aliquots were analysed for SiO2, Al2O3, Fe2O3, MnO, MgO, CaO, Na2O, K2O, TiO2, P2O5, Sc, Be, V, Ba, Sr, Y, Zr, Cr, Co, Ni, Cu, Zn, Ga, Ge, As, Rb, Nb, Mo, Ag, In, Sn, Sb, Cs, La, Ce, Pr, Nd, Sm, Eu, Gd, Tb, Dy, Ho, Er, Tm, Yb, Lu, Hf, Ta, W, Tl, Pb, Bi, Th, U by lithium meta/tetraborate fusion followed by nitric acid digestion and ICP-MS determination. Aliquots of 0.5 g aliquots were analysed for Li, Be, B, Na, Mg, Al, P, S, K, Ca, V, Cr, Ti, Mn, Fe, Co, Ni, Cu, Zn, Ga, Ge, As, Se, Rb, Sr, Y, Zr, Sc, Pr, Gd, Dy, Ho, Er, Tm, Nb, Mo, Ag, Cd, In, Sn, Sb, Te, Cs, Ba, La, Ce, Nd, Sm, Eu, Tb, Yb, Lu, Hf, Ta, W, Re, Au, Tl, Pb, Bi, Th, U, Hg by Aqua regia ICP MS/OES analysis. All analytical data and detection limits are avalaible in appendix B.1.
0.5 1 1.5 2 2. 5 km Legend transec t sample profiles mineralize d zones la kes 0 3 1 2 ic e flo w directions IVR WhaleT ail Mammoth East MammothW est N CAEXD332771 CAEXD332770 CAEXD332769 CAEXD332768 CAEXD332767 CAEXD332766 CAEXD332765 CAEXD332764 CAEXD332723 CAEXD332724 CAEXD332725 CAEXD332727 CAEXD332728 CAEXD332729 CAEXD332730 CAEXD332731 CAEXD332732 CAEXD332733 CAEXD332734 CAEXD332880 CAEXD332735 CAEXD332881 CAEXD332882 CAEXD332884 CAEXD332883 CAEXD332886 CAEXD332885 CAEXD332747 CAEXD332746 CAEXD332745 CAEXD332744 CAEXD332743 CAEXD332741 CAEXD332742 CAEXD332740 CAEXD332739 CAEXD332738 CAEXD332737 CAEXD332736 CAEXD332879 CAEXD332878 CAEXD332887 CAEXD332748 CAEXD332749 CAEXD332750 CAEXD332751 CAEXD332752 CAEXD332753 CAEXD332754 CAEXD332755 CAEXD332756 CAEXD332757 CAEXD332758 CAEXD332759 CAEXD332760 CAEXD332761 CAEXD332762 CAEXD332763 CAEXD332877 CAEXD332876 CAEXD332726 Figure 1.4 – T ransect and profile sample lo cations for the 2016 and 2017 surv eys. Sub cropping mineralization is highligh ted in red. Map pro ject ion used : NAD83/UTM Zone 14N
Preparation steps and the geochemical methodology followed by AEM, for the 2015 till survey samples is now described. This survey was done prior the start of the Master thesis. Till samples were wet screened in two steps. The first step used 0.375 inches and 2 mm screens. The <2 mm was then wet screened using a column of 1 mm, 425 µm, 112 µm, and 63 µm screens. Material <63 µm was decanted. Mud was recuperated in metallic pan and dried at 325 Fahrenheit for 10 to 12 hours. Samples were sent to ALS Chemex Laboratory in Val-d’Or for Aqua regia ICP-MS ICP-AES analysis of 0.5 g aliquots for Ag, Al, As, Au, B, Ba, Be, Bi, Ca, Cd, Ce, Co, Cr, Cs, Cu, Fe, Ga, Ge, Hf, Hg, In, K, La, Li, Mg, Mn, Mo, Na, Nb, Ni, P, Pb, Pd, Pt, Rb, Re, S, Sb, Sc, Se, Sn, Sr, Ta, Te, Th, Ti, Tl, U, V, W, Y, Zn, Zr.
For geochemistry quality control of the Université Laval dataset, 3 silica blanks, 5 quartz vein blanks (Constantin,2008), 6 blind duplicates and 5 certified reference standards (Till-1, Till-2, Till-3, Lynch,1996) were inserted throughout the sample batches prior to analysis to assess sample cross-contamination and analysis accuracy. Laboratory results for the blanks do not suggest any cross-contamination between samples. Blind duplicates, controlled using the RGR package (Garrett, 2013), indicate that the analytical precision is good for most elements (RSD of log transformed concentrations below 20%). A few elements show higher variability such as gold by neutron activation (RSD =31%, n = 2), Sb INAA (RSD = 38%, n = 3), Ag fusion (RSD = 22%, n = 4) Ho fusion (RSD = 62%, n = 5), W fusion (RSD = 41%, n = 2), Mo Aqua regia (RSD = 34%, n = 6), Sn Aqua regia (RSD = 54%, n = 5), Cs Aqua regia (RSD = 31%, n = 6), Eu Aqua regia (RSD = 70%, n = 5) and W Aqua regia (RSD = 22%, n = 6). Low reproducibility may be related to nugget effects, consequence of the small sample mass analysed, or to the analytical limitations as some elements are near the lower detection limit. Standards show a good instrumental accuracy for most elements for fusion and Aqua regia analyses.
Quality assurance and quality control for the AEM till survey samples is now described. During each processing step prior to analysis, samples were marked using metallic tags and all buckets and screens were washed using high pressured water and pan cleaned with detergents. No blind duplicates were inserted in the AEM dataset. Nevertheless, 110 pulp duplicates were analysed. Analytical precision is good for most elements, with a %RSD below 10%. A few log-transformed elements showed higher variability such as W (RSD = 36%, n = 110), Sn (RSD = 19%, n = 110), Se (RSD = 20%, n = 110) and Au (RSD = 19%, n = 109).
1.3.3 Gold and scheelite grain selection
Till samples were processed for indicator minerals by Overburden Drilling Management Lim-ited (ODM Ltd.). After archiving a 300 g split, samples were wet sieved at 2 mm. The <2 mm fraction was processed using a shaking table; the table concentrate was panned for the recovery of gold grains. After counting gold grains and recording grain shape and size