HAL Id: hal-02532971
https://hal.archives-ouvertes.fr/hal-02532971
Submitted on 6 Apr 2020
HAL is a multi-disciplinary open access
archive for the deposit and dissemination of
sci-entific research documents, whether they are
pub-lished or not. The documents may come from
teaching and research institutions in France or
abroad, or from public or private research centers.
L’archive ouverte pluridisciplinaire HAL, est
destinée au dépôt et à la diffusion de documents
scientifiques de niveau recherche, publiés ou non,
émanant des établissements d’enseignement et de
recherche français ou étrangers, des laboratoires
publics ou privés.
Microstructure-mechanical properties relationships in
vibration welded glass-fiber-reinforced polyamide 66: A
high-resolution X-ray microtomography study
Eeva Mofakhami, Sylvie Tencé-Girault, Jonathan Perrin, Mario Scheel,
Laurent Gervat, Cristian Ovalle Rodas, Lucien Laiarinandrasana, Bruno
Fayolle, Guillaume Miquelard-Garnier
To cite this version:
Eeva Mofakhami, Sylvie Tencé-Girault, Jonathan Perrin, Mario Scheel, Laurent Gervat, et
al..
Microstructure-mechanical properties relationships in vibration welded glass-fiber-reinforced
polyamide 66: A high-resolution X-ray microtomography study. Polymer Testing, Elsevier, 2020,
85, pp.1-12. �10.1016/j.polymertesting.2020.106454�. �hal-02532971�
Microstructure-mechanical properties relationships in vibration welded
glass-fiber-reinforced polyamide 66: A high-resolution X-ray
microtomography study
Eeva Mofakhami
a,b,c, Sylvie Tenc�e-Girault
c,d, Jonathan Perrin
e, Mario Scheel
e,
Laurent Gervat
a, Cristian Ovalle
b, Lucien Laiarinandrasana
b, Bruno Fayolle
c,
Guillaume Miquelard-Garnier
c,*aRenault Technocentre, DEA-TC, 78084, Guyancourt, France
bMINES ParisTech, PSL University, Centre des Mat�eriaux (CMAT), UMR CNRS 7633, 91003, Evry Cedex, France cLaboratoire PIMM, Arts et Metiers Institute of Technology, CNRS, Cnam, HESAM University, 75013, Paris, France dArkema, CERDATO, Route du Rilsan, 27470, Serquigny, France
eSynchrotron SOLEIL, L’Orme des Merisiers, BP 48, Saint-Aubin, 91192, Gif-sur-Yvette, France
A R T I C L E I N F O
Keywords:
Vibration welding Thermoplastic composites Short glass fibers X-ray microtomography Mechanical properties
A B S T R A C T
The effect of initial fiber orientation and welding conditions on the mechanical properties and microstructure of 30 wt% glass-fiber-reinforced polyamide 66 was systematically evaluated. For all conditions studied no signif-icant change in the polymer matrix was evidenced. However, fibers in the welded zone were reoriented toward the squeeze and vibration flows and this reorientation is related to the appearance of cavities, as evidenced by high-resolution synchrotron-based X-ray microtomography. It is shown that stress at break values of the welded samples increase with the thickness of the weld zone together with the minimum value of the fiber orientation tensor component in the tensile direction. A drop of strain at break is also related to an increase in the fibers’ concentration in the weld. The maximum void volume fraction being measured on samples which have the thickest welded zones, counterintuitively it does not induce lower stress at break.
1. Introduction
Due to environmental and economic challenges that now drive the automotive industry, metal parts are being replaced by polymer ones in-side vehicles, with the aim to substantially reduce the total weight, which in turns lower the energy consumption [1]. However, such drastic changes in the materials used also imply changes in the production process. Most industrial polymer parts made of short-glass-fiber-reinforced thermo-plastics are obtained by injection molding process, but for some hollow and complex geometries, it is not possible to inject the whole piece at once [2]. The general admitted solution is then to inject two halves of the piece and join them after injection molding. This is for example the case of the air intake manifold, which is the part that ensures the repartition of air from the outside of a vehicle to the engine cylinders [3].
Vibration welding is one of the most preferred process to do so, as it allows short cycle times, does not require any surface preparation of parts to be welded and does not need additional products such as
adhesives [4]. The operation is in its principle quite simple [5]: first, both parts must be positioned inside aligned jaws to match them. Then, a pressure is applied at the interface and the upper part is horizontally rubbed against the fixed lower one at a vibration frequency of around 200 Hz and an amplitude close to 1 mm. The friction generates heat that forms a molten layer at the polymer-polymer interface. This molten layer is pushed out by the applied pressure and forms a weld flash on both lateral sides of the welded plan. Finally, when the preset meltdown depth or time is reached, vibration is stopped, and pressure is main-tained during cooling. At the end of the cooling phase the bond becomes effective.
The phenomenology of the vibration welding process has been first studied by Stokes [5] who observed distinct phases driven by different physical mechanisms [6]. Briefly, at the beginning of the operation, only Coulomb friction contributes to heat generation as solid parts are rubbed under pressure. A second phase begins when the temperature at the interface reaches the polymer’s melting temperature (or glass transition * Corresponding author.
for glassy polymers) and a molten film is formed at the interface. The thickness of the molten layer increases during this transient phase up to the moment when a balance is reached between the material melting rate and the material outflow rate under applied pressure. Then, in a steady state regime the molten film thickness h0 at the interface is
constant and the penetration between the two parts increases at a con-stant rate _η. This thickness is related to the welding pressure P0, the melt
viscosity of the material μ and the thickness of the plate b via equation
(1) [5,6]. h3
0¼
μb2η_
P0 (1)
As the cooling profile is not the same between welding and injection operations, the microstructure in the heat affected zone differs from the bulk material’s one [7]. Moreover, two flows are created in the molten layer formed at the interface during the welding process: first, the vi-bration flow which originates from the vivi-bration motion; and second, the squeeze flow which is due to the pressure applied between the parts to be joined. These flows also have an important impact on the micro-structure of the welded zone obtained after cooling.
The crystalline morphology in the welded zone has been assessed by optical microscopic observations under polarized light for pristine semi- crystalline polymers. The heat-affected zone is composed of several apparent layers with thicknesses on the order of 10–100 μm, constituted
of either recrystallized spherulites or deformed spherulites. Size and distribution of these layers inside the heat affected zone may vary ac-cording to the nature of the material and the processing conditions [8,9]. These studies also reveal that, as predicted in equation (1), a lower applied pressure actually results in a thicker heat-affected zone for un-reinforced polypropylene (PP) [10,11] and polyamide 6 (PA6) [8], and leads to assemblies with improved mechanical properties, in particular higher tensile stress at break. Indeed, with well-chosen processing conditions, the weld ratio, defined as the tensile stress at break of the welded material divided by the tensile stress at break of the bulk one, can reach 0.97 for such pristine polymers [12].
However, this weld ratio decreases significantly with the addition of short glass fibers in the polymer matrix, down to ~0.5 for 30% glass fiber reinforced polymers [12]. The mechanisms explaining this drastic loss of mechanical properties for short-fiber composites during welding are not fully understood [13] and can have catastrophic consequences, for example when a backfire occurs in the air intake manifold [3]. The admitted reason for this relatively weak weld strength is that fibers are reoriented toward the vibration and the squeeze flows directions leaving little amount of fibers in the joining direction [14] (see Fig. 2 where joining direction is along the y-axis). Following this assumption, several authors studied the fiber orientation distribution in the heat affected zone to correlate it with the mechanical properties of the assembly. The study of Kamal et al. [15] actually indicates that the quantity of fibers lying in the joining direction, determined by optical microscopy, is slightly lower in the welded sample than in the non-welded ones for polyamide 6 reinforced with glass fibers initially oriented parallel to the joining direction. Dai and Bates [13] studied the mechanical properties of glass-fiber-reinforced polypropylene samples welded with initial fi-bers orientation in the joining direction and no significant improvement in the tensile stress at break was obtained. However, the possible reor-ientation of the fibers after welding was not characterized in this study. Fiebig and Sch€oppnner [16] also studied the influence of the initial fiber orientation on the weld strength for glass fiber reinforced PP and PA6. The orientation of the fibers inside the welds was assessed through low-resolution laboratory tomography but no significant correlation between the quantity of fibers in the joining direction and the tensile stress at break was found.
Thus, in this study we aim at a better understanding on how the addition of short fibers in a thermoplastic matrix impacts the loss of mechanical properties of welded assemblies. We systematically examine polyamide 66 reinforced with 30 wt% short glass fibers (named PA66-
GF30 in the following) injected plates with different welding configu-rations (initial fiber orientation and pressure). In order to assess re-lationships between microstructure and mechanical properties more quantitatively, we first investigate the impact of the welding process on tensile properties. Secondly, we explore microstructural changes asso-ciated to a given welding condition at different scales: crystallinity and molar mass changes of the matrix are evaluated through size-exclusion chromatography (SEC), differential scanning calorimetry (DSC) and coupled wide-angle and small-angle X-ray scattering (WAXS/SAXS). Finally, a three-dimensional in-depth study of the microstructure, taking advantage of high-resolution synchrotron-based X-ray micro-tomography is proposed. This technique, which has only been quite recently applied to the microstructural study of polymer composites [17] is, to the best of our knowledge, used for the first time here to characterize welded reinforced thermoplastics. The aim is to obtain quantitative information on fiber reorganization (both reorientation and agglomeration) and void nucleation [18,19] in order to evidence rele-vant structural parameters governing the tensile properties changes.
2. Experimental
2.1. Material and welding
PA66-GF30 with organic black dye was kindly supplied by BASF (Ultramid® A3WG6 bk20560). The main diameter of the fibers is 10 μm and the average aspect ratio is about 35, as given by the supplier. The pellets were injected at BASF R&D center (Ludwigshafen, Germany) in plates with dimension 150 � 150 � 3 mm. After injection, the plates were immediately stored in sealed hermetic bags. Prior to welding, water content was monitored with an Aquatrac® apparatus from Bra-bender Messtechnik® and always found to be below 0.01 wt%. Plates were butt-welded using a Branson vibration welding machine M 102H in BASF facilities. The frequency was set at 240 Hz, the amplitude was fixed at 1.8 mm and the meltdown depth was equal to 1.5 mm. Two different welding pressures were investigated, 1 MPa and 4 MPa.
In order to study the impact of the initial fiber orientation on the welding process, two different configurations were welded as illustrated in Fig. 1. The first configuration, which will be named transversely welded in the following (TW1, welded at 1 MPa and TW4, welded at 4 MPa), corresponds to the fiber orientation typically met in industrial parts. Indeed, during the injection process fibers always tend to orient themselves parallel to the mould edges that are going to be welded. The second configuration, longitudinally welded (LW1, welded at 1 MPa and LW4, welded at 4 MPa), is motivated by the investigation of the influ-ence of initial fiber orientation on weld quality.
As presented in Fig. 1, this second configuration allows fibers to cross the weld which is then expected to exhibit higher mechanical properties. Because of edge effects which tend to reorient fibers on mould borders during the injection process, it was not possible to weld molded edges with fibers initially oriented perpendicularly to the joining plane. Therefore, to obtain longitudinally welded samples, plates were cut in the middle and welded along this line. Non-welded samples with both configurations were also prepared for comparison.
2.2. Size exclusion chromatography
Weight average molecular weight Mw, number average molecular
weight Mn and dispersity defined as ĐM ¼Mw/Mn were obtained from size exclusion chromatography (SEC) on an Agilent Series 1100 appa-ratus (Agilent Technologies, Santa Clara, USA) according to the pro-cedure described in Ref. [20]. Briefly, 10 mg of the material from welded plates in the non-welded zone and in the weld flash for all the four welding configurations were dissolved in about 5 mL of HFiP (1,1,1,3,3, 3-hexafluoro-2-propanol) (Fluorochem Ltd., Derbyshire, Great Britain, used without any further distillation or drying process) during 24 h at ambient temperature. The obtained solution was filtrated on a 0.2 μm
thickness PTFE membrane to remove glass fibers and organic dye. The operating temperature was 35 �C and the calibration was made with poly(methyl methacrylate) (PMMA) standards from PSS GmbH, Mainz, Germany.
2.3. Crystallinity measurement
Differential Scanning Calorimetry (DSC) measurements were per-formed with a Q1000 from TA Instrument calibrated with Indium. Several layers having a thickness of 50 μm were taken from the plates (in
bulk and welded regions) using a LEICA microtome and stacked into non-hermetic aluminum pans to reach a total mass between 5 and 10 mg. Because PA66 absorbs water, the two-step drying procedure described in Ref. [21] was followed to remove water before the analysis. It consists in creating a pinhole inside the lid of the DSC can, leaving it a whole night in a vacuum stove at room temperature and finally adding a 2-min plateau at 50 �C (below the material’s glass temperature) before recording heat flow to remove any remaining quantity of water. The DSC analyses were performed under a nitrogen flow of 50 mL/min, by applying a temperature sweep from 30 �C to 300 �C at a rate of 10 �C/min. Two measurements were performed for each condition to ensure reproducibility. Crystallinity was calculated using the following relation:
χc¼
ΔHm
w � ΔHm0 (2)
with w the mass fraction of polymer in the composite, determined with the same samples as DSC using a thermogravimetric analyzer from TA Instrument TGA Q50 (w ¼ 31, 32, 35, 31 and 34 wt% respectively for non-welded and LW1, LW4, TW1 and TW4 samples in the weld zone, consistent with the supplier data sheet); ΔHm the measured melting
enthalpy, and ΔHm0 the melting enthalpy for a 100% crystalline PA66
sample, equal to 226 J/g [22]. The measured melting enthalpy was obtained by integrating the crystal’s fusion peak area of the heat flow curve from 200 �C to the end of the crystal’s fusion peak.
2.4. SAXS and WAXS measurements
Simultaneous Small and Wide-Angle X-ray Scattering (SAXS-WAXS) experiments were performed on a Xenocs Nano-inXider SW system in transmission mode using Cu Kα radiation (λ ¼ 1.54 Å) from an X-ray
microsource (GeniX3D) operating at 50 kV-0.6 mA (30 W).
To locate the points of interest, map acquisitions were carried along an 8 mm line about 400 μm from the edge of the sample, crossing the
welded area, with a small collimation of 200 μm and a step of 300 μm.
After identification of the welded area (identified by a lower X-ray transmission, see below), SAXS-WAXS images covering an azimuth angle ψ greater than 90�were recorded in the welded area and 1 mm away from this area (i.e. outside the welding zone).
Scattering patterns were collected using the combination of two detectors Pilatus3 (Dectris) operating simultaneously in SAXS and WAXS positions allowing a continuous q range between 0.01 Å 1 and 4.2 Å 1 (2θ range between 0.15�and 62�). The corrected 2D data were azimuthally integrated using Foxtrot software [23]. After subtraction of blank (spectra without sample), the SAXS and WAXS profiles are treated to extract structural quantitative values. The scattering vector q is defined as q ¼ 4πsinθλ and 2θ is the Bragg angle. The long period of the
crystalline lamellae organization, LP, is deduced from the position of the
maximum of the Lorentz-corrected SAXS intensity profiles, LP ¼q2π
max.
The WAXS spectrum is decomposed into crystalline and amorphous contributions, using the Fityk 0.9.8 software [24] in a wide 2θ range between 5� and 60�. The crystalline peaks are associated with sharp peaks, located at the Bragg angle 2θhkl, while amorphous halo is fitted by broad peaks. The crystalline structure is identified according to the position of the Bragg peaks, and according to their intensity the weight crystallinity of the composites (not dissociating matrix and fibers) χmc
can be estimated as follows:
χm c¼
Ac
AcþAa (3)
in which Ac and Aa are the areas under fitted crystalline peaks and
amorphous halos, respectively. 2.5. Tensile tests
As previously stated, PA66 is a hydrophilic polymer and water up-take is known to modify its mechanical properties [25], so samples were all dried before tensile testing. The drying procedure consists in leaving the specimens in a stove for 10 days at 80 �C, based on ISO 1110:1995 (E). Mass measurements were performed during drying to make sure that the mass sample reaches a plateau.
The main solicitations in air-intake manifolds when in use in vehicles are backfires, i.e. an inflammation of the air-gasoline mixture outside of the engine cylinders. In the automotive industry, this explosion is known to create a pressure rise of approximately 10 bars in 10 ms inside the part. As polymers are viscoelastic materials, their mechanical response depends on the strain rate. Thus, an estimation of the backfire velocity was calculated in order to evaluate the impact of the strain rate. The hoop stress σhoop generated in the jacket of a cylinder (which is, as a first approximation, the shape of the air-intake manifold) can be estimated using Barlow’s formula [26]:
σhoopffi
p � r
t (4)
with p being the explosion pressure, r the cylinder radius and t the thickness of the jacket. Considering the air-intake manifold is made of cylinders with radii equal to 30 mm and a thickness of 3 mm, the hoop stress is then equal to 10 MPa. Finally, assuming purely elastic defor-mation, the strain rate ?_ is equal to: _ε¼ΔεΔt¼ σE
Δt with Δt, the time to
pressurization and E the Young’s modulus. Thus, the strain rate during backfire is close to 10 1 s 1. In consequence, tensile tests were then performed at 10 4 s 1 to evaluate quasi-static properties and at 10 1 s 1 to study conditions similar to backfire.
The geometry of the specimens corresponds to ISO527-5A standard with a thickness of 3 mm. Six dumbbell-shaped samples were machined from each welded and non-welded plate with the help of a numerical controlled drill on positions illustrated in Fig. 1 for welded samples. As Fig. 2. Typical microtomography images of the four samples showing the images analyses different regions. For clarity, the fiber analysis subvolumes are represented only for LW1, since they were positioned at the same (x,y) spots for all samples.
the material is expected to be anisotropic (because of injection induced fiber orientation), tensile tests were performed in longitudinal and transversal direction regarding the injection flow for non-welded plates. The tensile tests were performed at room temperature on an Instron machine model 5966 equipped with a 10 kN load cell and a video- extensometer detecting the displacement (ΔL) between the two white dots which were drawn on each part of the weld with a 1-cm spacing distance (L0). The engineering strain and stress were obtained respec-tively using the relations ε ¼ΔL
L0 , and σ ¼SF0 with F the force applied and
S0 the initial section of the samples (which was measured for each sample and is approximately equal to 12 mm2).
2.6. High-resolution synchrotron-based X-ray microtomography
X-ray microtomography was performed at SOLEIL Synchrotron on the Anatomix beamline [27]. The beam energy was set to 16 keV. The voxel edge size was 0.65 μm. A total of 2000 projections per scan was
recorded during a 180�rotation lasting around 7 min 50 pictures taken before and after sample acquisition were used for the reconstruction of scanned volumes. A Paganin filter was applied during the reconstruction of the volumes in order to reduce the phase contrast at the fiber – matrix interface. The field of vision corresponding to this resolution was 1.3 mm so three scans were performed in vicinity zones and pasted together to get an analysis of each specimen in the whole thickness plate (equal to 3 mm).
Fig. 2 shows a representative image of the total volume obtained for all the four welding configurations. A skin-shell-core effect [16], induced by the injection molding process, is visible along the thickness of molded plates for both LW1 and LW4 samples but not on transversely welded samples (TW1 and TW4) because the shell-core effect is not present on the edges of the plates where welding was performed (see Fig. 1). The color lines indicate the position of the welded zone and weld flash is visible at both extremities of the plates. In Fig. 2, fiber reor-ientation and void presence (darker regions) in the welded zone are observed (as illustrated for the LW1 sample). To compare these phe-nomena on each welding configuration, standard procedures were defined and are detailed in the next sections.
Concerning the fiber reorientation, image analysis was performed with the use of Xfiber® extension in Avizo® Software [28] on 20 sub-volumes for each of the four different welding configurations. Their size was set at 500 μm � 50 μm x 500 μm and they were centered at 750 μm
from the edge throughout the weld, as illustrated in Fig. 2, in order to evaluate the difference in microstructures between bulk and welded zones.
The Xfiber® algorithm gives the orientation angles (θ and ϕ) of each fiber in spherical coordinates. From these values, following the method proposed by Advani and Tucker [29], the diagonal terms of fiber orientation tensors (axx, ayy, azz) were calculated for each subvolume in
each analyzed sample as follows:
axx¼<sin2θ � cos2ϕ > (5)
ayy¼<sin2θ � sin2ϕ > (6)
azz¼ <cos2θ > (7)
Concerning the void analysis, the chosen representative volume was set to 2400–2800 μm � 1330 μm x 325 μm. As illustrated on Fig. 2, the
first dimension of the void analysis subvolume varies because the plates get misaligned during the welding operation, especially when a high welding pressure is applied. The image analysis was performed with Fiji® software and consists in thresholding the pictures to isolate cav-ities, darker than fibers and polymer matrix, in order to get the average void volume fraction in the analyzed volumes for each welding config-uration. The 3D-visualization was performed using a Pymicro python open source package [30].
3. Results and discussion
3.1. Tensile properties
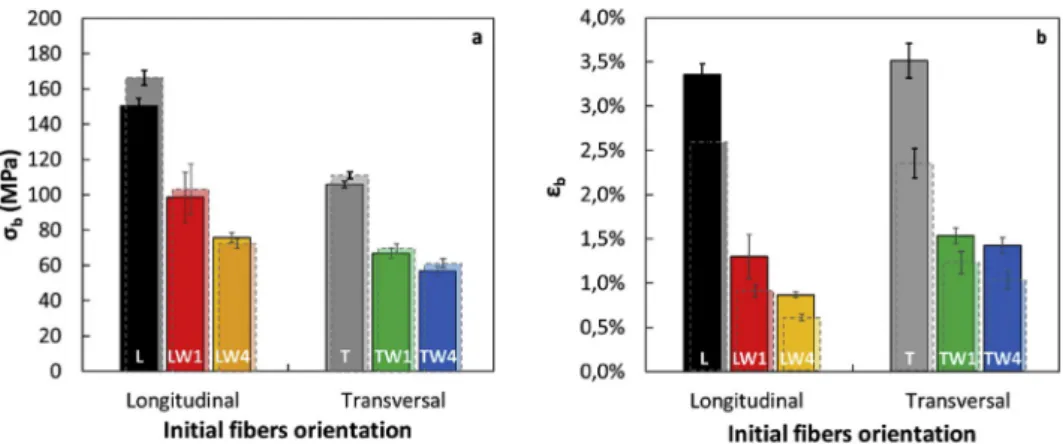
Representative stress-strain curves up to sample failure are shown in Fig. 3 for bulk material and different welding configurations at 10 4 s 1 (a) and 10 1 s 1 (b). Average values of engineering stress σb (a) and strain (b) at break εb with standard deviations are plotted in Fig. 4. Results indicate that the bulk material displays an anisotropic response when deformed. It is less rigid in the transverse direction because of the fiber orientation induced by the injection process. For the same reason, the tensile stress at break is lower and the strain at break is higher when the material is tested in the transverse direction; however, it appears that εb is a strain-rate-dependent property since for a higher strain rate a lower strain at break is evidenced in the longitudinal direction.
Concerning welded samples, results are in good agreement with previous reports [3] as welded materials have a significantly lower stress and strain at break than corresponding bulk materials. As expected, welding pressure is an important parameter to achieve efficient bonds. Fixing welding pressure at a low value leads to significantly higher stress and strain at break (see Fig. 4).
Concerning the initial orientation of the fibers, results indicate that the configuration with fibers being mainly oriented in the joining di-rection leads to samples having a higher stress at break, especially when welded at low pressure. This is consistent with the fact that high pressure further reorients the fibers, thus the impact of the initially favorable fiber orientation is lost. Similar trends were observed for the tensile tests performed at high strain rate (see Fig. 3-b and Fig. 4). Fig. 4 also in-dicates that the stress and strain at break are respectively higher and lower at higher strain rate, again in agreement with previously reported results [25].
To evaluate the efficiency of the welding operation, the weld ratio is presented in Table 1. Results confirm that, contrary to pristine polymers where weld ratio close to 1 can rather easily be obtained, welding of fiber reinforced polymers is much less efficient as all weld ratio vary between 0.5 and 0.65 [12].
3.2. Matrix characterization in the weld zone
Table 2 displays the molecular weights of non-welded and welded PA66-GF30, for all conditions. Results show it slightly increases after the welding operation. This is attributed to post-polycondensation which occurs when dry PA66 is heated above its melting temperature [31].
Samples welded at low pressure exhibit even higher molecular weight as the welding operation is longer than for high pressure welds. In addition, longitudinally welded samples also have slightly higher molecular weight than transversely welded ones. This difference can be explained by a higher apparent viscosity when fibers are initially ori-ented perpendicularly to the squeeze flow: as the viscosity is higher, the temperature in the molten layer is higher [32] which leads to a higher molecular weight. The molecular weight variation can reach 20% for longitudinally welded samples at 1 MPa over non-welded ones. Note that the measurements were made in the weld flash, i.e. the zone where the matrix has been submitted to the most drastic thermal events, which means the results obtained may slightly overestimate the molecular weight in the weld. However, this phenomenon should not directly explain the loss of mechanical properties as higher molecular weight is expected to be associated with higher tensile stress at break [33].
Knowing the polymer is thus melted, reoriented and recrystallized locally while the chain length increases, crystalline structure may be significantly modified compared to the non-welded bulk. In conse-quence, DSC characterizations of the welded zones were performed. Typical heat flow curves for non-welded PA66-GF30 and all the different welded configuration are shown in Fig. 5. The curves exhibit two melting temperatures of crystals at approximately 252 �C and 261 �C for all samples with peaks of similar shapes. These two melting
temperatures are the signature of the PA66 α triclinic structure, and can
be either attributed to a double peak of the α1 phase, or to the joint presence of α1 and α2 phases which are two distortions of the triclinic structure [34]. A crystallinity ratio close to 33% was obtained for all samples. No significant changes in crystallinity and crystal morphology can be evidenced for welded samples from the DSC measurements.
SAXS-WAXS mapping experiments were performed on the LW1 and TW1 samples to localize the welded zone. The welded zones display a lower X-ray transmission, probably due to a slightly higher
Fig. 3. Stress-strain curves at engineering strain rate of a) 10 4 s 1; b) 10 1 s 1.
Fig. 4. Average values of stress and strain at break for both engineering strain rates: 10 4 s 1 (full bars) and 10 1 s 1 (dashed bars). Table 1
Weld ratios of different welding configurations.
Samples σb ðweldedÞ
σb ðnon weldedÞ at 10
4 s1 σb ðweldedÞ
σb ðnon weldedÞ at 10 1 s 1 Longitudinally welded at 1 MPa (LW1) 0.65 0.62
Longitudinally welded at 4 MPa (LW4) 0.50 0.44 Transversely welded at 1 MPa (TW1) 0.63 0.63 Transversely welded at 4 MPa (TW4) 0.54 0.55
Table 2
Weight average molar mass and dispersity of PA66-GF30 in the bulk and welded zones.
Samples Mw (kg/mol) ĐM
PA66 GF30 non-welded 77 2.6 PA66 GF30 transversely welded at 1 MPa 84.6 2.8 PA66 GF30 transversely welded at 4 MPa 79.4 2.6 PA66 GF30 longitudinally welded at 1 MPa 92.5 3.0 PA66 GF30 longitudinally welded at 4 MPa 82.8 2.7
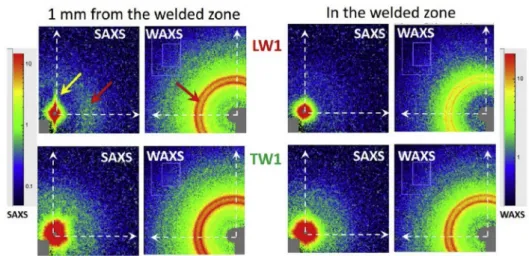
concentration of glass fibers in this zone (see the tomography analysis below). SAXS-WAXS images recorded in the weld zone and 1 mm far from this zone are reported in Fig. 6 for an azimuthal angle ψ higher
than 90�.
On SAXS pattern, we observed intense scattering at low q (<0.02 Å 1, yellow arrow) due to glass fibers and fillers and a relatively isotropic broad halo (red arrow) associated with the crystalline lamellae periodic organization of PA66. On WAXS patterns, isotropic rings (red
arrow) are associated to the crystalline peaks of PA66.
It confirms DSC measurements that PA66 crystallizes primarily in the
α triclinic structure [35], with a crystalline perfection around 0.85 (1.0
for the perfect crystal) [36] in all samples, inside or outside the weld. The crystalline lamellae are periodically organized with a period of about 75 Å.
For LW1, far from the welded zone, we observed a well-defined orientation of the glass fibers and a slight orientation of the crystalline Fig. 6. SAXS-WAXS experiments on the LW1 (top) and TW1 (bottom) samples, at 1 mm far from the welded zone (left) and in the welded zone (right). q range is from 0,005 to 0,16 Å 1 and from 0,3 to 3,1 Å 1 for SAXS and WAXS picture respectively.
lamellae with PA66 chains parallel to the glass fibers. The weight crystallinity of the composite (i.e. taking into account both matrix and glass fibers) is close to 18%. In the weld zone, the crystallinity of the composite slightly decreases to 16%, probably due to a slightly higher amount of glass fibers. In this area, the glass fibers do not display specific orientation leading to a small and isotropic scattering.
For TW1, whatever the zone, glass fibers induce an intense and isotropic scattering due to the main orientation of the glass fibers being parallel to the X-ray beam. The composite crystallinity is 21% in the welded zone and 20% outside. As the amount of glass fiber is higher in the welded area, the PA66 crystallinity may then be slightly increased by the welding.
These results corroborate the DSC measurements, indicating that the crystalline structure of the matrix is, contrary to what is observed for pristine polymers, not drastically modified in the weld zone compared to the bulk [8,9].
3.3. Three dimensional microstructural analysis
Usually, fiber orientations in composites are assessed by analyzing prepared surfaces using Scanning Electron Microscopy (SEM) [15,37]. This approach is based on the simple 2D Scanning Electron Microscope image where angle orientation is calculated from ellipse mark. However, because of polishing steps, this technique becomes very fastidious when the number of 2D images to analyze increases and it is difficult to assess the localization of the plan imaged with a very good accuracy. Thus, in order to characterize the fiber orientation and distribution locally, 3D observation tools such as X-ray microtomography appear to be better candidates since they give high spatial resolution and good density contrast between glass fibers and polymer [38].
Fig. 7 shows images taken from microtomography volumes in the (yz) plan at 750 μm away from the edge. The welding zone can easily be
identified due to fiber reorientation mainly in the x direction (note also the presence of voids for example in the LW1 welded zone). It is shown
in the interrupted lines on the pictures.
As seen in Fig. 2, the thickness of this zone varies across the x-axis, the maximum thickness being located near the sample surface. Note also that the shape of the welded zones exhibits a symmetry around the z- axis. Since all the four pictures of Fig. 7 are taken at the same x-value, it is possible to compare the relative thickness of the welded zone ac-cording to different welding configurations. Results obtained are consistent with equation (1) [6] which states that the heat affected thickness is proportional to the viscosity and inversely proportional to the pressure. Low pressure welded samples indeed exhibit higher wel-ded zone thickness and longitudinally welwel-ded samples which have a higher apparent viscosity (because of fibers preventing the flow) also exhibit higher heat-affected zone thicknesses. It is important to note that there is a difference between the molten film thickness h0 which is formed during the welding operation, and the height of the heat-affected zone visible in the microstructure of welded samples. When the preset value of the penetration is reached, vibration is stopped to ensure the cooling of the interphase, but the pressure is maintained. Thus, there is an overshoot of the target penetration caused by some molten material flowing out of the lateral surface.
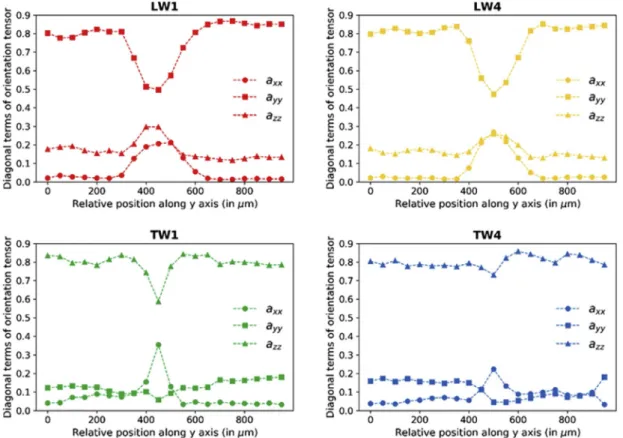
Concerning the fibers orientation, Fig. 8 shows the evolution of the diagonal component of the orientation tensors (axx, ayy, azz) towards the welded zone. Each point stands for the average main components of fiber orientation tensors calculated for the 20 different subvolumes containing each 200 to 400 fibers, for all welding conditions (as described in Fig. 2). Results indicate that outside the weld, fibers are mainly oriented in the y direction for longitudinally welded plates and in the z direction for transversely welded samples. These orientations correspond to the injection flow direction for these plates respectively. This is consistent as the subvolumes were taken from the shell zone of the plates. In addition, for longitudinally welded samples, fibers are reoriented in the weld zone due to vibration and squeeze flows which are respectively oriented in z and x directions. Therefore, when crossing the weld zone, ayy decreases in favour of azz and axx. For transversely
welded samples, fibers only get reoriented toward x-axis (squeeze flow direction) to the detriment of the vibration direction (z-axis). In this case, ayy is small in both welded zone and base material. It can be concluded that the welded zones contain more fibers oriented in the xz plane (i.e. perpendicular to the tensile direction) than the bulk. For LW the amount of fibers in x and z directions is the same whereas most of fibers remain in the z-direction for TW samples. Additionally, increasing the pressure enhances these effects. Finally, it can be noted that the weld zone thickness may also be estimated with this analysis and that within the uncertainty related to the sampling size of the subvolumes (50 μm in
the y direction), results are consistent with what is obtained from Fig. 7. Fig. 9 displays the volume fiber fraction inside the 20 subvolumes of each welding configuration. Assuming a typical density for glass fibers of 2.5 g/cm3 and 1.13 g/cm3 for PA66 (from BASF datasheet), the values obtained are consistent with the values obtained from TGA measure-ments both in the welded zone and in the bulk regions (see black lines in Fig. 9). The slight underestimate is attributed to the breakage of some fibers during the injection process or during the first stage of welding (solid friction) [5] which are, in consequence, not recognized by the Xfiber® extension. Results suggest that fiber agglomeration occurs significantly in the welded zone for longitudinally welded samples but is not so apparent for transversely welded ones within the resolution of our analysis. An increase in the volume fiber fraction means that in the welded volume the inter-fibers distance is decreasing. Transverse ten-sion in this configuration could have a detrimental effect on the local failure mechanisms. As already mentioned for the fibers reorientation, increasing the welding pressure results in increasing the fiber volume fraction.
Note that the same analysis was conducted in the middle of the plates (1.5 mm from the edge) and yields results consistent with those pre-sented above in Figs. 8 and 9.
Fig. 10 finally shows the distribution of voids in the whole welding bed obtained from microtomography measurements. First, it appears that voids are located essentially within this welded zone, mostly at the
interface between the base and the welded material. They can be attributed to fiber-matrix debonding during cooling of the weld zone. Thus, let us note that the welded-zone thickness can also be estimated from Fig. 10 and is consistent with values presented in Fig. 7. The typical cavity volume in the welded regions is ≲ 1000 μm3.
Then, the void fraction is higher in the longitudinally welded sam-ples. This may be due to the strong fiber reorientation occurring in this welding configuration, which will be discussed in detail below. Espe-cially for LW1, the void volume fraction is typically one order of magnitude higher than for all other samples. For this sample, a few cavities with volumes higher than 10,000 μm3 can be observed,
espe-cially in the thicker regions of the welded zone where fiber reorientation is less pronounced, and constitute a large part of the void volume frac-tion measured. The origin of these larger cavities is uncertain: it may be due to low pressure and a difference in the sampling preparation, since longitudinally welded samples have been welded on cut sides which display slightly rougher surfaces than molded sides. However, the typical root mean square roughness Rq, as measured by profilometry, is 3 μm for cut sides versus 1.5 μm for molded sides which is in both cases
negligible when compared to the meltdown depth and welded-zone thickness. It may then be attributed to melt fracture [10]. It is worth noting that despite these voids, the LW1 welding configuration exhibits the higher tensile stress at break.
To conclude, attempts were made to link microstructure quantifi-cations (namely ayy min, the welded zone thickness and the maximum local fibers density inside the weld zone) and mechanical properties at failure (σb and εb at a strain rate of 10 4 s 1), based on these X-ray microtomography observations of the welded zones microstructure. It should be reminded that failure of the welded specimens always occurred within these welded zones.
In Fig. 11-a and d, σb and εb are plotted with respect to ayy min. While
the strain at break does not correlate with ayy min, there is a clear link between the stress at break and the average value of ayy. The fiber reorientation perpendicular to the load direction (the lower ayy min the
more fibers oriented in the xz plane) plays a role in the drop of the stress at break.
Fig. 11-b and e indeed depicts σb and εb for each welding configu-ration as a function of the corresponding welded zone thickness. A nice correlation is obtained for the stress at break whereas the correlation is poor for the strain at break.
The stress at break regarding the maximum local fibers density can be seen in Fig. 11-c. Results indicate that longitudinal and transversal PA66-GF30 have a very different stress at break, whether welded or non- welded, but no clear trend as a function of the fiber density can be evidenced. However, Fig. 11-f shows a sharp decrease in the strain at
break as the maximum local fiber density increases.
To summarize the main results that can be extracted from Fig. 11: - fiber reorientation perpendicularly to the load direction together with a decrease in the thickness of the welded zone tend to alter the stress at break;
- an increase in the local fiber density in the welded zone induces a low strain at break.
The bulk transversal sample still exhibits higher tensile stress and strain at break than all the welded samples although it contains less Fig. 10. Visualization of voids distribution inside analyzed volumes for all different welding conditions.
fibers oriented in the tensile direction (y-axis). If we bear in mind that the transversally welded samples display only low levels of reorientation of fibers initially along the y-axis (see Fig. 8) but nonetheless present a poor weld ratio (and that this configuration is the only one encountered in industrial parts), this confirms that fiber reorientation in a plan perpendicular to the load is not the only factor explaining the poor weld ratio obtained for welded glass-fiber-reinforced thermoplastics.
To achieve efficient assembly of reinforced thermoplastics by vi-bration welding operations, a usual strategy in the industry is to apply a low pressure and to work with polymers that exhibit a high melt vis-cosity (see equation (1)), which will create a large welded-zone thickness.
However, these processing conditions also tend to favour the appearance of voids (see Fig. 10), due to fiber reorientation parallel to the transverse direction, which sets a stress triaxiality within the weld zone [39]. Though, at first, these voids or cavities do not appear to be detrimental to the mechanical properties at both low and high strain rate (the LW1 sample having the best mechanical properties despite showing the highest quantity of cavities), they may still be responsible for the poor weld ratio by acting as nucleating sites for fracture propagation even at low volume fraction, as suggested in recent studies [38]. Indeed, this stress/strain state favours either the nucleation of voids from the spherulitic microstructure [40,41] or the growth of nano-voids trapped between two parallel fibers subjected to transverse tensile load. Micro-cracks appear then from the coalescence of these grown nano-voids. These voids can have an impact on the fatigue properties, as was demonstrated for non-welded reinforced composites [42]. The role of the cavities in the damage mechanisms and fatigue properties of welded reinforced thermoplastics will be the scope of future studies.
4. Conclusions
In-depth microstructural analyses have been conducted on welded glass-fiber-reinforced polyamide 66, in order to get a better under-standing of the mechanisms responsible for the drastic loss of mechan-ical properties. The matrix exhibits a minor increase in chain length due to post-polycondensation during the welding operation. Both DSC and X-ray scattering show that welding does not lead to significant changes in polymer crystallinity (both in terms of crystalline phases and crys-talline ratio). The weld zone was then characterized via synchrotron X- ray microtomography.
Correlations were found between the stress at break and the minimum-value-component orientation tensor in the joining direction and the thickness of the weld zone, while it appears that an increase of fiber density within the weld is related to a decrease in the strain at break.
Contrary to the study of Dai and Bates [13] and Fiebig and Schoeppner [16] that did not find a significant increase of mechanical properties when glass fibers where initially oriented in the joining di-rection (prior to welding), our study reveals that this strategy allows higher stress at break values of welded samples for PA66-GF30 espe-cially for low welding pressure, despite a strong fiber reorientation effect and the appearance of a relatively large amount of voids.
To conclude, fiber orientation is playing an important role in the decrease of the tensile stress at break of welded specimens, but high- resolution X-ray tomography shows clearly it shall not be considered as the only reason. Welding in glass fiber reinforced polymers is a multifactor problem and a better understanding of the microstructural reorganization in the welded zone should offer new strategies to improve the welding process. We believe that efforts must be focused on inter-fibers and voids aspect ratio analysis in the welded zone, along with deeper analysis of mechanical properties, for example with the help of digital image correlation.
Data availability
The raw/processed data required to reproduce these findings cannot be shared at this time as the data also forms part of an ongoing study.
Declaration of competing interest
The authors declare that they have no known competing financial interests or personal relationships that could have appeared to influence the work reported in this paper.
Acknowledgements
The authors are grateful to SOLEIL selection committee (Proposal number: 20180023) which allow them to perform microtomography analysis on their samples. We also want to thank all the scientific staff from ANATOMIX beamline, in particular Timm Weitkamp. ANATOMIX is an Equipment of Excellence (EQUIPEX) funded by the Investments for the Future program of the French National Research Agency (ANR), project NanoimagesX, grant no. ANR-11-EQPX-0031. The acquisition of these images was also possible thanks to the precious help of Henry Proudhon. We also thank Marc Cognet, Stefan Mochev and their col-leagues from BASF for providing welded samples. Nicolas Longi�eras of PeakExpert is acknowledged for performing the SEC of the studied materials, and Simon Lottier for the profilometry measurements. Sylvie Tenc�e-Girault’s contribution was achieved within the framework of the Industrial Chair Arkema (Arkema/CNRS-ENSAM-CNAM). Finally, we want to thank the ANRT for subsiding this PhD program (N� 2016/ 1216). Dr Sylvie Kleiman-Lafon, Maître de Conf�erences in English literature at University Paris 8 is acknowledged for her careful reading of the manuscript.
References
[1] American Chemistry Council, Implementing Plastic and Polymer Composite
Lightweighting Solutions to Meet 2025 Corporate Average Fuel Economy
Standards, 2015.
[2] V.A. Kagan, Joining of nylon based plastic component - benefits of vibration and
hot plate welding technologies, J. Inject. Molding Technol. 4 (2000) 8.
[3] P.J. Bates, J.C. Mah, X.P. Zou, C.Y. Wang, B. Baylis, Vibration welding air intake
manifolds from reinforced nylon 66, nylon 6 and polypropylene, Composites Part A
35 (2004) 1107–1116.
[4] B. Patham, P.H. Foss, Thermoplastic vibration welding: review of process
phenomenology and processing-structure-property interrelationships, Polym. Eng.
Sci. 51 (1) (2011) 1–22.
[5] V.K. Stokes, Vibration welding of thermoplastics. Part I:Phenomenology of the
welding process, Polym. Eng. Sci. 28 (11) (1988) 718–727.
[6] V.K. Stokes, Vibration welding of thermoplastics. Part II: analysis of the welding
process, Polym. Eng. Sci. 28 (11) (1988) 728–739.
[7] L. Lin, A.K. Schlarb, Vibration welding of polypropylene-based nanocomposites -
the crucial stage for the weld quality, Composites Part B 68 (2015) 193–199.
[8] Y.M. Chung, M.R. Kamal, Morphology of PA-6 vibration welded joints and its effect
on weld strength, Polym. Eng. Sci. 48 (2) (2008) 240–248.
[9] E. Schmachtenberg, C. Tüchert, Long-term properties of butt-welded poly
(propylene), Macromol. Mater. Eng. 288 (2003) 291–300.
[10] A.K. Schlarb, G.W. Ehrenstein, The impact strength of butt welded vibration welds
related to microstructure and welding history, Polym. Eng. Sci. 29 (23) (1989)
1677–1683.
[11] M. Albrecht, L. Lin, A.K. Schlarb, Experimental investigation, modeling and
simulation of the deformation behavior of vibration welded nanocomposites,
J. Plast. Technol. 12 (2016) 185–204.
[12] V.A. Kagan, C. Roth, The effects of weld geometry and glass-fiber orientation on
the mechanical performance of joints - Part I: weld design issue, J. Reinforc. Plast.
Compos. 23 (16) (2004) 167–175.
[13] X.Y. Dai, P.J. Bates, Mechanical properties of vibration welded short- and long-
glass-fiber-reinforced polypropylene, Composites Part A 39 (2008) 1159–1166.
[14] V.A. Kagan, C. Roth, The effects of weld geometry and glass fiber orientation on the
mechanical performance of joints - Part II: kinetics of glass fiber orientation and
mechanical performance, J. Reinforc. Plast. Compos. 23 (16) (2004) 1687–1694.
[15] M.R. Kamal, Y.M. Chung, R. Gomez, Three-dimensional fiber orientation in
vibration welded joints of glass fiber reinforced polyamide-6, Polym. Compos. 29
(9) (2008) 954–963.
[16] I. Fiebig, V. Sch€oppner, Influence of the initial fiber orientation on the weld
strength in welding of glass fiber reinforced thermoplastic, Int. J. Polym. Sci.
[17] S.C. Garcea, Y. Wang, P.J. Withers, X-ray computed tomography of polymer
composites, Compos. Sci. Technol. 156 (2018) 305–319.
[18] N. Selles, F. Nguyen, T.F. Morgeneyer, H. Proudhon, W. Ludwig,
L. Laiarinandrasana, Comparison of voiding mechanisms in semi-crystalline
polyamide 6 during tensile and creep tests, Polym. Test. 49 (2016) 137–146.
[19] P.-A. Poulet, G. Hochstetter, A. King, H. Proudhon, S. Joann�es, L. Laiarinandrasana,
Observations by in situ X-ray synchrotron computed tomography of the microstructural evolution of semi-crystalline polyamide 11 during deformation,
Polym. Test. 56 (2016) 245–260.
[20] S. Laun, H. Pasch, N. Longi�eras, C. Degoulet, Molar mass analysis of polyamides-11
and -12 by size exclusion chromatography in HFiP, Polymer 49 (2008) 4502–4509.
[21] Y.P. Khanna, W.P. Kuhn, Measurement of crystalline index in nylons by DSC:
complexities and recommendations, J. Polym. Sci. B Polym. Phys. 35 (1997)
2219–2231.
[22] Blaind RB. Polymer Heats of Fusion. Thermal Applications Note, TA Instruments. [23] As of June 2019, the Software Can Be Obtained by Sending a Mail to foxtrot@
xenocs.Com. Software Is Free for Non-profit Usage, Directly Useable with Nexus and ESRF 2D Data Format.
[24] M. Wojdyr, Fityk: a general-purpose peak fitting program, J. Appl. Crystallogr. 43
(2010) 1126–1128.
[25] M.F. Arif, F. Meraghni, Y. Chemisky, N. Despringre, G. Robert, In situ damage
mechanisms investigation of PA66/GF30 composite: effect of relative humidity,
Composites Part B 58 (2014) 487–495.
[26] P. Barlow, Hydrostatic presses and water pipes, in: A Treatise on the Strength of
Materials, sixth ed., Lockwood & Co, London, England, 1867, pp. 117–120.
[27] T. Weitkamp, M. Scheel, J.L. Giorgetta, V. Joyet, V. Le Roux, G. Cauchon,
T. Moreno, F. Polack, A. Thompson, J.P. Samama, The tomography beamline
ANATOMIX at Synchrotron SOLEIL, J. Phys. Conf. 849 (1) (2017), 012037.
[28] R. Blanc, P. Westenberger, Comparison of riber orientation analysis methods in
Avizo, in: 7th Conference on Industrial Computed Tomography, Leuven, Belgium, 2017.
[29] S.G. Advani, C.L. Tucker, The use of tensors to describe and predict fiber
orientation in short fiber composites, J. Rheol. 31 (8) (1987) 751–784.
[30] H. Proudhon. https://github.com/heprom/pymicro.
[31] R. Griskey, B. Lee, Thermally induced solid-state polymerisation in nylon 66,
J. Appl. Polym. Sci. 10 (1966) 105–111.
[32] P.J. Bates, J. MacDonald, V. Sidiropoulos, M. Kontopoulou, Comparison of
experimental and analytical vibration welding meltdown-time profiles for nylon 66
and polypropylene, Polym. Eng. Sci. 45 (6) (2005) 789–797.
[33] P.Y. Le Gac, B. Fayolle, Impact of fillers (short glass fibers and rubber) on the
hydrolysis-induced embrittlement of polyamide 6.6, Compos. B Eng. 153 (2018)
256–263.
[34] H.W. Starkweather, P. Zoller, G.A. Jones, The heat of fusion of 66 nylon, J. Polym.
Sci. Polym. Phys. Ed 22 (1984) 1615–1621.
[35] C.W. Bunn, E.V. Garner, The crystal structures of two polyamides (’nylons’), Proc.
Roy. Soc. Lond. Math. Phys. Sci. 189 (1016) (1947) 39–68.
[36] N.S. Murthy, H. Minor, R.A. Latif, Effect of annealing on the structure and
morphology of nylon 6 fibers, J. Macromol. Sci., Part B Physics 26 (4) (1987)
427–446.
[37] G. R�egnier, D. Dray, E. Jourdain, S. Le Roux, F.M. Schmidt, A simplified method to
determine the 3D orientation of an injection molded fiber-filled polymer, Polym.
Eng. Sci. 48 (11) (2008) 2159–2168.
[38] H. Rolland, N. Saintier, G. Robert, Damage mechanisms in short glass fibre
reinforced thermoplastic during in situ microtomography tensile tests, Composites
Part B 90 (2016) 365–377.
[39] A. Dorfmann, K.N.G. Fuller, R.W. Ogden, Shear, compressive and dilatational
response of rubberlike solids subject to cavitation damage, Int. J. Solid Struct. 39
(2002) 1845–1861.
[40] N. Selles, P. Cloetens, P. Proudhon, T.F. Morgeneyer, O. Klinkova, N. Saintier,
L. Laiarinandrasana, Voiding mechanisms in deformed polyamide 6 observed at the
nanometric scale, Macromolecules 50 (11) (2017) 4372–4383.
[41] I. Raphael, N. Saintier, G. Robert, J. B�ega, L. Laiarinandrasana, On the role of the
spherulitic microstructure in fatigue damage of pure polymer and glass-fiber
reinforced semi-crystalline polyamide 6.6, Int. J. Fatig. 126 (2019) 44–54.
[42] H. Rolland, N. Saintier, I. Rapha€el, N. Lenoir, A. King, G. Robert, Fatigue damage
mechanisms of short fiber reinforced PA66 as observed by in-situ synchrotron X-


![Travaux des doctorants du CRISCO 2010-2011 [vol. 2]](data:image/gif;base64,R0lGODlhAQABAIAAAP///wAAACH5BAEAAAAALAAAAAABAAEAAAICRAEAOw==)