HAL Id: hal-00541089
https://hal-mines-paristech.archives-ouvertes.fr/hal-00541089
Submitted on 5 Jun 2013HAL is a multi-disciplinary open access archive for the deposit and dissemination of sci-entific research documents, whether they are pub-lished or not. The documents may come from teaching and research institutions in France or abroad, or from public or private research centers.
L’archive ouverte pluridisciplinaire HAL, est destinée au dépôt et à la diffusion de documents scientifiques de niveau recherche, publiés ou non, émanant des établissements d’enseignement et de recherche français ou étrangers, des laboratoires publics ou privés.
Mixed mode ductile fracture of an anisotropic 2024
Al-Cu alloy
Yazid Madi, Jacques Besson, Franck Tankoua, Jianqiang Chen, Naman Recho
To cite this version:
Yazid Madi, Jacques Besson, Franck Tankoua, Jianqiang Chen, Naman Recho. Mixed mode ductile fracture of an anisotropic 2024 Al-Cu alloy. Fracture of materials and structures from micro to macro scale - ECF 18, Aug 2010, Dresden, Germany. 8 p. �hal-00541089�
Mixed-mode ductile fracture of an anisotropic 2024 Al-Cu Alloy
Yazid MADI1,2, Jacques BESSON2
, Franck TANKOUA1,2, Jianqiang CHEN2
, Naman RECHO1 1
Ermess EPF-Ecole d’Ingénieurs 3 bis rue Lakanal 92330 Sceaux
France yazid.madi@epf.fr
2
Centre des Matériaux Mines ParisTech, UMR CNRS 7633
BP 87, 91003 Evry Cedex, France jacques.besson@ensmp.fr
Abstract: Assessment of structural integrity of structures often requires investigating the combination of tensile
(Mode I) and shearing (Mode II) or tearing (Mode III) loadings. The purpose of this study is to shed some light on the ductile mixed-mode fracture process and its underlying mechanics. Ductile rupture of a 2024 Al Alloy thin sheet is investigated under mode loading. Mechanical tests are carried out on smooth and specific mixed-mode Arcan specimens. Test data on smooth samples are used to identify the parameters of constitutive equations describing plastic anisotropy. Digital image correlation (DIC) technique is used to measure the local displacement in the vicinity of the V-notch. Using these measurements an analysis of the effect of mixed-mode loading on ductile crack initiation is performed. Failure mechanisms are investigated using scanning electron microscope (SEM). Results are finally interpreted and modeled using a simple local approach based on the Rice and Tracey criterion.
Key–Words: Mixed mode, ductile rupture, Rice and Tracey, Digital Image Correlation,δ5, 2024 Al-Cu.
1
Introduction
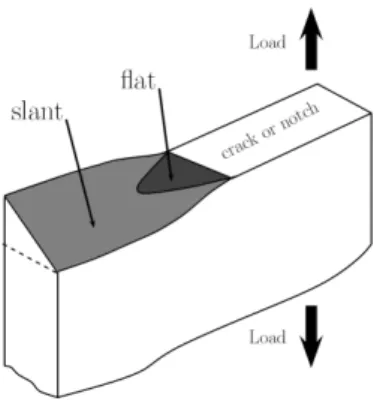
Assessment of structural integrity of structures of-ten requires investigating the combination of of-tensile (Mode I) and shearing (Mode II) or tearing (Mode III) loadings. Numerous investigations have dealt with brittle material or fatigue loading (see review in [1]). The case of ductile fracture has been less studied in particular in cases of extended plasticity (Large Scale Yielding: LSY). This is the case of ductile tearing of thin metal sheets [2] or of welded structures (see e.g. [3]). Even for pure mode I macroscopic load-ing, local mixed-mode can be observed as in the case of slant fracture (I+III modes) as illustrated in Fig. 1 [4]. Microstructural observations indicated that there were two failure mechanisms: void growth and co-alescence (classical ductile fracture: regions with a high stress triaxiality1), and shear localization and de-cohesion (ductile shear fracture: regions with a low stress triaxiality). The reason why slant fracture oc-curs is still not well understood. Several experimental studies (e.g. [5, 6]) introduced an external shear load-ing (mixed-mode loadload-ing) to modify the local state of stress triaxiality (or plastic constraint) to promote one mechanism over another. [7] showed that these mechanisms can be related to the local Mode I and Mode II components of the J-Integral (Global
Ap-proach of Fracture). These results were limited to the
1
The stress triaxiality ratio is defined as: τ = σmσeq where σm
is the mean stress and σeqthe von Mises equivalent stress.
Small Scale Yielding (SSY) conditions where plastic-ity is supposed to be confined around the crack or the notch. For the case of Large Scale Yielding (LSY) conditions, the present topic of interest, another tech-nique may be used to achieve the objectives: the local approach of fracture [8, 9]. This approach is able to deal with the situations where no preexisting crack is present and to predict both the location of crack initi-ation and crack path. Within this framework, damage and rupture can be represented on a surface (cohesive zone model) or in the volume (continuum damage me-chanics).
The purpose of the this study is to shed some light on the ductile mixed-mode fracture process and its un-derlying mechanics. Ductile rupture of a 2024 Al Al-loy thin sheet is investigated under mixed-mode load-ing. The paper is organized as follows. First mechan-ical test are carried out on smooth and specific mixed-mode Arcan specimens, Fig. 2. Test data on smooth samples are used to identify the parameters of consti-tutive equations describing plastic anisotropy. Digital image correlation (DIC) technique is used to measure the local displacement in the vicinity of the V-notch. Using these measurements an analysis of the effect of mixed-mode loading on ductile crack initiation is performed. Failure mechanisms are investigated us-ing scannus-ing electron microscope (SEM). Results are finally interpreted and modeled using a simple local approach type model for ductile failure.
Figure 1: Flat to slant transition in metal sheets.
2
Materials
The study was performed on 2024 aluminum alloy sheets with a nominal thickness of 1.73 mm. This ma-terial, studied in [10, 11, 12] and supplied by Alcan Centre de Recherches de Voreppe (CRV), is a high purity alloy improved for high damage tolerance. Ta-ble 1 gives its chemical composition. The grade was solution heat-treated, quenched and naturally aged to a substantially stable condition (T4). To avoid corro-sion the sheets are covered with a thin cladding (less than 80 µm) of 1050 aluminum on both faces. In
the following, the rolling direction is referred to as L, the long transverse direction as T and the short trans-verse direction (thickness) as S. All specimens used in this work were machined from a single plate of the 2024 material (slightly different from that studied by Bron et al.).
Cu Mn Mg Si Fe Al
3.8-4.9 0.3-0.9 1.2-1.8 0.04 0.07 remainder
Table 1: Chemical composition of 2024 material alloy (wt %), [11].
3
Experimental setup and testing
conditions
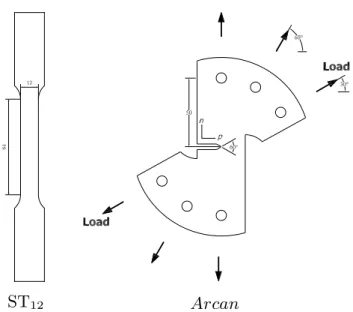
In order to characterize the mechanical behavior, two specimen types were used (Fig. 2). The ST12sample
is a conventional smooth flat tensile specimen used to determine the elastic-plastic behavior. Smooth tensile specimens were tested using two displacement gages so that both longitudinal and transverse strain were recorded.
Arcan samples were used to study the fracture be-havior for three different loading conditions
character-ized by the angleβ between the machined notch and
the loading direction. Values for β were: β = 30◦, 60◦ and 90◦. 90◦ corresponds to pure macroscopic
mode I (see Fig. 2). Two configurations were com-pared with the notch machined either along the L di-rection or the T didi-rection ; they will be referred to as LNand TNin the following. All tests are carried out at
room temperature on a 50 kN servo-hydraulic testing machine under displacement control with a displace-ment rate equal to0.2mm/min. In this study a
mono-block Arcan specimen was designed whereas smaller samples attached to a setup allowing to vary the load-ing direction are often used in the literature (see e.g. [6]). This specimen allows to better control and mon-itor loading on the specimen so that comparisons can more easily be made with finite element simulations.
Digital Image correlation (DIC) technique was used to follow the deformation of Arcan specimens by tracking the displacement of predefined marks in the vicinity of the V-notch. Two marks are located at
±2.5 mm from the notch tip to measure the δ5
dis-placement as proposed in [13]. Two other marks are used to measure the Crack Mouth Opening Displace-ments (CMOD) at7 mm from the crack tip as done in
[14]. The position of the different marks is sketched in fig. 3. In both cases, the relative displacement of both marks can be decomposed into normal and par-allel components with respect to the notch direction.
The technique was applied using a mobile equip-ment: combination of a SPOT Insight Digital Cam-era, a computer and a correlation software. The main features of the Digital Camera are: a CCD resolution of 2048 x 2048 pixels, a sensor pixel size of 7.4 µm
square pixels and 14 bits for intensity resolution. Its accuracy is closely related to several factors (such as the quality of the random speckle, lighting, CCD sen-sor, optical lens. . . ). For the experiments the distance between the camera and the specimen is ≈ 340 mm
and the typical magnification factors is 70 pixels/mm. It is also important to set-up a specific process to min-imize all sources of errors related to DIC technique. Guidelines are proposed in recently published works [15, 16] to minimize and to correct these errors.
4
Fractography
As depicted in Fig. 1 fracture surface in Arcan test samples is always initiated at the middle of the notch where the fracture surface is flat along the notch di-rection. This region forms a small triangle. Outside this zone, slant fracture is observed. A closer exam-ination of the fracture surfaces, shows void growth around the iron/copper particles. Void growth is more pronounced in the flat fracture region than in the slant
6
4
12
ST12 Arcan
Figure 2: Specimens for mechanical testing.
rs rs rs rs 3 1 2 4 5mm 7mm δ5p δ5n δ5 CM ODp CM ODn CM OD
Figure 3: Position of the series of marks used as opti-cal extensometers in order to measure loopti-cal displace-ment.
fracture zones. Between these voids, small dimples, probably initiated on dispersoids or Al2(Cu,Mg)
pcipitates, are observed. The size of the triangular re-gion depends on the loading angle (β) as shown in
Fig. 4. It tends to decrease when mixity increases (i.e. low values forβ).
5
Results of mechanical tests
5.1 Results for smooth specimens
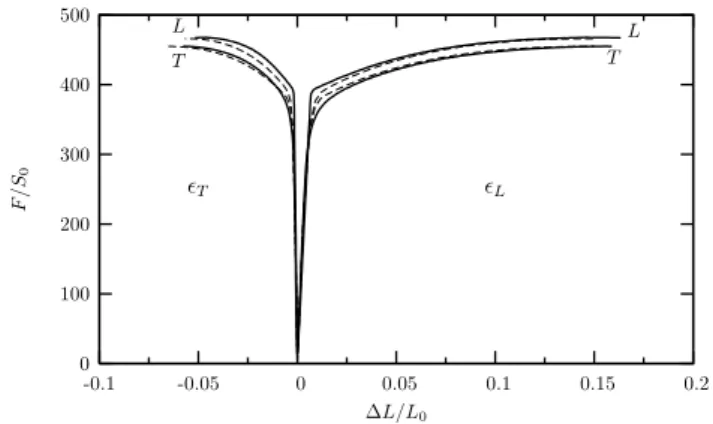
Fig. 5 shows the nominal stress (F/S0) as a function
of axial longitudinal elongation (ǫL) and long
trans-verse elongation (ǫT). It is shown that the material
presents a plastic yielding anisotropy with the L di-rection being the strongest. These results are con-sistent with thus obtained by Bron for the similar 2024 Al Alloy plate although slight differences were found: higher hardening in the L–direction (higher
T L T L Angle(degree) S (m m 2) l( m m ) 1.4 1.2 1 0.8 0.6 0.4 0.2 0 30 60 90 1.4 1.2 1 0.8 0.6 0.4 0.2 0 30 60 90 (b) (a) 200 µm
Figure 4: Fractographic examination: (a) Fracture surface SEM observations of Arcan sample (LN
con-figuration), (b) Evolution of the triangular flat zone (length and surface) with respect to the loading angle
β.
yield stress (YS) to ultimate stress (UTS) ratio) These data allow to compute the Lankford coefficient Lk
de-fined as the ratio of the true deformation along the width of the specimen to the true deformation along the thickness (S direction). The latter is computed as-suming plastic incompressibility. Results clearly indi-cate that thickness reduction is higher than width re-duction. The principal mechanical characteristics are gathered in Table 2.
YS UTS UE RE Lk
(MPa) (MPa) (%) (%)
L 394 468 15. 18. 0.69
T 332 455 15. 18.5 0.51–0.66
Table 2: Tensile properties along the L and T direc-tions (YS: yield strength for 0.2% plastic strain (MPa), UTS: ultimate tensile strength (MPa), UE: uniform elongation (%), RE: elongation at rupture (%) de-duced from the load line displacement corrected for elastic deformation, Lk: Lankford coefficient for a
plastic deformation of 5%.
5.2 Results for Arcan specimens
Results of Arcan tests are shown in Fig. 6. Both configurations LN and TN have very similar
behav-ior showing that the ultimate forceFu and the
corre-sponding displacementδ5u increases when the mixity
par-L T L T ǫT ǫL ∆L/L0 F / S0 0.2 0.15 0.1 0.05 0 -0.05 -0.1 500 400 300 200 100 0
Figure 5: Tensile tests onST12along T and L
direc-tions: Nominal stress (F/S0) as a function of axial
engineering strain (ǫL) or long transverse engineering
strain (ǫT). Dashed lines correspond to the FE
sim-ulation with the optimized coefficients presented on Table 4 and Table 5.
allel axes of the notch tip indicates, see Fig. 6 and Ta-ble 3, that the ultimate forceFuoccurs approximately
at a fixed value of the normalδ5displacement around δ5ni = 0.24mm for LN and δ5ni = 0.25mm for
TNeven though a slight decrease is observed for the
loading conditionβ = 30◦ (TNconfiguration)
corre-sponding to the mode II predominant mode. These ob-servations were corroborated with the measurements of the CM OD (not presented in the present paper).
These results indicate the prevalence of Mode I frac-ture mechanisms dominated by tensile stresses. Simi-lar results were obtained by [6] with the measurement of a crack-tip displacement vector δv except in pure
Mode II, where a significant decrease of about 30% was observed. This last cases was not investigated in this study. Fu Fup Fun δ5u δ5up δ5un L 30◦ 6.72 5.82 3.35 0.43 0.37 0.22 60◦ 5.67 2.85 4.90 0.28 0.11 0.26 90◦ 5.42 5.42 0.26 0.26 T 30◦ 6.50 5.63 3.25 0.45 0.38 0.24 60◦ 5.66 2.84 4.90 0.26 0.11 0.24 90◦ 5.25 5.25 0.24 0.24
Table 3: Decomposition of measured parameters along normal and tangential axes of the notch at the ultimate load,F : force (kN ), δ5: local extensometer
(mm). 30 90 60 30 90 60 TN LN δ5= q δ2 5p+ δ 2 5n(mm) F (k N ) 0 0.5 1. 1.5 2./0. 0.5 1. 1.5 2. 7 6 5 4 3 2 1 0 e d a
Figure 6: Arcan tests for TNand LN configurations:
force—δ5 curves for different samples. Dashed lines
correspond to the FE simulation. Black dots indicate the predicted fracture initiation using Rice and Tracey indicator (dots marked as a, d and e corresponds to
damage plots in Fig. 9).
6
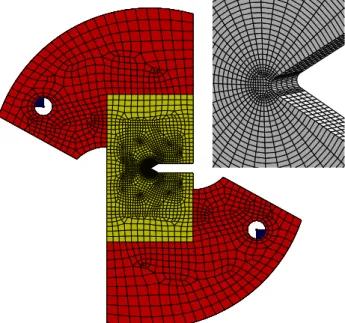
Simulation — discussion
In this section, an interpretation of the main exper-imental results is proposed based on an application of the local approach to fracture [17]. Finite ele-ment simulation of various specimens was performed using the Zset software [18, 19]. Meshes were con-structed using 3D elements with linear interpolation and full integration. Material symmetrie was used to reduce the problem size. Fig. 8 presents the 3D Arcan mesh used for FE simulation. An imposed displace-ment along the loading direction (β angle) is applied
to the tip of two elastic wedges to represent pin load-ing without accountload-ing for contact. In regions where damage develops, a fixed element size (about 50µm)
was used.
6.1 Model for the plastic behavior
The material under study presents a complex anisotropic plastic behaviour which cannot be repre-sented by a simple quadratic yield surface such as the one proposed in [20] which is unable to satisfactorily describe simultaneously yield anisotropy and Lank-ford coefficients in all directions. To overcome this difficulty, the yield condition proposed by [10] is used in this work. This phenomenological yield function is proposed to represent plastic anisotropy of aluminum alloy sheets. It is an extension of the functions given in [21] and [22]. Plastic anisotropy is represented by 12 parameters in the form of two fourth order symmet-ric tensors. Four other parameters influence the shape of the yield surface uniformly. The model is based on the definition of an equivalent stressσ function of the
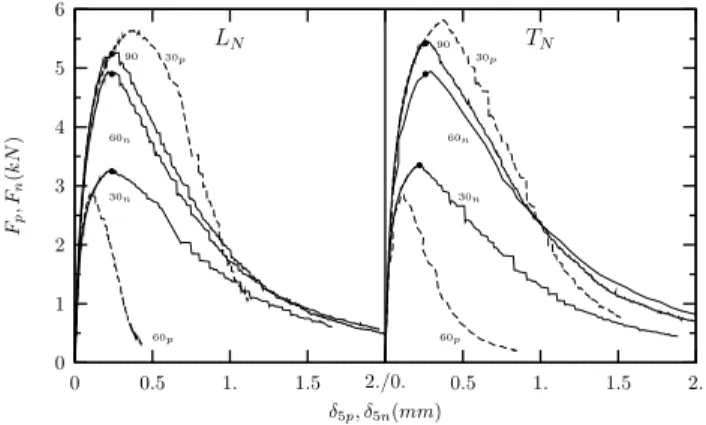
60n 30n 60p 30p 90 60n 30n 60p 30p 90 TN LN δ5p, δ5n(mm) Fp ,F n (k N ) 0 0.5 1. 1.5 2./0. 0.5 1. 1.5 2. 6 5 4 3 2 1 0
Figure 7: Arcan tests for TNand LN configurations:
force—δ5 curves projected along normal and parallel
axes for different samples. Black dots indicate the po-sitions of the ultimate Force Fu, Local displacement δ5nfor each case as reported on Table 3.
stress tensorσ:
σ = (α1σa1+ α2σa2) 1/a
(1) withα2 = 1 − α1. σ1 andσ2 are respectively given
by: σ1 = „ 1 2 “ |S12− S 3 1|b1+|S 3 1− S 1 1|b1+|S 1 1− S 2 1|b1 ”«1/b1 (2) σ2 = „ 3b2 2b2+ 2 “ |S1 2| b2+|S2 2| b2+|S3 2| b2”« 1/b2 (3) whereS1 1,S 2 1 andS 3 1 (resp. S 1 2,S 2 2 andS 3 2) are the
eigenvalues of a modified stress deviators1 (resp.s2)
defined as: s1 = L1 : σ (resp. s2 = L2 : σ) where
the fourth order tensorsL1,2have the following form
using Voigt notation:
Lk= (cLL k + c SS k)/3 −c SS k /3 −c LL k /3 0 0 0 −cSS k/3 (c SS k + c TT k )/3 −c TT k /3 0 0 0 −cLL k /3 −c TT k /3 (c TT k + c LL k )/3 0 0 0 0 0 0 cTL k 0 0 0 0 0 0 cLS k 0 0 0 0 0 0 cST k (4) The yield surface is finally expressed as:
Φ = σ − R(p) (5)
where R(p) represents isotropic work hardening
parametrized by the effective plastic strain p. R is
expressed as:R(p) = R0(1 + K1(1 − exp(−k1p)) + K2(1 − exp(−k2p))).
The identification of the various material param-eters was performed following the procedure defined in [10]. Parameters representing plastic anisotropy are
chosen as thus optimized by [10], see Table 5. Param-eters representing elastic behavior and work harden-ing were identified usharden-ing smooth specimens in L and T directions. The results are presented in Table 4 and Fig. 5 shows the comparison with tensile tests.
E ν R0 K1 k1 K2 k2
69 0.36 277 0.35 664 0.71 10.54
Table 4: Parameters describing elasticity and plastic hardening.E: Young’s modulus (GP a), ν: Poisson’s
ratio,R0(M P a). a = b1= b2 α cTT1 c LL 1 c SS 1 c TL 1 cTT 2 c LL 2 c SS 2 c TL 2 18.2 0.734 1.011 1.023 0.941 0.950 0.797 0.646 1.276 1.188 cLS i andc ST
i : these parameters are fixed to 1.
Table 5: Parameters describing anisotropic yielding and plastic flow, [10].
6.2 Evaluation of damage on Arcan
speci-mens
The various tests carried out on Arcan specimens are simulated using the above described model. Good agreement is obtained up to the point for ductile fail-ure initiation as shown in Fig. 6 which approximately corresponds to the load maximum.
Damage in the various specimens was evaluated based on a post–processing treatment of elasto-plastic calculations using the Rice and Tracey model for duc-tile void growth [23, 17]. The original model is how-ever only valid for high stress triaxialities [24]. The accuracy of the model was improved by Huang [25] in particular to better represent void dilatation rate at low stress triaxiality. In that case the void growth rate is given by ˙ R R = ( α exp (βτ ) ˙p if τ > 1 ατ1/4exp (βτ ) ˙p if τ ≤ 1 (6)
where R is the void radius, τ the stress triaxiality, p
the effective plastic strain. α and β are two constants
which are equal to0.427 and 1.5 respectively. Failure
of a volume element is assumed to occur when void growth reaches a critical value(R/R0)c(whereR0is
the initial void radius) which is assumed to be a mate-rial constant. A damage indicator (R/R0) is obtained
Figure 8: 3D Arcan mesh (β = 30◦) used for FE
sim-ulation.
by integrating Eq. 6. The Rice and Tracey damage indicator was evaluated using averaged values of the plastic strain and the stress triaxiality ratio in each el-ement. Numerical crack initiation is defined as the instant where the Rice and Tracey criterion is met for the first time in the structure. The crack extension at initiation corresponds to one element as averaged val-ues are used.
In Fig. 9 the maximum value of damage are shown as a function of to δ5 local displacement for
both test configurations (LN and TN). For a given
local displacement δ5, one notices that damage
in-creases when mixity is reduced. Maps (a), (b) and (c)
show the damage indicator around the notch tip cor-responding respectively to load angle β of 90◦, 60◦
and30◦for (δ5=δ5
u) at which the maximum load
oc-curs for the case of Mode I (load angle of 90◦). It
is clearly apparent that the introduction of external shear loading modifies the local state of damage. One notices that the orientation of damage contours is ro-tated counterclockwise (i.e towards the blunted por-tion of the notch surface) as β changes from 90◦ to 30◦. The damage indicator near the sharpened
por-tion of the notch is small for the case involving a large Mode II component.
For β = 90◦ (TN configuration) the value of (R/R0)c can be adjusted to represent failure
initia-tion at the point(δ5)u = 0.26 mm. (R/R0)c = 1.82
is then given by black dot (a) on Fig. 9. Using this
value predicted failure initiation is represented by the black dots on Fig. 6 for the other load anglesβ = 60◦
andβ = 30◦. Forβ = 60◦ the initiation is well
pre-dicted whereas forβ = 30◦ initiation occurs slightly
before the maximum load. The damage map (e)
corre-sponding to this last case reveals a very different dam-age zone: the size of this zone is decreased compared toβ = 60◦ andβ = 90◦cases.
When the load is closed to Mode I, the shape of damage zone is large and elongated from the notch tip as observed for plane stress condition. For the load close to Mode II (β = 30◦), the shape of the
dam-aged zones forms an asymmetric butterfly like shape as observed for plane strain conditions. These results are consistent with the size of the triangular region ob-served.
Finally, Fig. 10 shows the experimental curves are well reproduced by simulation. The critical values observed experimentally (black dots) indicate that the normal component ofδ5 at initiation (ultimate force)
remains approximately constant whereas the parallel component varies greatly. Scatter has not been stud-ied, this could explain the difference observed for the loading conditionβ = 30◦(T N configuration). 30 60 90 30 60 90 (δ5n )c = 0.25 (δ5n )c = 0.24 TN LN δ5(mm) δ5n (m m ) 0 0.25 .5 .75 1./0. 0.25 .5 .75 1. 0.5 0.4 0.3 0.2 0.1 0
Figure 10: Arcan tests for TNand LNconfigurations: δ5—δ5n curves. Dashed lines correspond to the FE
simulation. Black dots represent experimental fail-ure initiation (corresponding to ultimate forceFu) for
each case.
7
Conclusions
In this study, ductile rupture of a 2024 Al Alloy thin sheet was investigated under mixed-mode (I+II)
load-ing. Mechanical tests were performed on smooth and specific mixed-mode Arcan specimens. Test data on smooth samples were used to identify the parameters of constitutive equations describing plastic anisotropy. Fracture initiation is studied using fractographic ex-amination of broken specimens, measurements of lo-cal displacement fields in the vicinity of the V-notch
e
d
c
b
a
30
60
90
δ
5(mm)
R R00.5
0.4
0.3
0.2
0.1
0
3
2.5
2
1.5
1
0 R R0 1.8e
c
b
a
60
90
30
Figure 9: Arcan FE simulation: Rice and Tracey damage indicator (R/R0) vs. δ5 curves for different loading
angles. Solid lines correspond to the LNconfiguration while dashed lines correspond to TNconfiguration. Maps
show the damage indicator at various loading steps.
using Digital Image Correlation and finite element simulations of the whole Arcan specimen.
Fracture initiation is assumed to correspond to the load maximum and to the formation of the triangu-lar area ahead of the initial notch. In this area dam-age is essentially controlled by void nucleation and growth. The correspondingδ5displacement increases
when mixity is increased. It is however shown that its normal componentδ5n is constant. This
conclu-sions are well supported by finite element simulations. Simulations also indicate that the size of the dam-aged zone at crack initiation decreases with increasing mixity which can be correlated with the decrease of the triangular area experimentally evidenced in Fig. 4. These results indicate that mode I component of load-ing mainly controls crack initiation. To validate these preliminary conclusions, further work will be carried out on fatigue precracked Arcan specimens. Lower loading anglesβ will also be used to further increase
mode II loading. Note that under these conditions Ar-can specimens tend to buckle. Finally full strain fields determined by DIC will be compared with FE simula-tions.
References:
[1] Qian, J. and Fatemi, A. (1996) Eng. Fract.
Mech., 55 (6), 969–990.
[2] Gao, X. and Shih, C. (1998) Eng. Fract. Mech.,
60 (4), 407–420.
[3] Besson, J., Madi, Y., Motarjemi, A., Koçak, M., Martin, G. and Hornet, P. (2005) Mater. Sci.
En-gng A, 397 (1–25), 84–91.
[4] Mahgoub, E., Deng, X. and Sutton, M. (2003)
Eng. Fract. Mech., 70, 2527–2542.
[5] Zhang, X., Ma, S., Recho, N. and Li, J. (2006)
Eng. Fract. Mech., 73 (13), 1925–1939.
[6] Pirondi, A. and Dalle Donne, C. (2001) Eng.
Fract. Mech., 68 (12), 1385–1402.
[7] Simth, D., Swankie, T., Pavier, M. and Smith, M. (2008) Eng. Fract. Mech., 75 (15), 4394–4409. [8] (2004) Local approach to fracture. Presses de
l’Ecole des Mines (Paris).
[9] Pineau, A. (2006) Int. J. Frac., 138 (1-4), 139– 166.
[10] Bron, F. and Besson, J. (2004) Int. J. Plasticity,
20, 937–963.
[11] Bron, F., Besson, J. and Pineau, A. (2004) Mater.
Sci. Engng A, 380, 356–364.
[12] Bron, F. and Besson, J. (2006) Eng. Fract.
[13] Schwalbe, K.-H., Newman, J. and Shannon, J. (2005) Eng. Fract. Mech., 72, 557–576.
[14] Sutton, M., Yan, J., Cheng, C. and Zavattieri, P. (2007) Optical Engineering, 46.
[15] Haddadi, H. and Belhabib, S. (2008) Opt. Lasers
Eng., 46 (2), 185–196.
[16] Sutton, M., Yan, J., Tiwari, V., Schreier, H. and Orteu, J. (2008) Opt. Lasers Eng., 46 (10), 746– 757.
[17] Pineau, A. (1992). In: Topics in Fracture and
Fatigue, Argon, A. (Ed.), pp. 197–234. Springer
Verlag Inc., NY.
[18] Besson, J. and Foerch, R. (1997) Comp. Meth.
Appl. Mech. Engng, 142, 165–187.
[19] Foerch, R., Besson, J., Cailletaud, G. and Pilvin, P. (1997) Comp. Meth. Appl. Mech. Engng, 141, 355–372.
[20] (1950) The mathematical theory of plasticity. Clarendon Press, Oxford.
[21] Barlat, F., Lege, D. and Brem, J. (1991) Int. J.
Plasticity, 7, 693–712.
[22] Karafillis, A. and Boyce, M. (1993) J. Mech.
Phys. Solids, 41, 1859–1886.
[23] Rice, J. and Tracey, D. (1969) J. Mech. Phys.
Solids, 17, 201–217.
[24] Yatomi, M., Bettinson, A., O’Dowd, N. and Nikbin, K. (2004) Fatigue and Fract. Engng
Mater. Struct., 27 (4), 283–295.
[25] Huang, Y. (1991) J. Applied Mech., 58, 1084– 1086.