On the Citation Lifecycle of Papers with Delayed Recognition
Christian Lachance1 and Vincent Larivière1,2
1 École de bibliothéconomie et des sciences de l'information, Université de Montréal, C.P. 6128, Succ.
Centre-Ville, Montréal, QC. H3C 3J7, Canada
2 Observatoire des Sciences et des Technologies (OST), Centre Interuniversitaire de Recherche sur la Science et la
Technologie (CIRST), Université du Québec à Montréal, CP 8888, Succ. Centre-Ville, Montréal, QC. H3C 3P8, Canada [[email protected]; [email protected]]
Abstract
Delayed recognition is a concept applied to articles that receive very few to no citations for a certain period of time following publication, before becoming actively cited. To determine whether such a time spent in relative obscurity had an effect on subsequent citation patterns, we selected articles that received no citations before the passage of ten full years since publication, investigated the subsequent yearly citations received over a period of 37 years and compared them with the citations received by a group of papers without such a latency period. Our study finds that papers with delayed recognition do not exhibit the typical early peak, then slow decline in citations, but that the vast majority enter decline immediately after their first – and often only – citation. Middling papers’ citations remain stable over their lifetime, whereas the more highly cited papers, some of which fall into the “sleeping beauty” subtype, show non-stop growth in citations received. Finally, papers published in different disciplines exhibit similar behavior and did not differ significantly.
Introduction
Scientific papers are as all things – not all are equal. If a majority of them are noticed by the scientific community (Wallace, Larivière and Gingras, 2009) and integrated into their discipline's body of scientific knowledge soon after publication, something which being cited in other papers is generally considered an indication of, there are those that remain, for a more or less lengthy period of time, in limbo before being cited – papers experiencing delayed
recognition. These are papers that receive no or very few citations in the years following their publication, and only
later start being cited. Among these are found the so-called “sleeping beauties”, papers that, once “awakened” (usually by the first citing paper, known then as their “prince” (van Raan, 2004)), accumulate a considerable number of citations. Typologies have been proposed to give an overview of the different behaviors of these awakened beauties (Braun, Glänzel and Schubert, 2010), as well as models for the different phases of their citation curves (Li, 2014). The reasons for such differences are likely manifold, and may vary across disciplines. Cole (1970) had found that the content of a paper had more importance than the fame of its author in determining the amount of time required before pickup by the scientific community. Ohba and Nakao (2012) found that sleeping beauties in ophthalmology tended to be papers describing new diseases or new treatments, suggesting that these topics, which can be expected to be further probed or tested before being fully integrated into the discipline’s standard corpus, were the cause of the slow growth of citations, whereas Costas, van Leeuwen and van Raan (2013) found a correlation between delayed recognition and publication in journals with lower impact factors. Heinze et al. (2012) studied more technical questions of scientific growth, considering the cases of Buckminsterfullerene and scanning tunneling microscopy, showing that easy and reliable access to new matter and new instrumentation could also have an effect on the citation of papers on such topics. Van Dalen and Henkens (2005) investigated tell-tale signals of later citation activity, in the field of demography, one of which was whether the state of uncitedness negatively impacted a paper’s potential citation at a future time (“negative duration dependence”), and concluded that it was far from the “death sentence” common wisdom considered it to be, but a study by Li et al. (2014) found that the length of sleep (i. e., uncitedness or very low citation activity) did correlate with lower probability of later awakening. Similarly, in a larger study on delayed recognition focusing onlyon highly cited papers, Glänzel, Schlemmer and Thijs (2003) found that delayed reception did not simply “shift” the citation process in time, and that belated citation activity came with higher risk of uncitedness. Levitt and Thelwall (2008) studied late citation to determine indicators that might predict the presence of (future) highly cited papers.
But what of the late bloomers that do not enjoy this – occasionally startling – success? Little seems to have been written specifically on the fate of the poorer cousins in the delayed recognition family. If the sleeping beauties and other Snow Whites are the princesses of this world, what of the shepherdesses, seamstresses and other common folk? In other words, how does late recognition affect the lifecycle of scientific papers? Is there a shift in time, a simple translation of the typical left-skewed distribution peaking 2, 3 years after publication followed by a slow decrease, or do papers with late recognition exhibit a different citation curve once they become cited? To what degree does the ultimate success of an article – in terms of its lifetime citations – affect, if even it does, the accumulation of citations? Does the behavior of sleeping beauties and “common” delayed-recognition papers mirror that of classics and “normal” papers? Finally, it is also known that the citation practices vary between disciplines (Finardi, 2013; Larivière et al., 2006), so what of this disciplinary effect? Do the sleepers behave the same in medicine, in physics or in the social sciences?
Methods
SleepersThe study was performed with citation data from the Web of Science, including the Science Citation Index Expanded, the Social Science Citation Index and the Arts and Humanities Citation Index. The data was acquired in November 2013. The sleepers group was populated with papers published between 1963 and 1975 (inclusive) that received their first citation(s) only once 10 full years (or more) had elapsed since their publication (i. e., first cited in 1974 or later for papers published in 1963; 1975 and later for those published in 1964, etc.). The number
of yearly citations received for the period starting with [year of publication + 11] up until 2013 was gathered for each paper, as well as the discipline assigned by the SCIE.
The citation data for 2013 was eliminated, as the year was not yet over at the time of the study. We used a relative time frame for the study, meaning that instead of the calendar years themselves, we used the amount of time elapsed since publication, as t + x, where t is the year of publication and x an integer representing a number of (complete) years elapsed. As we were focusing on the effect over time, this method allows for ignoring the effect of individual years or of punctual events that may have affected the production of scientific papers, which is beyond the scope of our inquiry. For example, this means that the year 2012 corresponds to t + 37 for the papers published in 1975, and to t + 49 for those of 1963, etc. The study was limited to the upper boundary of t + 37, as it was the last year for which a complete citation window was available for all publication years. Starting with t + 38, when the data of 1975-published papers ceases (as 1975 + 38 = 2013, the incomplete year removed from the dataset), each increment loses a publication year, making the calculations increasingly less meaningful and less comparable, as the populations dwindled. As we felt that the citation window available was sufficient to afford the desired overview, the t +37 upper limit it was deemed acceptable.
Reference Group
The reference group is also drawn from WoS data. It comprises papers published between 1963 and 1975 (inclusive), but with no restriction concerning the date of the first citation(s) – except that the sleepers described above were removed. The citation window for the reference group was structured the same way it was for the sleepers, i. e., using relative time (t + x), but the window itself goes from t + 0 (publication year) to t + 37, as the reference group papers are allowed to receive citations immediately upon publication. Citations received before publication were ignored to simplify data treatment; as they were very few in number, it was felt that their effects would not be impactful.
Presentation of the Results
We observed the evolution of the citations received by the sleepers over time and compared them to the reference group versus: time elapsed since publication; amount of lifetime citations; and discipline. Disciplinary clusters were made to see if the natural, social and medical sciences behaved differently. The clusters are medicine (made up of papers from the disciplines of: biomedical research, clinical medicine, health, psychology), science (papers from: biology, chemistry, earth & space, mathematics, physics), arts/humanities/social sciences (papers from: arts, humanities, social sciences) and applied disciplines (papers from: engineering and technology, professional fields). The few papers of “unknown” discipline were ignored for this.
Data Overview
Table 1 presents the distribution of the papers, grouped by total number of citations received. It shows that most sleepers obtain very low numbers of citations, with more than 92% of them receiving between 1 and 5 citations. For the reference group, only slightly more than a third of the papers receive between 1 and 5 citations. On the other hand, while less than 0.1% of sleepers obtain more than 51 citations, this number of citations is obtained by more than 11% of papers of the reference group. On the whole observe that sleepers are, in general, papers with very low citation rates. Appendices 1 and 2 provide the distribution of papers and of lifetime citations by discipline (Appendix 1) and for disciplinary clusters (Appendix 2). These tables show that, globally, disciplines with lower citation density have a higher proportion of sleepers.
Table 1. Distribution of papers by total citations
Lifetime
citations papers % papers %
1 to 5 117,862 92.60% 848,891 34.98% 6 to 10 6,754 5.31% 418,883 17.26% 11 to 15 1,557 1.22% 259,039 10.67% 16 to 20 509 0.40% 178,053 7.34% 21 to 50 520 0.41% 447,767 18.45% 51+ 82 0.06% 274,031 11.29% Total 127,284 100.00% 2,426,664 100.00%
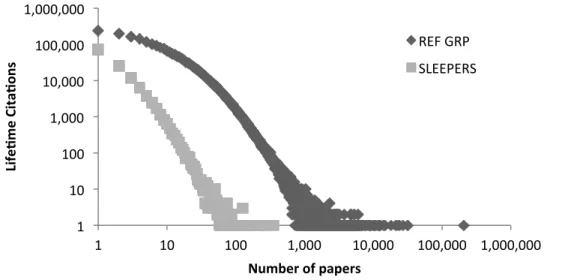
Figure 1 presents the distribution of lifetime citations of sleepers and of papers in the reference groups. In both cases, papers with few citations are clearly in the majority, but the progression is less direct for the reference group. The total number of papers in both groups is quite different (127,284 vs. 2,426,664), as is the total number of citations, which is, of course, much larger in the reference group (299,420 vs. 57,450,854).
Figure 1. Log scale distribution of papers vs. lifetime citations received. Reference group (diamonds) and sleepers (squares)
Results
Effects over time
Figure 2 below shows the yearly percentage of lifetime citations accumulated following publication year. Each line represents a specific year of publication, save for the dotted one, which is the global average. In both cases, this latter is an excellent simplified representation: the standard deviation is very small (varying, in percentage points, between 0.12 and 0.54 for the sleepers, 0.04 and 0.25 for the reference group).It shows that both groups behave very similarly. The reference group, being much larger, produces more homogeneous results, but the trends are quite clear among the sleepers.
1 10 100 1,000 10,000 100,000 1,000,000 1 10 100 1,000 10,000 100,000 1,000,000 Lif e% m e Cita% ons
Number of papers
REF GRP SLEEPERS
Figure 2. Percentage of lifetime citations received, per year since publication, for papers with publication date 1963 to 1975. Each line represents a different publication year:.
Effect of lifetime citations received
Figure 3a below shows the percentage of lifetime citations received, per year since publication, by the “sleeping” papers. Subgroups were made according to total lifetime citations received. The “1 to 5” group again shows that it represents the near totality (92.60%) of the sleepers by being very similar to the average show in Figure 2. It is the only group to do so: the “6 to 10”, “11 to 15” and “16 o 20” plots remain, after a relatively weak initial increase, remarkably stable; and the “21 to 50” and “51+” plots show non-stop growth from t + 11 to t + 37.
Figure 3b also presents the percentage of lifetime citations, but for the reference group. It shows, for all subgroups, a fairly standard sharp rise and subsequent decline, with the exception of the “51+” group, presenting a much less pronounced drop after the peak, as well as a higher activity in the long run. The subgroups keep the same positions relative to one another in both the “sleeper” and reference group, with an inversion around t + 8 for the latter, t + 26 for the former.
0.00% 1.00% 2.00% 3.00% 4.00% 5.00% 6.00% 7.00% 8.00% 0 2 4 6 8 10 12 14 16 18 20 22 24 26 28 30 32 34 36 % of li fe %m e ci ta %o ns
Years since publica%on
Sleepers Reference group
% of li fe time c ita tio ns
Years since publication
Figure 3. Percentage of lifetime citations received, per year since publication, vs. the total number of lifetime citations: (A) sleepers; (B) reference group.
Disciplinary differences
Figure 4 below shows the disciplinary effect for the sleepers (4a) and the reference group (4b). Thedisciplines were grouped into four clusters: medicine (biomedical research, clinical medicine, health, psychology); sciences (biology, chemistry, earth and space, mathematics, physics); arts, humanities and social sciences; applied fields (engineering and technology, professional fields). The very few papers categorized as of “unknown” discipline were removed. Generally speaking, the different clusters remain very similar in their behavior, although it is interesting to see that the arts, humanities and social sciences cluster is in opposite positions: among the sleepers, this cluster has the strongest start, but the weakest finish; in the reference group, the cluster has the weakest start, but the strongest finish.
0.00% 2.00% 4.00% 6.00% 8.00% 10.00% 12.00% 14.00% 16.00% 0 2 4 6 8 10 12 14 16 18 20 22 24 26 28 30 32 34 36
(A)
0.00% 2.00% 4.00% 6.00% 8.00% 10.00% 12.00% 14.00% 16.00% 0 2 4 6 8 10 12 14 16 18 20 22 24 26 28 30 32 34 36(B)
Years since publication
Figure 4. Percentage of lifetime citations received, per year since publication, according to disciplinary cluster: (A) sleepers; (B) reference group.
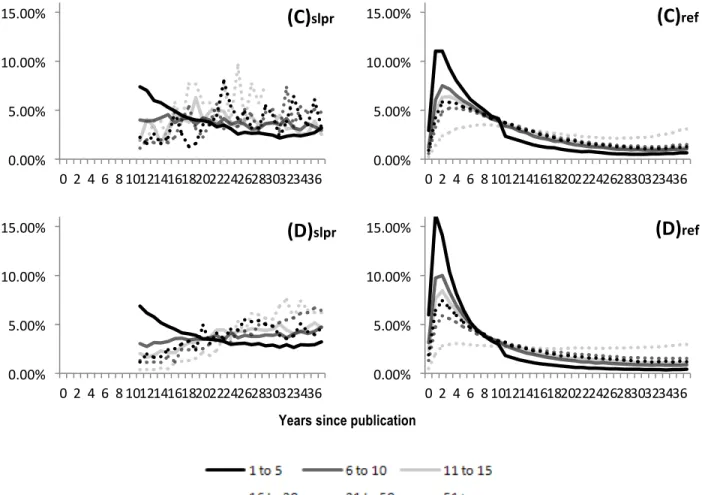
Figure 5, below, breaks down the disciplinary clusters by lifetime citation groups (as in Figure 3). Sleepers (slpr) are on the left, reference group (ref) on the right. All four control-group clusters show similar behavior, with the more central “6-10”, “11-15”, “16-20” and “21-50” subgroups flanked by the high peak of the “1-5” and the lower peak (and, in the case of the arts/humanities/social sciences and applied disciplines clusters, more plateau than peak) “51+” subgroup. The sleepers also follow a similar pattern, the trendsetting “1 to 5” subgroup being the only one to decline (although as more than half the papers in this group (56.30%) are one-citation papers, it is somewhat less of a decline than an disappearance).
% of li fe time c ita tio ns 0.00% 1.00% 2.00% 3.00% 4.00% 5.00% 6.00% 7.00% 8.00% 0 3 6 9 12 15 18 21 24 27 30 33 36 % of li fe %m e ci ta %o ns
(A)
0.00% 1.00% 2.00% 3.00% 4.00% 5.00% 6.00% 7.00% 8.00% 0 3 6 9 12 15 18 21 24 27 30 33 36(B)
0.00% 5.00% 10.00% 15.00% 0 2 4 6 8 10 12 14 16 18 20 22 24 26 28 30 32 34 36(A)
slpr0.00% 5.00% 10.00% 15.00% 0 2 4 6 8 10 12 14 16 18 20 22 24 26 28 30 32 34 36
(A)
ref 0.00% 5.00% 10.00% 15.00% 0 2 4 6 8 10 12 14 16 18 20 22 24 26 28 30 32 34 36(B)
slpr0.00% 5.00% 10.00% 15.00% 0 2 4 6 8 10 12 14 16 18 20 22 24 26 28 30 32 34 36
(B)
refYears since publication
Figure 5. Percentage of lifetime citations received, per year since publication, for papers in the clusters of: (A) Medicine; (B) Science; (C) Arts, humanities and social sciences; (D) Applied disciplines. Sleepers (slpr) on the left, reference group (ref) on the right.
The sleepers in medicine (left panel of Figure 5a) have an aberrant “51+” subgroup that shoots up at t + 27. This is caused by about 6 papers (one in clinical medicine, but mostly five from biomedical research, which become very active at this moment. This would be behavior expected of “sleeping beauties”, although the question of why several papers are simultaneously “awakened” would need to be investigated.
We also checked to see whether papers that could be considered as “true” sleeping beauties – i.e. that obtain high a number of citations – behaved in a manner similar to the reference group, or if papers without delayed recognition all closely follow the slope shown in Figure 2. Given that the large number of papers could create an aggregate effect and hide other behaviors, we isolated and looked at the subgroup of highly cited papers. Instead of using absolute citation numbers as thresholds, however, we used percentages, and isolated the top 0.05%, 0.01% (suggested by Glänzel and Garfield, 2004) and 0.005% (suggested by Ohba and Nakao, 2012, for ophthalmology) most highly cited papers.
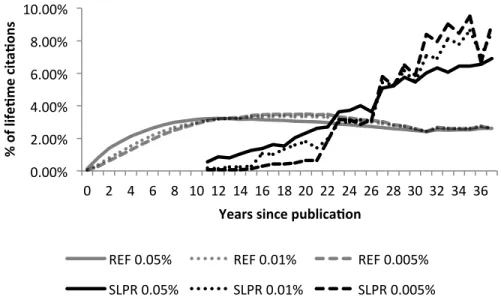
Figure 6 below shows an obvious difference of dynamics between sleepers and reference-group papers. The latter show an initial rise, but no decline once a peak/plateau is reached, whereas the former show pretty straightforward increase from the beginning. In both cases, the more highly cited subgroups rise more slowly, but show more activity later in the citation window. Results are difficult to generalise, however, since these are very small subgroups – especially for these groups of sleepers, ranging from 6-64 papers. Of course, it is important to note, again, that the reference-group papers here are not “sleeping beauties” and that they obtain much more citation than the group of “highly-cited” sleepers : these highly active papers will have received on average between 50 to 75 citations two years after publication, and 2,000 to 8,000 by the end of our citation window. This is clearly not delayed anything, behaving much more like true “classics” (van Raan, 2004).
0.00% 5.00% 10.00% 15.00% 0 2 4 6 8 10 12 14 16 18 20 22 24 26 28 30 32 34 36
(C)
slpr0.00% 5.00% 10.00% 15.00% 0 2 4 6 8 10 12 14 16 18 20 22 24 26 28 30 32 34 36
(C)
ref0.00% 5.00% 10.00% 15.00% 0 2 4 6 8 10 12 14 16 18 20 22 24 26 28 30 32 34 36
(D)
slpr0.00% 5.00% 10.00% 15.00% 0 2 4 6 8 10 12 14 16 18 20 22 24 26 28 30 32 34 36
(D)
refFigure 6. Top-cited papers. Top 0.05%, 0.01% and 0.005% most highly cited papers among the reference group and the sleepers.
Discussion
The results of Figure 2 show rather homogeneous behavior, regardless of the publication year, for the sleepers, and even more so for the reference group, as one could expect given the population size. The “sleeping” papers of more recent years tend to accumulate a greater percentage of their citations later than their older kin, but their behavior nonetheless remains very similar to the overall dynamic. Figure 2 in itself answers the initial interrogation concerning the behavior of papers experiencing delayed recognition. The difference with the reference group is quite clear: the “sleeping” papers never, regardless of the publication year, exhibit the sharp peak soon after publication – or first citation(s), in the case of sleepers – (around t + 2, t + 3), followed by uninterrupted decline thereafter. In all cases, the citation(s) of sleepers at t + 11, which is the beginning of our citation window and the point at which these papers can be concretely noticed and integrated by the scientific community (i.e., cited), is their high-water mark. For most years, this is followed by a decline that goes on until about t + 30. Thereafter, the average for the more recent papers (published 1970-1975) picks up slightly. The 1975 papers, in particular, show a sudden rise at t +27, caused by about 6-10 papers in biomedical research and in clinical medicine. Closer scrutiny would be needed to see if there is a common cause behind this sudden increase, however. In any case, the t + 30 to t + 37 period (the end of our citation window) corresponds, for those 1970-1975 papers, to the years 2000+, so the effects of digital access can perhaps play a part in the different dynamic of these “younger” papers. It could also be more noticeable among the sleepers than in the reference group because of population size; further study would, however, be required before such a claim could be made.
The general trends, in any case, are quite clear: papers with delayed recognition, overall, do not benefit from the same spurt of interest immediately following their first citation(s); their “15 minutes of fame” are over in an instant, so to speak. This is coherent with the data from Table 1: with 92.60% of all papers being in the “1 to 5” lifetime citations (and 1-citation papers accounting for 56.30% of all sleepers), more than half of the sleepers are only ever cited once, when they are “discovered”. In other words, delayed recognition papers are “already old” when they debut in the scientific community, and most of them immediately disappear. Whether one can call that “recognition” or not is debatable.
All delayed recognition papers are not, however, of one kind, as shown by Figure 3a. If the overall slope is essentially that of the “1 to 5” lifetime citations subgroup, all the other subgroups behave differently from these
0.00% 2.00% 4.00% 6.00% 8.00% 10.00% 0 2 4 6 8 10 12 14 16 18 20 22 24 26 28 30 32 34 36 % of li fe %m e ci ta %o ns
Years since publica%on
REF 0.05% REF 0.01% REF 0.005% SLPR 0.05% SLPR 0.01% SLPR 0.005%
trendsetters. The comparison with the reference group is also rather telling. Despite slower ageing for the more active subgroups, the reference group is very homogeneous in its behavior, unlike the sleepers. All reference subgroups decline from t + 3 on (t + 2 in most cases), after a vertiginous climb, whereas the ascent of all subgroups (save the “1 to 5”) among the sleepers is far less spectacular – but is unbroken in our window. Further research would be needed to see if some kind of common threshold, behavior, etc., is to be found among these to distinguish them from the majority of little-cited sleepers beyond simple citation counts.
The discipline to which they belong also seems to have very little influence on the behavior of delayed-recognition papers (Figures 4, 5). Sleepers or reference group, the plots are very similar among themselves. The figures suggest that the more “scientific” clusters (science and medicine), and the more humanities-focused one (arts, humanities, social sciences) behave differently, the latter seeming to age more slowly in the reference group, but showing exactly the opposite behavior – stronger start and rapid decline – among the sleepers. However, it is difficult to draw strong conclusions from this, since these clusters are made up relatively few papers: the arts, humanities and social sciences cluster represents 10.80% of “sleeping” papers (8.35% of their citations), and 3.35% of the reference group’s papers (1.55% of its citations). The WoS is also well known for its lack of coverage in the social sciences and humanities (see for example Larivière and Macaluso, 2011). A more in-depth study would be needed to better discern the actual differences that may exist between these two broad fields, or between individual disciplines. Looking at the frequency of the phenomenon of delayed recognition over time in different fields, accounting for their different citation practices could also provide interesting insights on the phenomenon.
Even the extremely highly cited papers of the reference group show a similar behavior to that of the rest of their kin, as shown in Figure 6. The right shift of the peaks (which are more plateaus) is expected for papers that will keep accumulating increasingly large numbers of citations for many, many years, but in all cases the “typical” plot of citation activity (however downward-pressed), with an early peak and following decline/plateau, is somewhat recognizable. The period following the t + 30, however, shows renewed activity, stabilizing at the 2.5%-3.0% range. It is difficult to compare numbers with the sleepers, though, even those of the “51+” lifetime citations subgroup, as it maxes out at 353 lifetime citations, compared to the reference group’s maximum of 192,675. In any case, the reference group and the sleepers still behave differently in the more highly cited ranges, albeit less than at the lower levels of activity. Whether the highly cited sleepers would plateau beyond t + 37 or not would need to be investigated. Again, though, the reference-group papers here are those showing ceaseless activity and popularity since their publication – fundamental papers, be it theory or method; classics, and not “sleeping beauties”.
It would be interesting to investigate the behavior of the latter and to compare it to said “classics”. The rarity and thus likely idiosyncrasy of “sleeping beauties” (about 0.01% of papers altogether, according to Glänzel and Garfield (2004), but this is likely field-dependant, as Ohba and Nakao (2012) report a rate of 0.005% for ophthalmology) is, however, such that to gather a statistically interesting sample size for a proper study, a very large population is required, as are solid selection criteria (Ponomarev et al., 2014), and there is no one definition of what is or is not a “sleeping beauty”. The questions of what constitutes “sleep”, how to measure and operationalize it remain central to these studies.
The results shown in Figures 3a and 5a, b, c, d (slpr) are similar to those obtained by Levitt and Thelwall (2008) for highly cited papers with late citation peaks. They did not use disciplinary clusters in their study, and the selection method was different (they selected papers based on high citations and the presence of late citation peaks, or low citations and the presence of an early peak, instead of a fixed X-year latency period), but the results, especially for physics and chemistry (highly cited/late peak), which would be in our “science” cluster, are very similar: the top 12 papers they observed show a growth similar to our more highly cited papers, and the slope
weakens for the 13th-24th and 25th-36th places. The remainder of the papers perform very similarly to our “1 to 5”
group, starting around 7% to 8% of lifetime citations and dropping very rapidly.
Limits
papers to disciplines, with regard to the scholarly journals indexed, etc., the length of the “latency” period chosen as the criterion to consider a paper's recognition “delayed” (ten full years or more after publication) is arbitrary. In fact, choosing papers with no citations (instead of 1, or 2, or using a percentage or field-specific threshold) limits the kinds of papers under scrutiny and defines as normal (i. e., non-delayed) the behavior of disciplines with rapid ageing and higher citation counts. Also, since the papers in the sleepers population did not all receive their first citation(s) at t + 11, but, stricto sensu, at a time >= t +11, the population is thus not perfectly homogeneous. Since we aimed to provide an overview of the phenomenon, however, we feel that it does not invalidate the results.
The study is also limited in time, doubly so as only papers published between 1963 and 1975 are under scrutiny, but also as the citation window was limited to start from t + 11 for sleepers, and end for both groups at t + 37. It is sufficient to provide an overview of the behavior of delayed recognition papers, but cannot claim to be exhaustive in the matter. A study covering a wider range of data and looking at a larger citation window could only provide a better picture of the effects over time.
Another limit is tied to the disciplinary clusters. The clustering itself is somewhat arbitrary (psychology, for example, could have been put alongside the social sciences instead of the more medical disciplines), and the clusters are of different sizes; comparison between clusters is therefore imperfect.
That being said, the results obtained provide an answer to the question asked at the beginning of this study, namely whether papers experiencing delayed recognition exhibit the same behavior as papers without such a latency period, or if they show a different, peculiar one – which is the case.
Conclusion
On the whole, our results show that papers whose recognition, measured by the first citation(s) received, come only after the passage of ten full years since publication behave differently with regard to subsequent citation accumulation. As opposed to the typical profile peaking two or three years after publication, followed by a long decline, papers experiencing delayed recognition, overall, immediately enter decline from the moment of their first – and often only – citation(s). In addition, on average, the percentage of their lifetime citations they receive, per year, is very similar to those of the reference group’s papers of a similar age (11+ years after publication), papers without an initial latency period. In other words, that latency period truly appears to be “lost time” with regard to citation activity. Papers showing delayed recognition follow the pattern expected of non-delayed papers, but with a gap. The question of when this effect might begin remains to be investigated, as if papers with different latency periods show the same behavior, the deeper cause might be related to the citation cycle. In other words, if a paper doesn’t get citations at the same pace as all the others, there will be a gap in the uncited years, but the basic pattern of citations remains unchanged.
Highly cited delayed-recognition papers, however, the subgroup to which the “sleeping beauties” belong, behave differently. They do not follow the overall behavior of their group, nor do they imitate that of the “classics” (papers highly cited from the start), but, from the moment of their first citations, begin to gather citations in a very pronounced, almost linear fashion. But this remains an extremely small subgroup. The sleepers, unlike the reference group, are virtually dominated by little-cited papers, suggesting that going uncited for 10 or more years equates to little chance of becoming highly cited thereafter. It again confirms that sleeping beauties are a very rare phenomenon and largely marginal in the overall scientific literature (Glänzel and Garfield, 2004).
References
Braun, T., Glänzel, W., and Schubert, A. (2010). On Sleeping Beauties, Princes and other tales of citation distributions... Research Evaluation, 19(3): 195-202. DOI: 10.3152/095820210X514210.
Cole, S. (1970). Professional Standing and the Reception of Scientific Discoveries. American Journal of Sociology 76(2): 286-306.
Costas, R., van Leeuwen, T. N., and van Raan, A. F. J. (2010). Is Scientific Literature Subject to a ‘Sell-By- Date’? A General Methodology to Analyze the ‘Durability’ of Scientific Documents. Journal of the American Society for Information Science and Technology, 61(2): 329–339. DOI: 10.1002/asi.21244.
Costas, R., van Leeuwen, T. N., and van Raan, A. F. J. (2013). Effects of the durability of scientific literature at the group level: Case study of chemistry research groups in the Netherlands. Research Policy 42: 886-894. DOI: 10.1016/j.respol.2012.11.006.
Finardi, U. (2013). On the time evolution of received citations, in different scientific fields: An empirical study. Journal of Informetrics 8: 13-24. DOI: 10.1016/j.joi.2013.10.003.
Glänzel, W., and Garfield, E. (2004). The myth of delayed recognition. Scientist 18(11): 8-9.
Glänzel, W., Schlemmer, B., and Thijs, B. (2003). Better late than never? On the chance to become highly cited only beyond the standard bibliometric time horizon. Scientometrics 58(3): 571-568.Heinze, T., Heidler, R., Heiberger, R. H., and Riebling, J. (2012). New Patterns of Scientific Growth: How Research Expanded After the Invention of Scanning Tunneling Microscopy and the Discovery of Buckminsterfullerene. Journal of the American Society for Information Science and Technology 64(4): 829-843. DOI: 10.1002/asi.22760.
Larivière, V., Archambault, É., Gingras, Y., and Vignola-Gagné, E. (2006). The place of serials in referencing practices: Comparing natural sciences and engineering with social sciences and humanities. Journal of the American Society for Information Science and Technology, 57(8): 997–1004. DOI: 10.1002/asi.20349.
Larivière, V., and Macaluso, B. (2011). Improving the Coverage of Social Science and Humanities Researchers’ Output: The Case of the Érudit Journal Platform. Journal of the American Society for Information Science and Technology 62(12): 2437-2442. DOI: 10.1002/asi.21632.
Levitt, J. M., and Thelwall, M. (2008). Patterns of annual citations of highly cited articles and the prediction of their citation ranking: A comparison across subjects. Scientometrics 77(1): 41-60. DOI: 10.1007/s11192-007-1946-y. Li, J. (2014). Citation curves of “all-elements-sleeping-beauties”: “flash in the pan” first and then “delayed recognition”. Scientometrics 100: 595-601. DOI: 10.1007/s11192-013-1217-z.
Li., J., Shi, D., Zhao, S. X., and Ye, F. Y. (2014). A study of the “heartbeat spectra” for “sleeping beauties”. Journal of Informetrics 8: 493-502. DOI: 10.1016/j.joi.2014.04.002.
Ohba, N., and Nakao, K. (2012). Sleeping beauties in ophthalmology. Scientometrics 93: 253-264. DOI: 10.1007/s.11192-012-0667-z.
Ponomarev, I. V., Williams, D. E., Hackett, C. J., Schnell, J. D., and Haak, L. L. (2014). Predicting highly cited papers: A Method for Early Detection of Candidate Breakthroughs. Technological Forecasting & Social Change
81: 49-55. DOI: 10.1016/j.techfore.2012.09.017.
Van Dalen, H. P., and Henkens, K. (2005). Signals in science – On the importance of signaling in gaining attention in science. Scientometrics 64(2): 209-233.
Van Raan, A. F. J. (2004). Sleeping Beauties in science. Scientometrics 59(3): 467-472.
Wallace, M. L., Larivière, V., and Gingras, Y. (2009). Modeling a century of citation distributions, Journal of Informetrics 3(4): 296-303. DOI: 10.1016/j.joi.2009.03.010.
Appendix 1. Distribution of papers and citations by discipline
Papers Citations
sleepers reference group sleepers reference group
papers % papers % citations % citations %
Arts 352 0.28% 1,161 0.05% 627 0.21% 4,760 0.01%
Biology 13,836 10.87% 175,725 7.24% 37,064 12.38% 3,380,816 5.88%
Biomedical research 12,518 9.83% 395,517 16.30% 27,327 9.13% 14,073,008 24.50%
Chemistry 17,140 13.47% 390,407 16.09% 40,522 13.53% 7,942,283 13.82%
Clinical medicine 24,168 18.99% 631,721 26.03% 60,616 20.24% 16,238,202 28.26%
Earth and space 4,157 3.27% 82,583 3.40% 10,758 3.59% 2,334,339 4.06%
Engineering and tech. 12,674 9.96% 161,416 6.65% 29,739 9.93% 2,033,496 3.54%
Health 1,500 1.18% 16,527 0.68% 2,764 0.92% 193,944 0.34% Humanities 4,340 3.41% 14,742 0.61% 7,710 2.57% 89,249 0.16% Mathematics 6,797 5.34% 62,880 2.59% 19,402 6.48% 980,046 1.71% Physics 9,841 7.73% 303,953 12.53% 23,532 7.86% 7,282,059 12.68% Professional fields 7,171 5.63% 47,508 1.96% 15,079 5.04% 438,419 0.76% Psychology 3,735 2.93% 77,102 3.18% 7,618 2.54% 1,660,256 2.89% Social sciences 9,055 7.11% 65,411 2.70% 16,662 5.56% 799,332 1.39% Unknown 0 0.00% 11 0.00% 0 0.00% 645 0.00% Total 127,284 100.00% 2,426,664 100.00% 299,420 100.00% 57,450,854 100.00%
Appendix 2. Distribution of papers and citations by disciplinary clusters
Papers Citations
sleepers reference group sleepers reference group
papers % papers % citations % citations %
medicine 41,921 32.94% 1,120,867 46.19% 98,325 32.84% 32,165,410 55.99% science 51,771 40.67% 1,015,548 41.85% 131,278 43.84% 21,919,543 38.15% arts, hum., soc. sc. 13,747 10.80% 81,314 3.35% 24,999 8.35% 893,341 1.55% app. disc. 19,845 15.59% 208,924 8.61% 44,818 14.97% 2,471,915 4.30% Total 127,284 100.00% 2,426,653 100.00% 299,420 100.00% 57,450,209 100.00%