CO2 emission from mangroves’ surrounding waters
1
0
0
Texte intégral
(2)
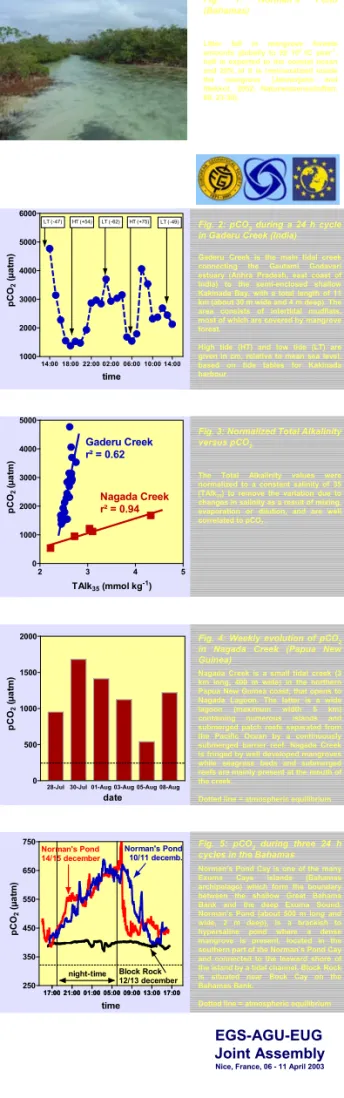
Figure
Documents relatifs
CENTER FOR INTERDISCIPLINARY RESEARCH ON MEDICINES 10 Reactor sc CO 2 Lipids in aqueous buffer in supercritical conditions Reactor Liposomes suspension Legend
Des troubles neurologiques sont plus fréquents chez les enfants atteints d’une morphée «en coup de sabre» et chez les adultes présentant la morphée atrophique hémifaciale
Le pharmacien ou l’étudiant en 6 ème année de pharmacie doit prendre rendez-vous avec un patient ayant un traitement avec les anticoagulants oraux directs.
Anthony Riffe1 110 Teachers meet researchers Benjamin
Here we take the external field of the host galaxy NGC1052 into account to predict the expected velocity dis- persion of NGC1052-DF2 in MOND.. This range of variation follows
Afin de comprendre pourquoi la durée du jour affecte le développement de la culture (par exemple la durée du cycle) et semble ne pas affecter les rendements, nous avons
