February 4, 2019
The Solar Orbiter Heliospheric Imager (SoloHI)
R. A. Howard
1?, A. Vourlidas
2, R. C. Colaninno
1, C. M. Korendyke
1, S. P. Plunkett
1, M. T. Carter
1, D. Wang
1, N.
Rich
1, S. Lynch
1, A. Thurn
1, D. G. Socker
1, A. F. Thernisien
1, D. Chua
1, M. G. Linton
1, S. Koss
1, S. Tun-Beltran
1, H.
Dennison
1, G. S. Stenborg
1, D. R. McMullin
3, T. Hunt
3, R. Baugh
3, G. Cli
fford
4, D. Keller
5, J. R. Janesick
5, J. Tower
5,
M. Grygon
5, R. Farkus
5, R. Hagood
6, K. Eisenhauer
6, A. Uhl
6, S. Yarulshami
6, L. Smith
6, P. C. Liewer
7, M. C. Velli
8,
J. Linker
9, V. Bothmer
10, P.Rochus
11, J.-P. Halain
11, P. L. Lamy
12, F. Auchere
13, R. A. Harrison
14, S. Patsourakos
15,
O. C. St. Cyr
16, H. Gilbert
16, H. Maldonado
16, C. Mariano
16, and J. Cerullo
171 Naval Research Laboratory, Washington, DC, 20375, USA
2 Johns Hopkins University Applied Physics Laboratory, Laurel, MD, 20723, USA 3 Space Systems Research Corporation, Alexandria, VA, 22314, USA
4 Silver Engineering, Inc., Melbourne, FL, 32904, USA 5 SRI International, Princeton, NJ, 08540, USA 6 SGT Technologies, Greenbelt, MD 20770, USA 7 Jet Propulsion Laboratory, Pasadena, CA 91011, USA
8 University of California Los Angeles, Los Angeles, CA 90095, USA 9 Predictive Sciences Inc., San Diego, CA, 92121, USA
10 University of Gottingen, Gottingen, Germany
11 Centre Spatiale de Liege, University of Liege, Liege, Belgium
12 Laboratoire Atmosphères, Milieux, Observations Spatiales, Guyancourt, France 13 Institut d’Astrophysique Spatiale, Orsay, France
14 Rutherford Appleton Laboratory, Harwell Oxford United Kingdom 15 University of Ioannina, Ioannina, Greece
16 NASA Goddard Space Flight Center, Greenbelt, MD 22070, USA 17 ASRC Federal Space and Defense, Beltsville, MD 20705. USA Received February 4, 2019; accepted Mon DD, 2019
ABSTRACT
Aims.We present the design and pre-launch performance of the Solar Orbiter Heliospheric Imager (SoloHI) which is an instrument prepared for inclusion on the ESA/NASA Solar Orbiter mission, currently scheduled for launch in 2020.
Methods.The goal of this paper is to provide details of the SoloHI instrument concept, design and pre-flight performance to give a potential user of the data a better understanding of how the observations are collected and the sources that contribute to the signal. Results.The paper discusses the science objectives, including the SoloHI-specific aspects, before presenting the design concepts, including the optics, mechanical, thermal, electrical, and ground processing. Finally, the list of planned data products is also presented. Conclusions.The performance measurements of the various instrument parameters meet or exceed the requirements derived from the mission science objectives. SoloHI is poised to take its place as a vital contributor to the science success of the Solar Orbiter mission.
Key words. Sun:corona/ Zodiacal Light / Space Vehicles:Instruments / Telescopes / Instrumentation:Miscellaneous
1. Introduction
1.1. Overview
The Solar Orbiter mission (Müller et al. 2013,2019), currently scheduled to launch in February 2020, will study the inner he-liosphere with a set of remote sensing instruments observing the Sun and solar corona and a set of in-situ instruments mea-suring the solar wind around the spacecraft. Together, the ten Solar Orbiter instruments will provide a complete description of the plasma making up the solar wind - its origin, transport and composition - vastly improving on the Helios (Schwenn & Marsch 1990) mission launched in 1974. Solar Orbiter reaches a minimum perihelion of 0.28 AU after a series of gravity assists from Venus and Earth, which will also raise the inclination of ? Corresponding author: R. A. Howard e-mail: russ.howard@nrl.navy.mil
the orbital plane to at least 30◦from the ecliptic plane (
Garcia-Marirrodriga & et al. 2019). The Solar Orbiter minimum per-ihelion of 0.28 AU is very similar to the Helios perper-ihelion of 0.3 AU, but combined with the out of the unique ecliptic view-ing, Solar Orbiter will address a fundamental question of solar physics: How does the Sun create and control the heliosphere?
Solar Orbiter will combine in-situ measurements with high-resolution remote-sensing observations of the Sun in a systemic approach to resolve fundamental science problems needed to achieve this objective. These problems include the sources of the solar wind, the causes of eruptive releases of plasma and magnetic field from the Sun known as coronal mass ejections (CMEs), the evolution of CMEs and their interaction with the ambient solar wind flow, and the origins, acceleration mecha-nisms and transport of solar energetic particles that may be haz-ardous to both human explorers and robotic spacecraft that
op-erate in the highly variable environment outside of Earth’s mag-netosphere.
The ten instruments on board the Solar Orbiter mission (Müller et al. 2019) include six remote sensing (RS) instruments observing the solar disk and corona, and four in-situ (IS) instru-ments measuring the plasma and magnetic field at the spacecraft. Two of the instruments, one IS and one RS, will observe the re-gion between the Sun and spacecraft - the Radio and Plasma Wave instrument (RPW, Maksimovic et al. 2019) and the So-lar Orbiter Heliospheric Imager (SoloHI). They will provide a link between the remote and local observations and enable the determination of the physical connectivity between the Sun and the solar wind. The RS telescope instruments have fixed optics which means that they observe a fixed angular field of view but the field, in terms of solar radii, varies as a function of heliocen-tric distance thanks to the elliptical orbit of the mission.
The combination of remote sensing instruments and in-situ instruments to study the Heliosphere is unique. The Ulysses mis-sion (Wenzel et al. 1992;Marsden et al. 1986), launched in 1990, was in orbit about the Sun at high latitude and had a good com-plement of in-situ instruments but no remote sensing ones. The Helios spacecraft had one photometer that measured the Zodia-cal Light (ZLP;Leinert et al. 1982) in addition to a complement of in-situ instruments. These excellent in-situ observations were often coupled with Earth-orbiting remote sensing instruments to link solar structures to in-situ ones (e.g.Sheeley et al. 1985) to great advantage.
The ZLP made excellent measurements of the light scat-tered by dust in the inner heliosphere, which is called the Zo-diacal light (ZL) far from the Sun, and the F-corona close to the Sun. The ZLP found the ZL to be constant and symmetric. However, in a series of papers using the STEREO/HI instrument Stenborg and colleagues (Stenborg & Howard 2017b;Stenborg et al. 2018; Stauffer et al. 2018) found small deviations from constancy and symmetry.
The SoloHI is designed, built and operated by the U.S. Naval Research Laboratory. It will image the inner heliosphere over a wide field of view (FOV) by observing visible sunlight scattered by electrons in the solar wind and interplanetary dust. It builds on the success of the Heliospheric Imagers (Eyles et al. 2009) in the SECCHI suite (Howard et al. 2008) of telescopes on the STEREO mission (Kaiser et al. 2008), launched in 2006. The 40◦ circular FOV of SoloHI is centered on the orbital plane in latitude but it is offset from the Sun in longitude spanning elon-gations from 5.4◦to 44.9◦to the east of the Sun (i.e. in the anti-ram direction), as viewed by the Solar Orbiter spacecraft.
Scattering of photospheric light from dust will also con-tribute to the SoloHI signal. From 1 AU, this component is up to two orders of magnitude brighter than the electron-scattered component. However, we expect that the closer vantage point and the possibility of seeing dust sublimation (Sec.2.5) will de-crease the F-coronal signal. SoloHI will image the large-scale structure of the electron corona and allow observers to follow transient structures as they propagate in the inner heliosphere and ultimately pass over Solar Orbiter or other similar instru-mentation such as the Parker Solar Probe (PSP;Fox et al. 2016)). The Wide Field Imager for Solar Probe (WISPR;Vourlidas et al. 2016) on the PSP has similar characteristics to the SoloHI. To-gether, SoloHI and WISPR will provide the crucial link between the remotely sensed and in-situ observations from Solar Orbiter, PSP and other inner heliospheric probes.
In the following sections we describe the SoloHI instrument. In Section 2 we present the Science Objectives, including the SoloHI unique objectives. In Section 3 we present an overview
of the instrument. In Section 4, we describe the instrument de-sign. In Section 5, we describe the operations concept, the data processing and the data products, and the ground system. Finally, we summarize in Section 6.
2. Science Objectives
The SoloHI science investigation has four science objectives that flow directly from the Solar Orbiter mission objectives (Müller et al. 2019) but are adapted to the SoloHI’s measurement ap-proach. Below are the objectives, in the form of questions, tar-geted by SoloHI. They are described in more detail in the rest of the section:
– What drives the solar wind and where does the coronal mag-netic field originate?
– How do solar transients drive heliospheric variability? – How do solar eruptions produce energetic particle radiation
that fills the heliosphere?
– How does the solar dynamo work and drive connections be-tween the Sun and the heliosphere?
The Solar Orbiter mission design is quite complex, involv-ing perihelion and aphelion passages which do not always occur at the same heliocentric distance and/or with the same inclina-tion relative to the ecliptic. For an imaging instrument such as SoloHI, these orbital variations imply both a changing field of view, in terms of heliospheric coverage, and varying spatial res-olution, thus changing the optimum observing strategy and sci-ence focus for a given objective (e.g., shock formation versus tur-bulence studies). To appreciate the flexibility and performance of the proposed SoloHI instrument and to facilitate comparison with similar instruments at Earth orbit, we express the FOV and spatial resolution in terms of their 1 AU equivalent quantities using the symbol, AUeq, for shorthand.
To address the science objectives, a series of Science Activ-ity Plans (SAPs) have been developed (Zouganelis et al. 2019). These plans define the instruments and their individual plans for addressing each of the SAPs. They are similar to the success-ful Joint Observing Programs developed for the SKYLAB and SOHO missions (Holt & da Silva 1977;Domingo et al. 1995). All the instruments have flexible capabilities that can be adjusted to explore this new region of space. To coordinate the modes and to help plan for the inputs to the SAPs, two working groups were formed, one for the RS instruments (Auchere et al. 2019) and another for the IS instruments (Horbury et al. 2019). An-other input into the SAPs is coordination with the PSP (Velli et al. 2019), which has overlapping science objectives. The co-ordination of all of the inputs occurs within the Solar Orbiter Op-erations Working Group (SOWG;Zouganelis et al. 2019). One focus of the science planning activity is to identify what regions on the Sun might connect with the spacecraft. To assist in this effort, with the development of analysis tools and coordination with modeling, the Modeling and Data Analysis Working Group (MADAWG) was formed (Rouillard et al. 2019).
2.1. What Drives the Solar Wind and Where Does the Coronal Magnetic Field Originate?
White-light imaging with the Large Angle and Spectrographic Coronagraph (LASCO,Brueckner et al. 1995) and the Sun-Earth Connection Coronal and Heliospheric Investigation (SECCHI, Howard et al. 2008) coronagraphs have revealed a variety of
Fig. 1. Velocity measurements of streamer blobs with LASCO. The SoloHI FOV during perihelion passages is also shown. The solid line is a fit of the blobs to an exponential described in the text.
unexpected dynamical phenomena in the outer corona, includ-ing plasma blobs ejected continually from the cusps of stream-ers (Sheeley et al. 1997; DeForest et al. 2018), ray-like struc-tures pervading the streamer belt (Thernisien & Howard 2006), swarms of small-scale inflows (e.g.Sheeley & Wang 2014) that occur during times of high solar activity, and coronal jets (Vibert et al. 2016), in which plasma and magnetic flux are exchanged between closed and open field regions of the corona. More re-cently, a direct association has been made between the outward flowing "blobs" and a corresponding inflow of "coronal rain" (Sanchez-Diaz et al. 2017), supporting the idea that "blobs" are the result of magnetic reconnection at the top of helmet stream-ers associated with the neutral line. Such reconnection processes have a bearing on questions as diverse as the formation and evo-lution of the heliospheric plasma/current sheet, the origin of the slow solar wind, the heliospheric magnetic flux budget, the solar-cycle evolution of the coronal field, and the rigid rotation of coronal holes.
While the reconnection sites will be observed with the Multi Element Telescope for Imaging and Spectroscopy (Metis; An-tonucci et al. 2019) coronagraph and the Extreme Ultraviolet Im-ager (EUI;Rochus & et al. 2019) in the inner corona, SoloHI ob-servations are essential for measuring the outer coronal and he-liospheric signatures of these events. During perihelion, SoloHI will be able to trace the streamer blobs formed in the Metis FOV to much greater heights. The large uninterrupted FOV of SoloHI enables more accurate velocity and mass measurements, com-pared to LASCO or SECCHI, and the increased resolution and sensitivity of SoloHI will reduce the scatter in the outer veloc-ity measurement shown in Figure1. The three parameters at the top of the figure are the parameters in the fit shown as the solid line. The equation describing the flow speed is V2 = V2
0 [1
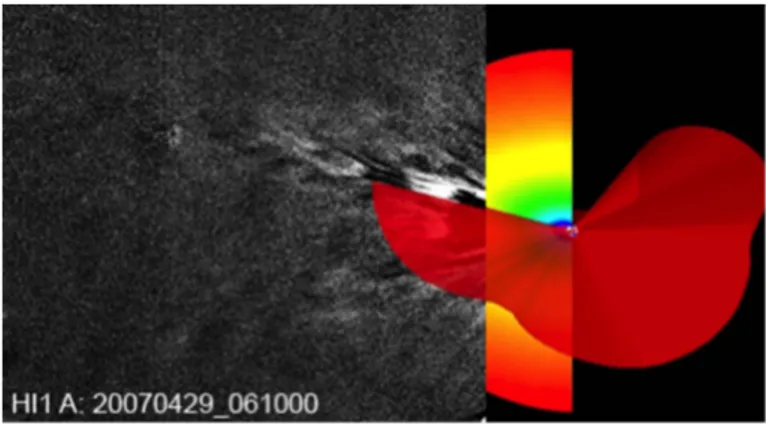
-Fig. 2. Comparison of SECCHI/HI observation of solar wind structures (grey scale) with the model-derived location of the HCS (red surface). The meridional slice shows the model velocity which is not discussed here.
e−(R−R1)/R0]. SoloHI will measure the velocity and acceleration
profile of the transient slow solar wind flows and assess their role in the slow solar wind mass supply.
SoloHI will investigate the structures that comprise the helio-spheric plasma sheet (HPS) and their solar origins, and the rela-tion of the HPS to the heliospheric current sheet (HCS). For this, SoloHI will image the extension of streamer structures far into the heliosphere and compare their measured location and den-sities to in-situ measurements and models. Observations from the STEREO/HI telescopes have shown that this is possible. In Figure2, taken fromVourlidas & Riley(2007), the location of the HCS, based on an MHD simulation, is projected onto a 2-hour SECCHI/HI running difference image showing quiescent solar wind structures. The figure shows that the largest intensity (therefore density) variability corresponds to locations nearest the HCS. In other words, SECCHI/HI can image the HPS di-rectly and detect its intermittent structure. These measurements can identify the sources of the solar wind structures when com-pared with in-situ abundance measurements. SoloHI will have better sensitivity and spatial resolution than HI (see Table 1 in (Vourlidas et al. 2016) because it will fly closer, and in some cases, through the structures. This will allow us to trace the HPS boundaries, their evolution and their relation relative to the HCS in much greater detail than possible with STEREO. When com-bined with the in-situ observations from the Solar Orbiter, and/or PSP, the SoloHI observations will provide strong constraints on the origin and evolution of the solar wind plasma in the helio-sphere.
Observations of the scattered light intensity also enable mea-surements of the solar wind density turbulence (e.g. Marsch 2000) directly from the SoloHI images. Because the observed emission is related to the number of electrons along the line of sight, intensity variations provide a direct measure of solar wind density variations, which can be compared to Earth-based interplanetary scintillation or PSP/Solar Orbiter in-situ measure-ments. SoloHI will run a specific observing program for this case (wave turbulence programs in Figure21). For example, we can use the SoloHI Low Latency synoptic maps and MHD modeling to predict when PSP will cross a solar wind structure of interest (e.g., an HPS boundary or a fast stream interface). For a spe-cific time interval, say 4 hours before the PSP passage, SoloHI will obtain images over a restricted FOV (about 1.5◦x5◦) around
the region of interest. A 2D power spectrum of the density fluc-tuations can then be constructed from the imaging time series.
Such a program is made possible by the programming flexibility offered by the SoloHI electronics (see Section5).
2.2. How Do Solar Transients Drive Heliospheric Variability? To understand the propagation and evolution of CMEs into the heliosphere, we have until recently relied on MHD models to fill in the gap between the imaging observations restricted to small elongations from the Sun and situ measurements of in-terplanetary CMEs (ICMEs) at 1 AU. The gap has been filled, since 2007, with the observations from the heliospheric imagers onboard STEREO. The SECCHI/HIs have imaged and tracked a variety of density structures ranging from ICMEs (Rouillard et al. 2009a) to stream interaction regions (SIRs;Sheeley et al. 2008) to small flux ropes entrained in the SIRs (Rouillard et al. 2009b). We have found that CMEs rotate, deflect, distort (Liewer et al. 2015;Isavnin et al. 2014;Nieves-Chinchilla et al. 2012), and interact with each other (e.g.Shen et al. 2013) in the inner heliosphere.
Somewhat surprisingly, the uninterrupted corona-to-heliosphere imaging from SECCHI has not brought closure to many questions. The most glaring is the lack of agreement between in-situ and imaging-based reconstructions of CMEs (e.g. Wood et al. 2017). The speed profile, particularly of medium speed (<900 km/s) ICMEs, is difficult to establish (Colaninno et al. 2013). CME deformation may be nothing more than projection effects (Nieves-Chinchilla et al. 2012). These problems arise partially from the difference in the spatial scales detected in-situ and in the HIs and partially from the difference in the location of the measurements. Many events are difficult to track beyond the middle of the HI-1 FOV, above about 50-60 R , for example. The long exposure times (20 – 60 mins)
and the use of running difference schemes to increase contrast obscure the fine structure within the ICMEs making it harder to associate in-situ and imaging features. Solar Orbiter and PSP offer an opportunity to solve some of these problems. SoloHI will extend the field of view of the SECCHI HI-1 to elongations greater than 40◦ from the Sun with increased sensitivity. It will also observe CMEs much closer to the sun, as they go over PSP (and Solar Orbiter) thus reducing the uncertainty, due to evolution, between remote sensing and in-situ analyses. WISPR and SoloHI may observe the same CME from two very different vantage points for the first time.
2.3. How Do Solar Eruptions Produce Energetic Particle Radiation that Fills the Heliosphere?
CME-driven shocks play a central role in determining the en-ergetic particle populations in the heliosphere and in driving geospace storms. They are known to accelerate solar energetic particles (SEPs) to high energies (e.g., Reames 1999;Kahler 2001), even GeV energies (Bieber et al. 2004) during the so-called gradual SEP events. The geometry of the shock seems to play a further role in the observed variability of the spec-tral characteristics and composition of SEPs (Tylka et al. 2005). Many of these shock-related parameters (geometry, compression ratio, speed) are available or can be deduced from in-situ mea-surements at 1 AU. Recent SECCHI results (Kwon & Vourlidas 2018) demonstrate that some of these can finally be measured remotely in the low corona where the highest energy particles originate (≤2 R ). The large scatter in the correlation between
CME speeds and SEP peak intensities suggests a complex in-terplay among the CME speed, the acceleration mechanism(s)
and the ambient environment. Much work has focused on the role of the variations of the environment through which the CME shocks and particles propagate (Gopalswamy et al. 2004;Kahler & Vourlidas 2005). Therefore, the height of formation of the shock, the 3-dimensional extent of the CME, and the existence or not of a preceding event are necessary observations for a bet-ter understanding of the generation and propagation of SEPs. SoloHI can provide these crucial observations, because it can image CMEs and their associated shocks at the coronal heights where the particles originate (≤10 R ) with sufficient spatial
res-olution to resolve the locations of the CME-driven shocks. The optimal period for such observations is during perihelion passages. For example, at the minimum perihelion, the SoloHI FOV, for the standard observation mode, extends from 5.2 to 42 R with 52 arcsec resolution (AUeq) for 2x2 binned images.
In other words, SoloHI is similar to a LASCO/C3 coronagraph with 2x better spatial resolution. SoloHI will readily observe and characterize the evolution of shocks. For example, a cadence of 30 min will allow 6 observations of a 2000 km/s CME in the SoloHI FOV during perihelion. The SoloHI inner FOV extends below 10 R for all heliocentric distances within 0.5 AU, and
therefore contributes to the SEP analysis for a much larger part of the Solar Orbiter orbit than just at perihelion. For these parts of the orbit, SoloHI will be able to observe shocks and CMEs as they go over PSP or other heliospheric probes.
To address the spatial extent of the shocks, the SoloHI obser-vations can be combined with simultaneous obserobser-vations from the SECCHI coronagraphs and imagers, WISPR, LASCO, or other near-Earth assets. The multipoint observations will be used to reconstruct the 3-dimensional structure of the CMEs and their associated shocks as shown inKwon & Vourlidas(2018).
2.4. What is the Three-Dimensional Structure of the Heliosphere?
Our knowledge of the spatial extent and configuration of CMEs has been greatly improved thanks to 3D reconstructions afforded by the multi-viewpoint imaging from the SECCHI instruments (e.g.Thernisien & Howard 2006;Thernisien et al. 2009,2011). LASCO provided a third viewpoint to SECCHI’s. But there is a catch. All three lines of sight lay very close to the ecliptic plane providing partially redundant information. Having lost contact with STEREO-B on 1 October 2014, 3D reconstructions cur-rently rely on the aging LASCO telescopes for the second view-point.Newmark et al.(2004) have shown that the resulting 3D reconstructions have large longitudinal uncertainties, which can be improved only with the addition of a viewpoint away from the ecliptic plane. These problems are exacerbated for 3D streamer reconstructions because their longitudinal boundaries are more difficult to define than CMEs. However, streamers are long-lived coronal structures, lasting for several rotations. We can rely on the solar rotation to provide additional viewpoints as shown by Frazin & Kamalabadi(2005). A temporal resolution of about 4.7 days (1/6 of the solar rotation) can be achieved with data from 3 satellites. Naturally, the rotational tomography approach is best suited for coronal reconstructions during periods of minimum activity although new techniques, such as Kalman filtering, seem to be able to capture some of the short-term evolution of coronal structures (Butala et al. 2005).
SoloHI will provide completely new information and con-straints for understanding the 3D structure of the corona and CMEs. It will observe the heliosphere from out-of-ecliptic view-points, at varying latitudes and heliocentric distances, thus pro-viding strong constraints on the longitudinal extent of the
struc-tures. The Solar Orbiter-Sun distance plays an important role in the data analysis because it affects the visibility of the Thom-son scattered features in the images (see2.5.2). In essence, the varying distance acts as a filter emphasizing structures that are progressively nearer the Thomson Surface (Vourlidas & Howard 2006) as it approaches the Sun. When combined with simul-taneous white light observations from another viewpoint (e.g., LASCO, STEREO and/or PSP), the combined analysis should provide very strong constraints on the size of coronal features. The Solar Orbiter mission possesses another important advan-tage; within two weeks the spacecraft sweeps between its two latitudinal extremes (i.e. southern and northern extremes) thus enabling tomographic reconstructions of streamers using the SoloHI data alone with the same temporal resolution achievable currently by the LASCO instrument.
SoloHI will be the first instrument to provide high resolu-tion imaging observaresolu-tions of Thomson-scattered emission from out of the ecliptic. SoloHI will be able to observe the interaction of the propagating CMEs with the solar wind and other CMEs from a unique vantage point. Depending on the inclination of the solar dipole during the high-latitude passes, SoloHI will be able to make a direct measurement of the longitudinal extension of the CME, the interaction of the CME with the boundaries of coronal holes and the interaction between CMEs, through a shorter line of sight than is possible from the ecliptic. The shorter line of sight will minimize uncertainties in these mea-surements due to the effect of overlapping structures. The ques-tion of how the solar wind variaques-tions are linked to the Sun at all latitudes encompasses the same detailed issues addressed in 2.2, but from different, out-of-the-ecliptic viewpoints. The con-nection between the in-situ solar wind and its solar sources will be analyzed with Solar Orbiter’s measurements of solar wind speed, energy flux, magnetic field, chemical composition, and ionization state as functions of latitude. To get the full benefit of the out-of-ecliptic viewpoint in understanding the structure and dynamics of the corona, the SoloHI observations must be com-bined with the Metis, EUI, and SPICE (SpiceConsortium & et al. 2019) observations. Using the coronal imagers, we can observe the initiation and evolution of CMEs and more easily determine the spatial relation between CMEs and their coronal sources. At or near perihelion, when the SoloHI FOV enters the low corona, the combination with Metis and EUI will allow us to observe polar plumes and small-scale structures in the polar and equa-torial coronal hole regions. SoloHI provides the connecting link between the in-situ and solar surface measurements from Solar Orbiter in the inner heliosphere and the inner corona.
2.5. SoloHI Unique Science
The visible emission at heights above 5 R is dominated by
scat-tering from interplanetary dust, the F-corona. It is a nuisance for coronal studies as it obscures the signal from CMEs and coronal streamers. Accurate removal of the F-corona is essen-tial for the derivation of coronal density structure (e.g. Hayes et al. 2001), but the current F-coronal models are insufficient, as LASCO-C3 and SECCHI/HI-1 observations have shown. Sten-borg & Howard(2017b) andStenborg et al. (2018) found that the shape and intensity vary significantly as functions of ecliptic longitude and heliocentric distance and that the dust cloud is not a simple axisymmetric structure.
A different approach is required for the continuously varying scene in the SoloHI images. In preparation for the mission, a new technique to determine the background has been demonstrated successfully on the SECCHI/HI images (Stenborg & Howard
2017a). It uses a single image to generate a background model, under the assumption that the F-corona varies monotonically and smoothly.
In addition to the in-ecliptic views, which were well ob-served by SECCHI/HI and Helios (Leinert et al. 1981,1998), Solar Orbiter’s orbit will become inclined by at least 30◦
en-abling us to extract quantitative measurements of the F-corona from a different viewpoint, yielding a more complete definition of the 3D distribution of dust in the inner heliosphere, and per-haps a short-term, time-dependent variation. We do not know, for example, whether comets are an important source of dust in the inner heliosphere. The detection of a significant popula-tion of large particles at high ecliptic latitudes would support this idea (Delsemme 1976). The combination of the SoloHI remote-sensing F-corona observations with dust models may allow the estimation of the size distribution of the dust in the inner helio-sphere. In particular, the analysis of the changes in the distribu-tion of particles below a few micrometers will yield informadistribu-tion about the effects of solar radiation and plasma environment on the interplanetary dust (Mann et al. 2000;Jones et al. 2018).
A dust ring has been found around Venus (Leinert & Moster 2007;Jones et al. 2013,2017), similar to the rings around many solar system objects. Do such rings exist around or in the neigh-borhood of Mercury? Finally, the SoloHI F-corona observations during the maximum of cycle 25 from high latitudes and within 0.5 AU provide an unprecedented, and probably unique, pos-sibility to investigate whether CMEs interact in any significant way with the interplanetary dust and whether we can use this interaction to probe the CME magnetic fields, as suggested by Ragot & Kahler(2003), who predicted that the strong transient magnetic field in a CME can produce a temporary displacement of a small region of dust particles.
2.5.1. Signal to Noise
The total diffuse sky brightness observed by SoloHI is the sum of contributions from the F-corona (scattering from dust) and K-corona (scattering from electrons in the solar wind and CMEs), as well as integrated starlight from unresolved stars. The dom-inant contribution throughout the SoloHI FOV comes from the F-corona. In addition, numerous bright stars will be resolved as individual point sources of light. These stars will be removed from the images using techniques that have been developed and successfully implemented on SECCHI/HI.
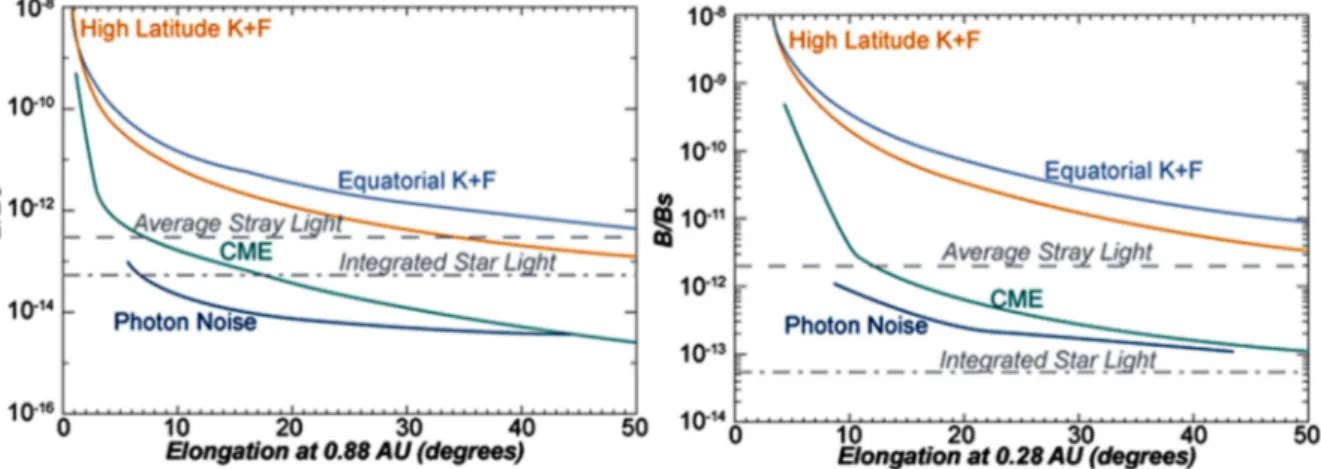
The fundamental observational requirement is to obtain im-ages with sufficient photometric precision to discriminate the K-corona, and its fluctuations (e.g., CMEs), from the other con-tributions to the total signal. Figure3 shows a comparison of the 1-σ detection limit for the SoloHI with the expected signals. The detection limit shown here is for a single pixel and an ex-posure of 30 minutes at aphelion and 30 seconds at perihelion. The expected contribution of the F-corona was determined from the model ofKoutchmy & Lamy(1985). The integrated starlight varies considerably with galactic latitude and longitude; an aver-age contribution over the SoloHI FOV is shown in Figure3. The expected contribution from CMEs is from Helios measurements byJackson et al. (1985) and from SECCHI/HI measurements. The 1-σ detection limit remains below the expected CME signal over the full FOV. A signal-to-noise ratio (SNR) of 5 per spatial resolution element is required for threshold detection of a sim-ple, known a-priori target on a flat background (Rose 1948; Bar-rett 1990), and substantially higher photon statistics (SNR>30) are required for more complex or unknown targets.
Fig. 3. Expected contributions to the SoloHI signal as a function of elongation angle for perihelion (0.28 AU) and aphelion (0.88 AU). The 1-σ photon noise detection limit per pixel is shown for an exposure of 30 min at aphelion and 30 sec at perihelion.
Fig. 4. Sensitivity map of the Thomson scattering emission for the Solar Orbiter-Sun geometries at perihelion. Each number denotes a location in the orbit (‘2’ is perihelion of 0.28 AU, while ‘1’ and ‘3’ are both at 0.34 AU). The 3 arcs in each color mark the locus of the 5%, 50%, and 95% brightness integrals along the line of sight. The extents of the arcs mark the SoloHI FOV. The dotted lines show the direction of the Parker Spiral for a 300 km/s wind.
These criteria are easily met over most of the SoloHI FOV. Near the outer part of the field, binning of pixels and/or longer integration times will be used to enhance the desired signal. At perihelion and/or in the inner part of the field, substantially higher cadence using subframes can be achieved without any degradation in resolution.
2.5.2. Thomson Surface Considerations
Solar wind features at progressively large angular distances from the Thomson surface scatter less than features close to the sur-face. Therefore, the SoloHI measurement sensitivity and its scene coverage are defined by the Thomson surface that varies with the Sun-observer distance (Vourlidas & Howard 2006).
Figure4shows an estimate of the SoloHI scene coverage for 3 SoloHI orbital positions along the orbit for the minimum
per-ihelion, indicated by a number and a color . There are 3 curves for each SoloHI location that are plotted with the same color and define the distance along the SoloHI line-of-sight, where the integrated scene brightness reaches 5%, 50%, and 95% of its total brightness integral. 90% of the scene brightness captured by the SoloHI instrument lies between the 2 outermost solid-line curves. The numbers in Figure4refer to separate locations along the orbit. ‘2’ is at the orbit perihelion of 0.28 AU, while ‘1’ and ‘3’ are both at 0.34 AU, on the inbound and outbound parts of the orbit. Any arc is indicating the location in the FOV, with the outer point on the arc being the largest elongation in the FOV and the inner point being the smallest elongation. The orbital transit time from position ‘1’ to position ‘3’ is approxi-mately 17.6 days. As the SoloHI orbital position approaches its perihelion (position ‘2’), the SoloHI instrument primarily mea-sures Thomson-scattered light from within 40 R of Sun center
and therefore becomes a local imager. This behavior of the scat-tering is very different than that at 1 AU.
The PSP orbits have perihelia from 35 R to 9. 8 R . Be-cause both PSP and Solar Orbiter are encounter missions, there is a small but finite probability that PSP will be in the field of view of SoloHI. When it is, Figure4demonstrates that SoloHI will easily detect the features passing over PSP while being sen-sitive to the solar wind flowing towards Solar Orbiter. This will provide an absolutely unique opportunity for joint observations.
3. Instrument Overview
SoloHI will perform remote observations of the Thomson-scattered white-light from the solar wind plasma of the inner corona with unprecedented resolution and cadence. SoloHI is a single, white light telescope of 20◦half angle with the inner limit
of the FOV at an elongation of 5◦from Sun center. The objec-tive lens has a 40◦FOV and images the solar wind onto a matrix
of four CMOS Advanced Pixel Sensor (APS) detectors with an effective total area of 3920x3920 pixels.
As the Solar Orbiter approaches the Sun, the spatial resolu-tion will increase relative to the resoluresolu-tion at 1 AU and the ab-solute FOV correspondingly will decrease relative to 1 AU. At perihelion the SoloHI will have the same effective resolution as the SOHO LASCO/C2 coronagraph with a larger FOV (6-60 R )
than the LASCO/C3 coronagraph and a higher signal-to-noise ratio than C3.
The key design aspects of SoloHI are to reject light from the solar disk to see the faint coronal signal with a good
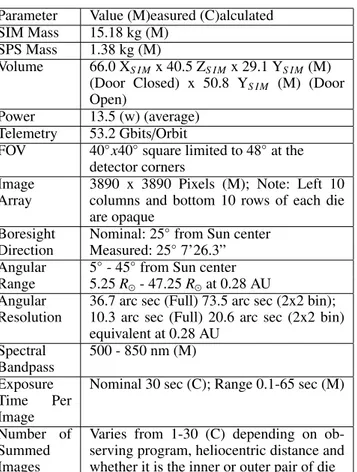
signal-Table 1. SoloHI Instrument Parameters
Parameter Value (M)easured (C)alculated SIM Mass 15.18 kg (M)
SPS Mass 1.38 kg (M)
Volume 66.0 XS I M x 40.5 ZS I Mx 29.1 YS I M(M)
(Door Closed) x 50.8 YS I M (M) (Door
Open)
Power 13.5 (w) (average) Telemetry 53.2 Gbits/Orbit
FOV 40◦x40◦square limited to 48◦at the detector corners
Image Array
3890 x 3890 Pixels (M); Note: Left 10 columns and bottom 10 rows of each die are opaque
Boresight Nominal: 25◦from Sun center
Direction Measured: 25◦7’26.3” Angular 5◦- 45◦from Sun center Range 5.25 R - 47.25 R at 0.28 AU
Angular 36.7 arc sec (Full) 73.5 arc sec (2x2 bin); Resolution 10.3 arc sec (Full) 20.6 arc sec (2x2 bin)
equivalent at 0.28 AU Spectral Bandpass 500 - 850 nm (M) Exposure Time Per Image
Nominal 30 sec (C); Range 0.1-65 sec (M)
Number of Summed Images
Varies from 1-30 (C) depending on ob-serving program, heliocentric distance and whether it is the inner or outer pair of die
to-noise ratio. The SoloHI baffles are designed to minimize the stray light entering the entrance aperture from various sources. For the Solar Orbiter mission there is a significant complexity - the solar light reflected by the solar array at the rear of the spacecraft onto the backs of the instrument baffles.
Table1gives a summary of the key instrument parameters. The parameters are either measured or computed and are indi-cated with an (M) or (C). The exposure time and number of summed images are calculated from our best estimates and could change in flight.
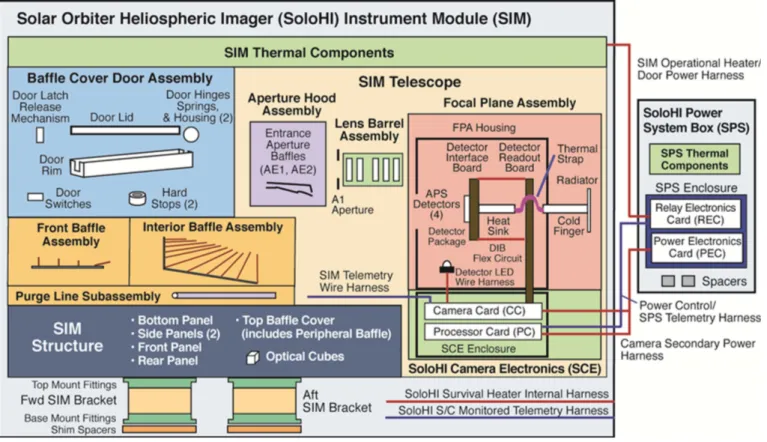
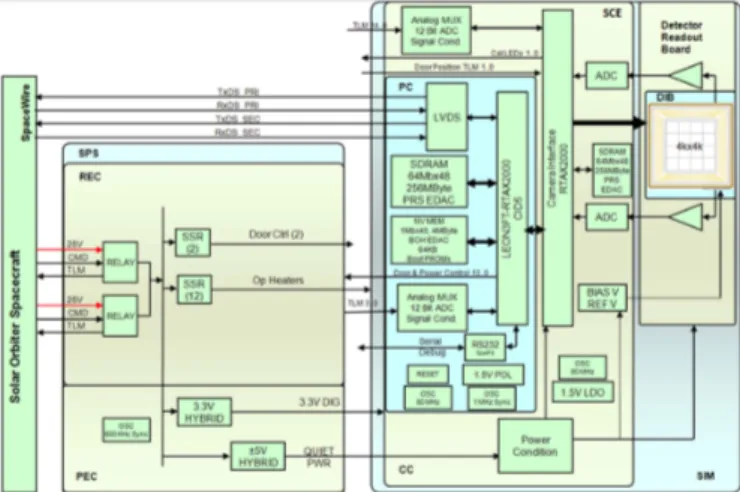
SoloHI is comprised of the SoloHI Instrument Module (SIM) and the SoloHI Power System box (SPS). The SoloHI functional block diagram (Figure5) shows the components of the SIM and SPS. An interconnect harness (not shown) connects the SIM and the SPS and a spacecraft harness (not shown) connects SoloHI to the spacecraft.
Both SoloHI instrument units, the SIM and the SPS, are mounted on the exterior of the Solar Orbiter+Y panel. The SPS is located below the SIM and between the forward and aft SIM brackets that support the SIM. Figure6 (top) shows the orien-tation of SoloHI with respect to the Solar Orbiter. The origin of the SIM Physical Reference Frame is located at the center of the aft SIM rigid instrument mount projected down to the base of the aft SIM bracket at the SIM mounting interface plane with the spacecraft deck. The XSIM axis points toward the Sun in its nominal orientation for science observations.
The SIM (Figure6, bottom) includes the structure, the baffle assemblies (forward, interior and peripheral), the telescope, the SoloHI camera electronics (SCE), the baffle cover door assem-bly, the SIM thermal components, and the forward and aft SIM brackets. The SoloHI telescope is composed of the aperture hood assembly, the lens barrel assembly, and the focal plane assembly
(FPA) and SCE. The SCE is composed of the processor card (PC), the camera electronics card (CC), and the SCE enclosure. The instrument telescope design is monolithic with no moving parts. The SPS includes the Relay Electronics Card (REC), the Power Electronics Card (PEC), the SPS enclosure, the SPS ther-mal components. Solar Orbiter provides operational power to the SPS and survival power to the SoloHI survival heaters on the SIM and SPS. In addition, Solar Orbiter forwards instrument commands and receives science data and housekeeping teleme-try over the SpaceWire interface. Each pixel of the APS detector converts the photoelectric charge to volts, which is digitized o ff-chip, and the signal transferred to the SCE. The pixel is read out at the rate of 2 Mpixels/sec, The image data is processed and then sent to the spacecraft for storage on the solid state mass memory (SSMM) for later transmission to the ground. The APS is cooled passively by a radiator mounted to the side of the SIM with a view to deep space.
3.1. Design Philosophy
SoloHI meets the Solar Orbiter mission science objectives and instrument science objectives described in Section 2 with a design concept based on the heritage SECCHI/HI design tai-lored for the Solar Orbiter mission (Müller et al. 2019; Garcia-Marirrodriga & et al. 2019). The changes to the heritage de-sign were made to conserve resources (mass, power, volume, and telemetry) to fit in the Solar Orbiter mission constraints. The Solar Orbiter mission orbital profile necessitates a small and relativity lightweight spacecraft. The mass, power, volume and telemetry requirements that we achieved are considerably smaller than the initial strawman baseline.
The two significant changes from the heritage SECCHI/HI are the larger single FOV and detector type. SoloHI has a single FOV that is double the size of the SECCHI HI1 inner telescope. By doubling the FOV, we can meet the science objectives with a single telescope. This change resulted in a significant savings in mass and volume. The second change was to use a custom complementary metal–oxide–semiconductor (CMOS) APS in-stead of the Charge-Coupled Device (CCD) that was used with SECCHI. The requirements for the SoloHI camera electronics are significantly reduced due to the increased functionality of the APS architecture on the chip, thereby reducing the mass and power compared to the CCD. The APS detector is described in more detail in Section4.6.
3.2. Accommodation Challenges
Stray Light Two spacecraft components are in the optical field of regard (FOR) and particular attention was paid to them in the placement and surface treatments to reduce the stray light enter-ing the entrance aperture to acceptable levels. One of the anten-nas from the Radio and Plasma Waves (RPW; Maksimovic et al. 2019) experiment passes through the FOR and could be easily accounted for, since it was located in the sunward direction. The more serious intrusion was from one of the 8.2m long panels of the solar array. Being at the rear of the spacecraft, reflections from the array and the mounting yoke heat shield reflect sunlight onto the backs of the linear forward occulters that block the di-rect radiation from the Sun. Reflected light hitting the backs of the linear occulters have access to the optical system. The miti-gation techniques used to reduce the impact to acceptable levels are described in Section4.3.
Fig. 5. SoloHI Functional Block Diagram
is on the anti-ram side of the spacecraft, and the optical field-of-view (FOV) is centered at 25◦ to the East of the solar vector, the likelihood of dust impacts was determined to be insignifi-cant. The field of view is similar to the SECCHI/HI-1 telescope, which has had no detectable damage after 12+ years of opera-tions, albeit at 1 AU.
Radiation Effects We used Solar Orbiter radiation guidelines for a seven-year mission for EEE parts selection. Our designs ad-dress single event effect (SEE) induced failure (latchup, burnout, gate rupture, secondary breakdown), non-destructive SEE (e.g., non-destructive latchup, mini-latchup, and single event func-tional interrupts) and single event-induced soft errors (includ-ing s(includ-ingle event upsets (SEU) or transients in linear devices) and SEE-induced soft errors. All EEE parts meet the total ion-izing dose (TID) requirement with a minimum radiation design margin of 2x the mission TID (60 kRad behind 2,54 mm of Al shielding). We used no EEE parts having a linear energy trans-fer (LET) threshold of <25 MeV cm2/mg (SEU) or 100 MeV cm2/mg. The selected APS detector technology (see Section
3.4) mitigates potential problems of Non-Ionizing Energy Loss (NIEL) and radiation-induced Charge Transfer Efficiency (CTE) losses. Unlike CCDs (e.g. LASCO, SECCHI/HI), the photoelec-trons are read-out from each APS pixel without shifting through the rest of the detector, and therefore have a reduced (but not negligible) susceptibility to radiation-induced loss in CTE. Like CCDs, the radiation-induced damage increases the dark current, dark current non-uniformity noise, particle-induced ionization transients, temporal variations in pixel dark current and other ef-fects. Because images are summed on-board, the ionization tran-sients (i.e. cosmic ray like events) are scrubbed before summing on-board as is done on SECCHI/HI.
EMI/EMC The mission has very high EMI/EMC requirements. This normally affects remote sensing experiments via require-ments on mechanical motors to move shutters, filter wheels, etc.
The only mechanicm in SoloHI is a one-shot door, and does not have this problem. However, the variable instrument heater power consumption ultimately places a variable demand on the solar array, which could then possibly affect the sensitive in-situ instruments, e.g. the magnetometer (MAG). The heater-power issue is present in both the operational and survival heaters, and was mitigated by a combination of software and hardware solu-tions. A software control algorithm was added to manage the cy-cling of the various operational heaters to ensure that the on/off transitions do not exceed the requirement of transitions in cur-rent draw of 100 mA. The survival heaters are controlled by thermostats and operate when the SoloHI is powered off and thus are unable to be controlled by instrument software. Each survival heater was split into a trim and a bias heater. The trim heater cy-cles frequently to maintain the temperature above the survival temperature but draws less power than the 100 mA requirement. When the trim heater is unable to maintain the desired tempera-ture, the bias heater is powered on, by ground command, to bias the temperature higher so that the trim heater can again maintain the survival temperature. In the current orbit scenario, the bias heater is not needed.
Contamination Sensitivity SoloHI is very susceptible to con-tamination from dust particles on the edges of the baffles and the lenses but is insensitive to contamination from organic com-pounds. However, SoloHI is in the discharge path of the propul-sion jets that control the orbit and the attitude of the space-craft. We were concerned that the accumulation of droplets could change the thermal properties of the Multi-Layer Insu-lation (MLI) and radiant cooling plates and thereby affect the operating temperature of the instrument, the electronics, and the APS detectors. This potential contamination source was elim-inated by the spacecraft placing baffles in front of the propul-sion jets on the spacecraft to block the outflow impinging on the SoloHI instrument.
Fig. 6. Top: SoloHI accommodation on the Solar Orbiter spacecraft and reference systems. The SIM physical reference frame (subscripts SIM) with respect to the Solar Orbiter mechanical reference frame (subscripts SO).Bottom: SoloHI Instrument Module (SIM) and SoloHI Power Sys-tem (SPS) and subassemblies.
4. SoloHI Instrument Design
4.1. Optical Design
The SoloHI telescope is a relatively simple design with a single lens assembly which together with the detector (see Section4.6) form the focal plane assembly (FPA), described in Section4.4.2. For SoloHI, direct illumination from the Sun is blocked by the heat shield. The baffles are designed to minimize the stray light entering the entrance aperture from various sources. The heat shield, one RPW antenna, and the solar array all either diffract or reflect light onto the instrument.
4.2. Lens Barrel Assembly
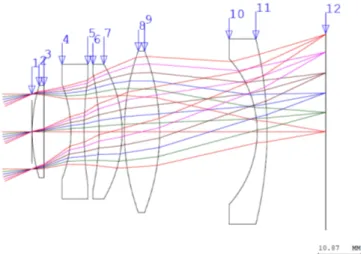
The SoloHI lens barrel assembly is a five-element wide angle design fabricated by Jenoptik. The lens design was optimized to maintain optical performance over the large 40◦FOV and min-imize stray light from scattering. A summary of the SoloHI op-tical parameters is shown in Table2. Thermal and radiation re-quirements were incorporated into the design. Figure 7 shows
Fig. 7. Lens element layout and ray-tracing. The lens surfaces are indi-cated by the number along the top for the 5 elements. Surfaces 1 and 12 are the front lens plane and the focal plane, respectively.
the lens layout and ray-tracing. The resolution is optimized for the 7.5 R solar distance, to satisfy the science requirement for
observing the shocks, or density power spectrum in the corona, or SIR boundaries. The bandpass is set by using a long and short wavelength cutoff filter deposited on lens surfaces 7 and 9 re-spectively.
Figure 8 is a plot of the measured bandpass of the flight lens. The other lens surfaces are coated with an anti-reflective coating to maximize the throughput and minimize the ghost-ing. Ghosting performances have also been taken into account in the lens optimization by maximizing the image area of sec-ond order ghosts due to bright planets and stars. The first ele-ment of the lens uses radiation tolerant glass, the concept used for SOHO/LASCO, which has been in space for over 22 years with an average degradation of about 0.5%/year (Thernisien et al. 2006;Colaninno & Howard 2015). The lens barrel is made of titanium (Ti6Al4V), which makes the design almost insen-sitive to temperature variation, from room temperature to pre-dicted operational temperature of −45◦C. The off-axis
rejec-tion is maintained by using absorbing coatings and sizing of the lens retainers. The bandpass from 500 to 850 nm is wider than SECCHI/HI-1 which was from 550 to 650 nm. This differ-ence enables SoloHI to gather significantly more photons than SECCHI/HI-1. The HI-1 had the same bandpass as the SEC-CHI/COR2 to ensure that they would have the same photometry, so that we could better follow structures from the COR2 into HI-1.
Due to the presence of the forward baffles, whose function is described in the next section, the image is vignetted all along the inner edge of the FOV, from approximately 5.4◦ elongation to 9◦. The profile of the vignetting is shown in the bottom panel of
Figure8, from the theoretical boresight (25◦elongation from the Sun center) to the inner edge (5◦elongation). Natural vignetting
of the lens is also present and follows a cosine3law with the field angle.
4.3. Stray-light Rejection
Baffle definition and position There are four sets of baffles -each serving a specific purpose.
Fig. 8. Top: Bandpass of the flight lens (SN03), measured by Jenoptik. The bandpass is defined by a combination of a short pass and long pass coatings applied to surfaces 7 and 9. Bottom: Vignetting factor versus the field angle, from the inner field of view edge (5.4◦
) to the boresight (25◦). The inner FOV is vignetted by the forward baffles from 5.4◦
to 8.8◦
and follows a cos3θ law.
1. Forward baffles: a set of 5 baffles, labeled F1, F2, F3, F4, and I0 on Figure9, which block the direct sunlight and the subsequent diffraction from entering the telescope entrance aperture. The edge of the spacecraft heat shield is the first baffle in the system. The I0 baffle is not labeled in the figure, but is the dark horizontal line just after the F4 vertical baffle. 2. Interior baffles: a set of 9 baffles each pointing to the light-trap. The telescope aperture only sees the bottom surface of these baffles, so that any stray-light source above the SIM will have to bounce twice before entering the telescope aperture, thereby increasing the rejection of the stray-light source.
3. Aperture light trap: a set of 2 baffles, labeled AE1 and AE2, on Figure9. Their role is to trap the residual diffracted sun-light coming from F4 and the reflected stray-sun-light coming from the top of the interior baffles.
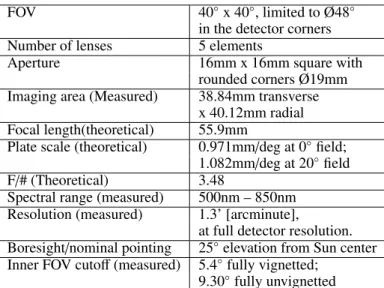
Table 2. Optical design parameters
FOV 40◦x 40◦, limited to Ø48◦
in the detector corners Number of lenses 5 elements
Aperture 16mm x 16mm square with
rounded corners Ø19mm Imaging area (Measured) 38.84mm transverse
x 40.12mm radial Focal length(theoretical) 55.9mm
Plate scale (theoretical) 0.971mm/deg at 0◦field;
1.082mm/deg at 20◦field
F/# (Theoretical) 3.48
Spectral range (measured) 500nm – 850nm Resolution (measured) 1.3’ [arcminute],
at full detector resolution. Boresight/nominal pointing 25◦elevation from Sun center
Inner FOV cutoff (measured) 5.4◦fully vignetted;
9.30◦fully unvignetted
4. Peripheral baffle. Not shown on Figure9, the peripheral baf-fle is a plane that goes on top of the interior baffles. It cuts into the FOV of the telescope, blocking the direct view of the telescope aperture of the spacecraft heat shield.
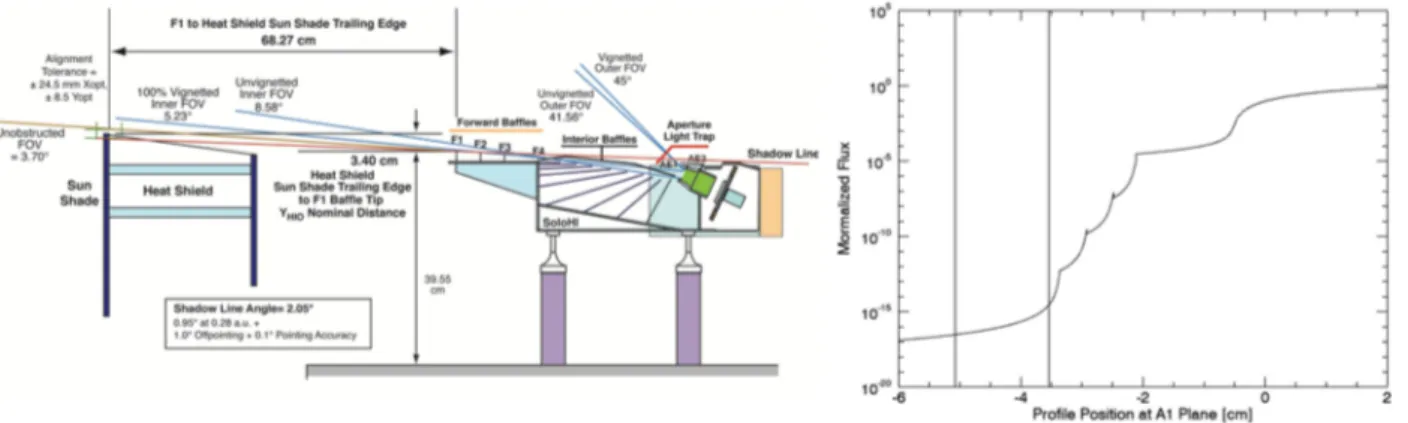
Diffracted stray-light The design of the forward baffles (Figure9) is based on the SECCHI/HI baffle design (Socker et al. 2000;Halain et al. 2011), however, in this case the edge of the spacecraft heat shield is used as the first baffle, and then the four baffles on the SoloHI reduce the diffraction from that first edge to an acceptable level. The right panel of Figure9 shows the diffraction reduction by the various baffles. Using only one baffle to totally block the direct sunlight is not sufficient to achieve the stray-light level needed to observe the faint solar corona, which is more than 10 orders of magnitude dimmer than the solar disk brightness. Each baffle provides roughly 3 orders of magnitude attenuation of the diffraction, so at least 4 are needed to achieve the requirements. For robustness and to account for fabrication, alignment tolerances, and spacecraft off-pointing, one more is used in the SoloHI design. Note that F4 does not participate in the diffraction attenuation but is there to provide a light trap ef-fect in conjunction with the I0 baffle.
The diffracted stray-light requirement at 0.28AU ranges from 1x10⁻¹⁰ B at the inner FOV to 1x10⁻¹³ B at the outer FOV .
Measurements of the diffraction performances in space-like con-ditions were performed on the flight instrument in the SCOTCH vacuum chamber at NRL. No spacecraft heatshield was present during this test, so a model of the diffraction from that single edge had to be added to compute the expected stray-light levels in flight. The test showed that the requirements were met.
Reflected stray-light We define the reflected stray-light as the fraction of the sunlight that is reflected or scattered off the structures of the spacecraft, then illuminates the SIM and finally ends up on the image plane. Three structures on the spacecraft have been identified as sources of such stray-light: 1) the solar array, 2) the heat shield, and 3) an RPW antenna. Raytracing analysis showed that the dominant contribution comes from the solar array, while the two others have more modest contributions. The solar array (SA) is an 8.2m high by 1.2m wide struc-ture, fully illuminated by the Sun, and stands 1.5m in the back and 1.0m to the left of SoloHI when looking at the Sun. This is a large light-reflecting area. Viewed from the SIM perspective, the SA represents approximately 0.6sr. The amount of light that
Fig. 9. Left: Definition and position of the optical baffles, with respect to the SIM and spacecraft heat shield. Right: Predicted diffracted irradiance at the SIM telescope entrance aperture (A1). This is in the nominal case heat shield alignment and spacecraft pointing (+1.1deg pitch down), at 0.28AU. The labels above the curve show where the attenuation provided by each baffle occurs. The vertical lines pointed by the A1 label show the dimensions of the telescope aperture
the SA will scatter towards the SIM depends on three things: the geometry of the SA, the bidirectional reflectivity distribution function (BRDF) of the array, and the steering angle of the array relative to the Sun direction through the orbit. All these param-eters were provided by ESA. However, we measured the BRDF of the flight SA to validate the stray light model.
To predict the expected amount of stray-light due to the SA while in flight, ray-tracing software was used. The model in-cluded the SA, the SIM with all the forward and internal baf-fles, the lens and lens barrel, and the detector. The SIM model was based on the CAD model of the instrument, and all the op-tically relevant parts were identified with their expected optical properties.
Optical testing of a flight like SIM baffle mockup built early in the development phase allowed the correlation of the stray-light model to the observations (Thernisien et al. 2018). During integration of the flight model (FM) instrument, reflected stray-light tests were also done. The data collected showed a good agreement with the stray-light model. An example is shown on Figure10. Stray-light requirements were then verified by an end-to-end run of the model with flight conditions and factoring in the SA.
4.4. Mechanical Design
SoloHI adopted a modified protoflight model (PFM) philosphy, meaning that there was no qualification model (QM) of the full instrument. A QM was used to ensure the design the focal plane assembly which went through two iterations before the vibration and thermal requirements were satisfied. The flight instrument was vibrated to qualification levels for flight durations.
4.4.1. Instrument Enclosure
The SoloHI instrument enclosure (Figure11) directly supports the external baffles and encloses the interior baffle structure. The FPA mounts directly to the rear of the enclosure. The mounts to the side and protects the optical surfaces. The top perimeter of the instrument enclosure is machined to incorporate a stepped ledge to accommodate a labyrinth seal with the door cover. The mechanical design of the enclosure meets high-G structural load-ing, alignment stability, FOV, contamination control, and
ther-mal performance. The instrument enclosure is fabricated from composite honeycomb panels of CFRP (M55J) facesheets, 5056 Aluminum Core, and adhesive corefill. The panels are joined with ‘C’ (channel) clips and ‘Y’ bracket clips fabricated from Ti-6Al-4V. The clips are structurally bonded to the enclosure walls with a blended mixture of EA9394 and EA9396 adhesives. Click bonds are implemented in the clips to accommodate fasteners for attaching the walls together. Ti-6Al-4V inserts are potted into the panels for integrating components.
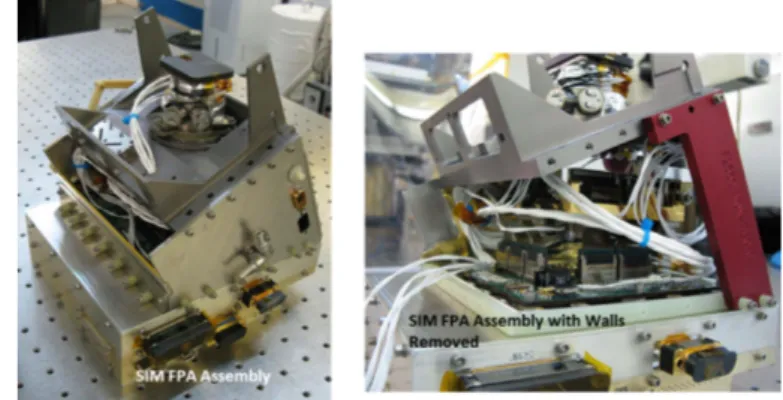
4.4.2. Focal Plane Assembly (FPA)
The SoloHI Focal Plane Assembly (FPA) is shown in Figure12 with the lens assembly mounted. The FPA includes the APS de-tector package with Dede-tector Interface Board (DIB), the Dede-tector Readout Board (DRB), the SoloHI Camera Electronics (SCE) and the thermal strap to the radiator that provide passive cool-ing for the detector. The FPA houscool-ing is comprised of Ti-6Al-4V walls. The housing assembly interfaces to the SIM structure with a Ti-6AL-4V bulkhead bracket through structural, titanium (Ti-6AL-4V) clips. Internal FPA components are accessible through separate, removable walls. The lens barrel assembly is mounted directly to the FPA via a bulk head interface that defines the opti-cal axis of the telescope. The FPA structure positions the detector with respect to the telescope mounting interface. The APS detec-tor is supported in a clamshell mount to accommodate de-center alignment. Focus alignment of the lens barrel to the detector and overall position alignment of the telescope (lens barrel – detector system) to the F1 baffle is accommodated with shim spacers. Fo-cus and position alignment of+/- 2 mm is accommodated in the assembly. The clamshell assembly accommodates+/- 1.6 mm for de-center correction. The close proximity of the telescope as-sembly to the APS detector imposed a challenging requirement on the thermal design in that the telescope needed to be main-tained no colder than about -45◦C, whereas the APS needed to be cooled to no warmer than -55◦C. The clamshell mount
ac-complished that objective.
4.4.3. Baffles
All baffles are fabricated from aluminum and are optically coated black with either black anodize, Laser Black, A382 or Z307
Fig. 10. Example of data image (left) compared to the stay-light model simulation (right). Features pointed by the 2 green arrows on the left panel are part of the scene. They are not instrumental features.
Fig. 11. SoloHI Instrument Module (SIM) Enclosure.
paint depending on location and purpose. The forward, periph-eral, and light trap baffles individually attach to the SIM structure via baffle mounts. The interior baffles are installed in aluminum side walls along with a front, bottom, and back cover to form an integrated unit. The interior baffle box unit is integrated into the instrument enclosure with a front flexure and two aft mount pins to reduce thermal strain and maintain baffle orientation align-ment. To facilitate initial alignment measurements with the in-terior baffles, specifically with the no-touch Laser Black baffles, a red anodized assembly was built to characterize initial align-ments and evaluate shifts due to variance in coating.
Forward and light trap baffle horizontal and vertical align-ment accommodation is+/-0.5 mm. The interior baffle box ori-entation alignment is accommodated with spacer shims under-neath the flexure surface to adjust as a system with respect to the light trap baffles. To meet the forward baffle alignment
re-Fig. 12. SIM Focal Plane Assembly. The left figure shows the final flight configuration, with the lens assembly at the top and the camera electron-ics enclosure at the bottom. The right figure shows the assembly with the walls removed and a non-flight red bracket to temporarily hold the clamshell mount in the proper position.
quirements, the forward ledge support braces originally fabri-cated from Ti-6Al-4V for the qualification unit required replace-ment with Invar braces for the flight unit.
4.4.4. Door
The cover door provides a protective barrier for the baffles, tele-scope, and opto-mechanical hardware from contamination dur-ing the S/C integration activities, the launch environment, and the initial cruise phase of the Solar Orbiter mission. After the spacecraft reaches the nominal science orbit, the cover door will be released utilizing a one-shot door mechanism. The cover door is preloaded against two cup-cone joints to prevent door chatter through the Solar Orbiter launch environment. An Ejection Re-lease Mechanism (ERM) is used to reRe-lease the door. The preload set on the ERM for launch is controlled via a Strainsert instru-mented bolt in combination with a Belleville washer. The cover door is driven to its door open position using two torsion springs and a kickoff spring and is held open by the prevailing torque margin in the torsion springs at 225◦relative to its door closed
position. The mechanisms subsystem also incorporates a door closed telemetry switch, which furthermore acts as the kickoff
Fig. 13. SoloHI Electrical Block Diagram.
spring and two door open telemetry switches. A door lid over-travel stop is used to constrain the maximum angular position overshoot beyond the open position. In addition, a door lid com-pliant stop is used to attenuate the impact energy imparted to the SIM, when the door lid strikes the door lid over-travel stop.
The SoloHI door is fabricated from T-300 satin weave fab-ric. It is post machined to form a lip to create a labyrinth seal with a stepped ledge in the enclosure panel. The seal allows for venting while implementing a convoluted path for contaminants. In addition, two ascent vents with sintered metal filter discs are installed in the door.
4.4.5. Instrument Mounts
To align the optical axis of the SoloHI with the Solar Orbiter heat shield the SIM is raised off the spacecraft deck with in-strument mounts. The S/C interface brackets are fabricated from M55J laminate with T-300 overwrap and Ti-6Al-4V fittings. The composite portions of the two mounting brackets are rectangular tubes. The design of the mounts required a lightweight isola-tion system that could posiisola-tion the instrument enclosure off the deck nearly 220 mm to meet the F1 baffle to heat shield posi-tional requirement, maintain alignment, meet a primary instru-ment frequency mode above 140 Hz, and withstand high vibra-tion loads. Between the mounts and the spacecraft deck are Ti spacer and shim stack. The height of the spacer and shim stack was determined based on measured alignment of instrument with the spacecraft reference frame after final installation of the Solar Orbiter heat shield.
4.5. Electrical Design
The SoloHI electrical design (Figure 13) consists of five sub-systems: the SoloHI Power System (SPS), the Processor Card (PC), the SoloHI Camera Electronics (SCE), the Detector Read-out Board (DRB), and the Detector Interface Board (DIB). Each component comprises several subsystems, which we describe briefly below.
To meet the requirements for mass and power, SoloHI chose a light weight, lower power CPU the LEON3FT with 20 MIPS. RTEMS 4.10 was chosen as the real time operating system, since a C++ compiler and board support package for the LEON3FT was available. Using the RTEMS and C++ combination allows the same basic design of the heritage STEREO SECCHI soft-ware to be used. There is a near one to one correspondence of
system calls between VxWorks used with SECCHI and RTEMS for SoloHI. To lighten the CPU load, some camera operations (starting/stopping the camera) and time intensive image process-ing functions (pixel summprocess-ing, image summprocess-ing, truncation, and cosmic ray scrubbing) were incorporated into the camera FPGA. On SECCHI, these processes are run by the SECCHI CPU.
4.5.1. Processor Card
The SoloHI processor card is based on an Aeroflex Gaisler LEON3FT processor with support for 256MB of SDRAM, 64kB of PROM, and 4 MB of non-volatile MRAM. The LEON3FT is implemented on an RTAX2000 FPGA running at 25 MHz, which results in 20 MIPS. The SoloHI processor is based upon the con-figuration identification 5 (CID5) COTS with modifications. The science data, HK telemetry, and telecommands are provided via nominal and redundant SpaceWire links. Control of operational heaters and one-shot door is provided via a GPIO connection. Aeroflex Gaisler provides COTS driver support for memory con-trollers, SpaceWire, and GPIO. The Aeroflex Gaisler modifica-tions for SoloHI are: a switchable single SpaceWire core instead of multiple cores, an additional GPIO interface, and a custom SoloHI camera interface.
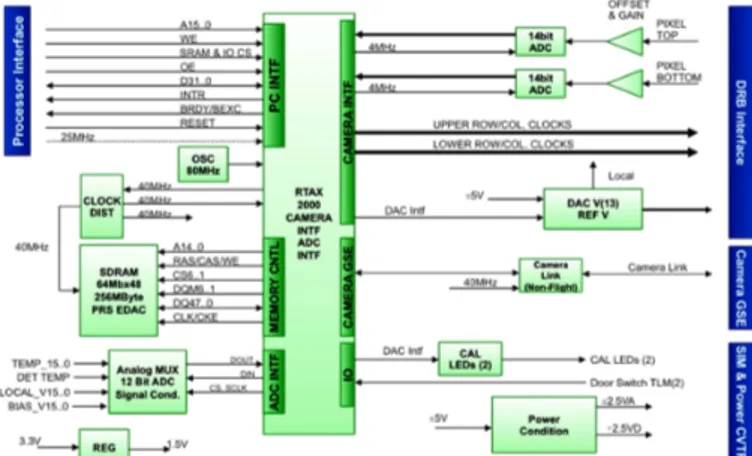
4.5.2. SoloHI Camera Electronics (SCE) and Camera Card (CC)
Figure14gives a block diagram of the SCE-CC. The CC takes the analog video signal from the DRB and digitizes the intensity information to 14 bits. It sets the offset and gain parameters to the ADC, to allow for shifts due to radiation damage. The CC is a smart camera with 256 MB of memory and is capable of doing simple image processing. The three functions provided in the camera FPGA are cosmic ray scrub with bias subtraction, pixel binning and image summing with 16-bit packing, and trun-cation. Images are stored in the camera memory and then trans-ferred to the LEON3FT processor for further image processing and image compression before being sent to the spacecraft. The LEON3FT will manage the camera buffers in both the CC and the PC. The camera can read out full images as well regions of interest (ROI) on each die depending upon the microcode and parameters loaded to its registers. The CC also controls the cal-ibration LEDs to provide a stimulus to the APS during AIT ac-tivities.
The camera gets its instructions to take images from sequences of binary coded instructions called “microcode.” The microcode is loaded to the camera and then commanded to begin executing. Individual processed exposures are then sent by the camera to the LEON3FT processor in a continuous loop until commanded to stop. Each observing program has a unique microcode. Storage for up to 128 microcode sequences is available, and we are currently using 32 slots. Scene readout is done by individual detector, and more specifically by row. There are two readout chains so two readouts can be done at once, one using the outer detectors (top) and one using the inner (bottom) detectors. This also allows different settings for the top two and bottom two detectors. The readout is controlled by camera microcode that is uploaded to set the timing of each readout chain. The microcode reads register values to set parameters such as exposure time and image size. Since the APS pixels are row and column addressed they can be read out with different timing, i.e. for a single detector one block of rows can be read out at a different frequency than another block, within
Fig. 14. Block Diagram of the SoloHI Camera Electronics (SCE) Cam-era Card (CC)
the readout timing constraints of top or bottom and one row at a time.
4.5.3. Detector Interface and Readout Boards (DIB/DRB) The four APS detector die are mounted to the DIB (Figure15, left), which interfaces through a rigid-flex cable to the DRB. Printed circuit traces on the DIB combine the same signals from the four die, into a single signal onto the rigid-flex cable. This greatly reduces the number of wires in the rigid-flex cable and also reduces the heat transfer from the DRB to the APS.
The DRB multiplexes the various video outputs from the APS and conditions the video signals to match the requirement for the ADC on the CC.
4.6. Active Pixel Sensor (APS)
The SoloHI detector will provide panoramic images of the inner heliosphere. The 5T pixel design and device architecture was specifically developed to meet the Solar Orbiter mission require-ments and SoloHI photometric and imaging requirerequire-ments. De-tails of the APS architecture and development are documented in Janesick et al.(2010,2013) andKorendyke et al.(2013). With an image size of 3920x3920 pixels, the device is one of the largest format APS detectors to be fully qualified for space. A photo-graph of the flight device is shown in Figure15in two stages of assembly. The left side of the figure shows the four die, the DIB and the wirebonds and the right side (with a 180◦rotation) shows
the fully assembled configuration with the molybdenum cover attached. Each die has two rigid flex cables connecting the DIB to the camera electronics. Three of the eight rigid flex circuits are readily visible in both images. The mechanical package is molybdenum, which has a coefficient of thermal expansion well matched to the APS. Molybdenum was also found to be stable, machinable and non-ferrous. The gap between detector imaging areas is<1mm with 0.88mm being typical.
Figure16is a schematic that shows the pinwheel configu-ration of the 4 die in the mosaic. The solar disk would be to the right and increasing heliocentric distance is from the right to left. The die positions are arbitrarily numbered, 1 to 4, in a counter-clockwise direction, beginning in the lower right. The horizontal and vertical lines show the direction of the rows of each of the direction. The red lines at the outer edges of each die indicate the locations of the 10 opaque rows and columns. The opaque
pix-Fig. 15. SoloHI flight Active Pixel Sensor consists of four abutted die mounted in a windmill configuration. Left: detector photograph with-out the mask showing the four die, the detector interface board and the wirebonds. Right: the complete assembled device
els enable a determination of the bias voltage and dark signal in each exposure. The corner between those lines is the (0,0) pixel. Putting that pixel to the lower left, readout occurs from that pixel along the bottom to the right. The optical system FOV is the cir-cle around the die. The SoloHI die were produced on the Jazz Semiconductor, Inc. foundry imaging line. There were 44 indi-vidual die per wafer with a total of 25 fabricated wafers. Several processing variations were incorporated into the fabrication run. The SoloHI die were selected from wafers 11-15 of the lot run. The readout frame is along the left and bottom of the die. The in-dividual pixel controls are located on the left side; pixel transis-tors in an individual row are controlled and sequenced together. The column controls and capacitors to store the individual pixel voltages are located on the “bottom”.
A schematic of the 5T SoloHI pixel is shown in Figure17. The photons are collected within a large pinned photodiode which occupies roughly 63% of the pixel area. Pixel controls are implemented with five transistors, (reset, gain control, transfer gate, source follower and row select). The sense node is sep-arated from the pinned photodiode with a transfer gate. The pixel architecture allows separate reset of the sense node from the pinned photodiode as well as “snap” mode operation. The low/high gain is realized a metal-insulator-metal (MIM) capaci-tor controlled through a dedicated transiscapaci-tor. The capacicapaci-tor is in parallel with the sense node. The source follower and row se-lect transistors are used to transfer the sense node voltages to the readout frame. During correlated sample and hold (CDS) read-out, the sense node voltage reset voltage for each pixel is trans-ferred and stored on a capacitor in the readout frame. The di ffer-ence between the reset and the photo-electron voltage is accessed through one of the four die readout ports and digitized with an off-chip analog to digital converter. The progressive scan/rolling curtain shutter allows photons to be collected during device read-out and minimizes the amount of time voltages are stored on the sense node.
The device is front side illuminated with an estimated 63% fill factor giving an average visible quantum efficiency of 32%. This quantum efficiency is sufficient to record a high quality scene of the inner Heliosphere. The device will be operated with a rolling curtain shutter and, therefore, does not require a shut-ter mechanism. Although the device architecture supports pixel readout rates of up to 4MHz through a total of 16 readout ports distributed across the four die, for SoloHI, the device will be op-erated with a readout rate of 2MHz with two independent readout chains, one for the upper two die and the other for the bottom two die. Table3describes the photometric and imaging characteris-tics of the device. The image in Figure18of a resolution target, taken on a single die at -65◦C gives a subjective indication of the