Enhancing Emergency Call Centers’
Performance Through a Data-driven
Simulation Approach
Eva Petitdemange
IMT Mines Albi, University of Toulouse
[email protected]
Elyes Lamine
IMT Mines Albi, University of Toulouse
[email protected]
Franck Fontanili
IMT Mines Albi, University of Toulouse
[email protected]
Matthieu Lauras
IMT Mines Albi, University of Toulouse
[email protected]
ABSTRACT
Emergency Call Centers (ECCs) can be considered as the starting point of the pre-hospital emergency medical system. Although, ECCs exist everywhere, their business processes and their performance levels differ from one place to another, even sometimes in a same country. By definition, users expect a high level of performance, particularly regarding the waiting time and the processing time of the calls. Additionally, ECCs might have difficulties to manage sudden rise of activities following disasters impacting huge number of victims for instance. To support ECCs in their continuous improvement steps, this paper suggests an innovative framework and its associated tools to support both diagnosis of current organizations and enhancement of their performance. Concretely, the proposal is data-driven and simulation oriented. First experiments are shown in order to demonstrate the potential benefits of such an approach. Avenues for further research are also discussed.
Keywords
Emergency Call Center, Performance, Simulation, Data-Driven, Continuous Improvement, Organization.
INTRODUCTION
Emergency Call Center (ECC) is a critical component of the response chain in case of emergency. In all countries, ECCs must be reactive and efficient in their business processes. For instance, as shown by Meah (2008), the waiting time cannot should not be upper than 20 seconds in the USA or 60 seconds in France. Unfortunately, recent events have shown that some ECCs are not able to reach these goals. As an example, in France, a recent study about the responsiveness of French ECCs, Vincent (2018) demonstrated that 15% of calls were not picked up. Additionally, this study showed that 80% of the ECCs did not respect the minimum quality requirement of 99% of calls picked up by less than 1 minute. Additionally, in various places, ECCs have to cope with a significant increase of the calls due to population growth, generalization of automatic calls or launching of additional services (such as duty consultations during the night). As they do not have a proportional increase of means, and as their current organizations do not seem to work properly, numerous ECCs are working on continuous improvement steps in order to r-engineer their organizations to get better performance results. But as ECCs organizations can differ significantly from one to another, even within the same country, supporting such a step is not so easy. As a consequence, this ongoing research work tries to fill this gap by developing a dedicated framework and set of accurate tools to support efficiently ECCs’ continuous improvement approaches.
The remainder of the paper is divided into 4 sections. First, a brief literature analysis about the topic is suggested in order to position the research statement and give insights about existing contributions and current practices. Second, the proposal is developed highlighting the overall approach and the different tools that should be used for each step. Third, first parts of the real application case that is ongoing is presented. Fourth, some conclusions and research perspectives are discussed.
BACKGROUND ECCs’ Typologies
ECCs differ a lot from a country to another (Sikka and Margolis, 2005). Basically, some are doctor-based, like in France, where the emergency chain brings the doctor to the beneficiary (“stay and play”) (Hodgetts and Smith, 2000). A key feature of this systems is to have a doctor at each step of the process, starting with the management of the calls. In such a system, there is a different call number per need. For instance, in France again, 15 is dedicated to medical emergencies while 18 is for fire emergencies and 17 for police emergencies. Each one has its own call-center with its own call-takers, dispatchers and operators. At the opposite, countries like the USA has a unique emergency number (i.e. 911) and try to send relief means to the beneficiaries as fast as possible (“scoop and run”) (Devlin, 2006). In such a system, qualification of the needs is made when the relief team arrives on site. More globally, as shown by Petitdemange et al. (2019), each ECC can be characterized by 6 main features which are: (i) universal if the number is unique like in the USA or specialized if there are several numbers like in France for instance; (ii) “scoop and run” or “stay and play” philosophy as the goal is to take the patient to the hospital as fast as possible for the former while the latter brings hospital care facilities to the patient; (iii) dedicated call-platform (i.e. firemen, police, hospitals) or mutualized call-call-platform between different emergency services; (iv) emergency-oriented and/or advising-oriented as some countries use same ECCs to manage true emergencies and advice to people when some regular services are closed during the night or weekends for instance; (v) sorting or not sorting of phone call queues as calls are managed in a first come, first served mode during all the process of the call or calls are prioritized after being picked up depending on the severity; and (vi) dedicated or generalist human resources, notably regarding triage and care services which can be made by the same person or divided on different persons. Based on them, it is possible to qualify the type of ECC.
Whatever the combination of these feature is, the overall business process will be quite similar and is mainly composed of 6 phases as mentioned by Petitdemange et al. (2019). When a beneficiary is dialing an emergency number, then the call is transmitted to the nearest ECC, where a call taker picks it up and transfers it to a call dispatcher for treatment. Based on this analysis, (s)he will make a decision to send or not relief means to the beneficiary. If a positive decision has been taken, then responders will go the beneficiary before (s)he goes to the hospital.
As a consequence, we can notice the expected framework and its associated tools should be able to consider all the variety of ECCs’ organization to be relevant and usable.
ECCs’ Performance Objectives and Measurements
As the objective of this research work is to enhance the performance of ECCs, it seems interesting to have a look on existing Key Performance Indicators (KPIs) that are mainly used in ECC context. According to Passmore and Zhan (2013), the main ECC KPIs are “waiting time before picking up” and “total time of treatment of the call”. They also indicate that ECCs should measure a ratio that expresses the number of calls served in the respect of legal requirements on the total of incoming calls. This can be labeled as “quality of service” ratio. Authors such as Robinson and Morley (2006) have proposed to add an evaluation of the “beneficiary satisfaction” ratio to know their contentment following their care.
Penverne et al. (2017) indicate that in addition to the previous KPIs, ECCs should also consider the efficiency of the organization by measuring the “utilization ratio” of human resources. This is a critical issue, particularly in a context of healthcare domain where financial resources are generally scarce. Robinson and Morley (2006) also studied that performance dimension and suggested to measure a “productivity ratio”.
Additionally, Dai and He (2010) have shown that in such a context, a significant number of incoming calls are interrupted before being picked up by the call taker. This can notably be explained by false numbering, hoax attempts or voluntary abandon following a too long waiting time for instance. As a consequence, these authors suggest considering “abandon ratio” and its statistical distribution as a major KPI for assessing the ECC performance. This seems to be a critical point to avoid considering all these calls as weaknesses.
Even if literature studied several performance dimensions in ECC context, authors like Zhou and Soman (2003) or Song et al. (2014) have demonstrated that all those KPIs are more or less time related. Actually, they indicated that reducing waiting- and lead-times contribute to save lives, to increase beneficiary satisfaction, and reduce inclination of people to leave the queue (abandon).
As a consequence, we can remark that the expected framework and its associated tools should be able to consider various KPIs, but time-related one are the most important ones in the context of ECCs.
Existing Methodologies and Tools for Enhancing ECCs
Several research works have been developed in the literature to improve the performance of ECCs. Huge majority of these works related to the optimization of the resources committed from the processing of calls (Goldberg et al., 2019; Haque et al., 2017). Others like Gans et al. (2003) have tried to enhance the organization by reducing the costs and the waiting times through staffing optimizations. Koole (2002) on his side has worked on polyvalence of agents to better assign the calls to them, and as a consequence, minimizing the waiting times. Garnett et al. (2002) have developed an Erlang-A model able to include abandoned calls and some user behaviors such as his/her patience capability to wait in the queue. Within a similar ambition, other research works such as Brown et al. (2005), Robbins et al. (2010) or Gans et al. (2010) have developed models based on Erlang or Queuing theories to improve the ECCs performance.
However, as noticed by Gans et al. (2003), all these studies are based on strong assumptions that are questionable. Typically, they consider that all callers have the same behavior, mainly using a Poisson inter-arrival process. They assume that processing times are uniformly distributed, following mainly a log-normal distribution or in very few cases an exponential distribution (van Buuren et al., 2017). Last but not least, they consider that all the ECCs’ human resources are identical, implying a same routing of call processing.
As shown by Petitdemange et al. (2019), these assumptions dot not fit with a majority of ECCs, particularly in a crisis situation when the system needs to handle sudden spikes in calls. They noticed that the most important stake for ECCs is to re-engineer their organization in order to optimize their responsiveness in a context of normal and crisis situations.
As a consequence, the research statement can be defined as followed: how to re-engineer ECC’s organizations considering the reality of their business, including variety of resources, variety of processing times and variety of incoming calls?
PROPOSAL
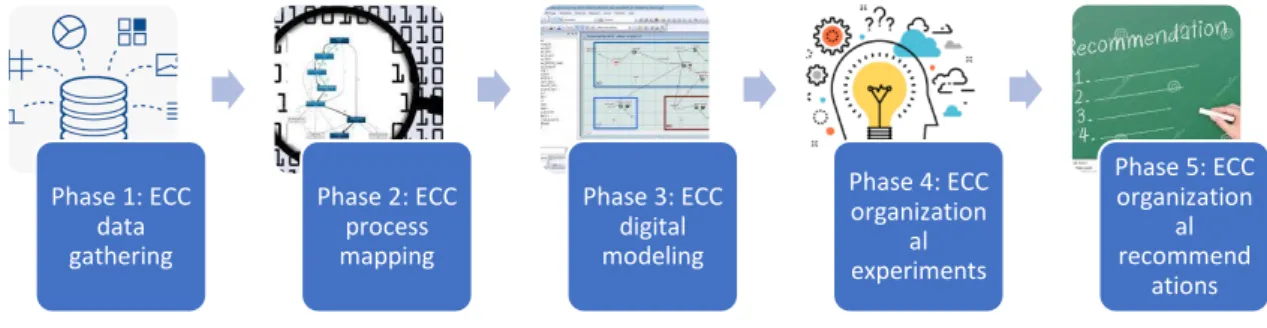
Our contribution is a global framework able to support the process of performance improvement of ECCs. Each phase of this framework embeds a set of concrete tools in order to facilitate the continuous improvement step. Basically, the proposal is composed of five main phases as shown in Figure 1.
Figure 1. Framework proposed
ECC data gathering
This phase consists in collecting and cleaning qualitative and quantitative data from the studied ECC(s). Regarding the quantitative ones, they should be extracted from the legacy systems that are used to manage the telephony of the ECC(s). There is a potential difficulty here regarding the different data structures that can exist from one ECC to another. However, the idea is to aggregate the data in order to get a single “event log file” composed of the following attributes: (i) label of the event, (ii) timestamp, (iii) identification number of the event (unique), (iv) identification number of the resource performing the event (unique), (v) number dialed by the caller to access to the ECC.
Regarding the qualitative ones, they should be extracted by interviewing the practitioners. The objective consists in having a global vision of the organization in terms of types of resources that are used, main activities that are processed, incoming flows that are managed. This should be helped to better understand the business and behaviors of the ECC(s) in order to make sense to the whole study. Depending of the complexity of the ECC(s),
Phase 1: ECC data gathering Phase 2: ECC process mapping Phase 3: ECC digital modeling Phase 4: ECC organization al experiments Phase 5: ECC organization al recommend ations
this information might be formalized through a dedicated business process language such as Business Process Modeling Notation (BPMN) or Flow Diagrams. Last but not least, this step must allow identifying the rules of prioritization that exist to manage the calls. This is generally associated to a level of severity and it issued to prioritize the type of resources used, and potentially, to prioritize the calls with each other. This point will be a critical issue for the following.
ECC process mapping
A call process is a sequence of waiting and processing times, that can be managed by a single resource of a set of different resources. This phase consists in mapping all the call processes that have been occurred during a significant period of time in order to establish an accurate knowledge of the existing ECC(s). To do so, we suggest using a Process Mining technique as mentioned by van der aalst (2011). This technique allows transforming the “event log file” constituted during the Phase 1 into an accurate map of flows, including all steps and times for all types of processes. Eventually, this map can be studied at different granularity level depending of the needs.
ECC digital modeling
This phase focuses on the design, the setting and the validation of a model that represents the ECC(s)’ behaviors, processes and flows. The objective is to get a digital model of the studied ECC(s) in order to experiment potential organizational evolutions of it/them. In this research work, inspired by the research works of van Buuren et al. (2017, Haque et al. (2017) or Goldberg et al. (2019), we suggest using a discrete event simulation approach to support this phase instead of pure mathematical queuing models as ECCs are generally managed by various and heterogeneous categories of resources. Additionally, organization alternatives based on multi-sourcing ECCs or multi-skilled resources might be difficult to assess through a pure queuing model.
Classically, the approach consists in implementing the discrete event simulation model, directly from the map of flows defined in Phase 2, and by including the business rules identified in Phase 1. This model has then to be calibrated in order to be sure that it is representative of the reality. It means that the outputs of the simulation model – considering the real profile of incoming calls extracted from the Phase 1 – must be very close to the real outputs noticed on the field (a test of Pearson might be used to objectively make this comparison). It also means that the profile of incoming calls should be studied in order to identify a distribution law that would be used to generate potential evolutions on the demand (spikes…) in a realistic way. Globally, the validation of the model should be done by using a correlated inspection approach as suggested by Law and Kelton (2000).
The developed model must be able to measure the performance of the ECC regarding the different KPIs identified in the Background section. Notably, the discrete event simulation model has to deliver results regarding the waiting and processing times on one hand, and resource utilization ratio on the other hand.
ECC organizational experiments
This phase is about the definition of the experiment plan we want to study. Typically, this can consider scenarios such as:
Collaboration between several ECCs to manage spikes of calls; Collaboration between several ECCs to manage all calls;
Specialization of resources depending of activities to process (inputs versus outputs calls for instance); Means’ mutualization of means between different ECCs;
Polyvalence development of human resources;
Change of prioritization rules for queuing management at each stage of the whole process;
Once those scenarios are defined, they have to be simulated in order to get an objective evaluation of their consequences regarding the KPIs defined previously.
ECC organizational recommendations
This last phase consists in analyzing the results from the experiment plan regarding the defined KPIs. A set of comparing criteria has to be set up accordingly to practitioners’ expertise in order to support decisions and make recommendations to implement in real conditions.
ONGOING ILLUSTRATIVE CASE Rapid case description
Experiment is developed on a French ECC characterized by several numbers to reach the center (15, 112 or 3966), no triage for managing the queue, a “stay and play” organizational mode, and a set of dedicated resources (i.e. not multi-skilled). This ECC manages both medical emergency calls and general medicine calls, mainly during nights and weekends.
Proposal application
Phase 1: ECC data gathering
The study started in 2018 and a dataset of a month was gathered from the telephony system of the ECC (corresponding to approximately to a 7,000 “event log file”). From this extraction, we were able to identify the profile of incoming calls as shown on Figure 2 (for one day).
Figure 2. Profile of calls for one day
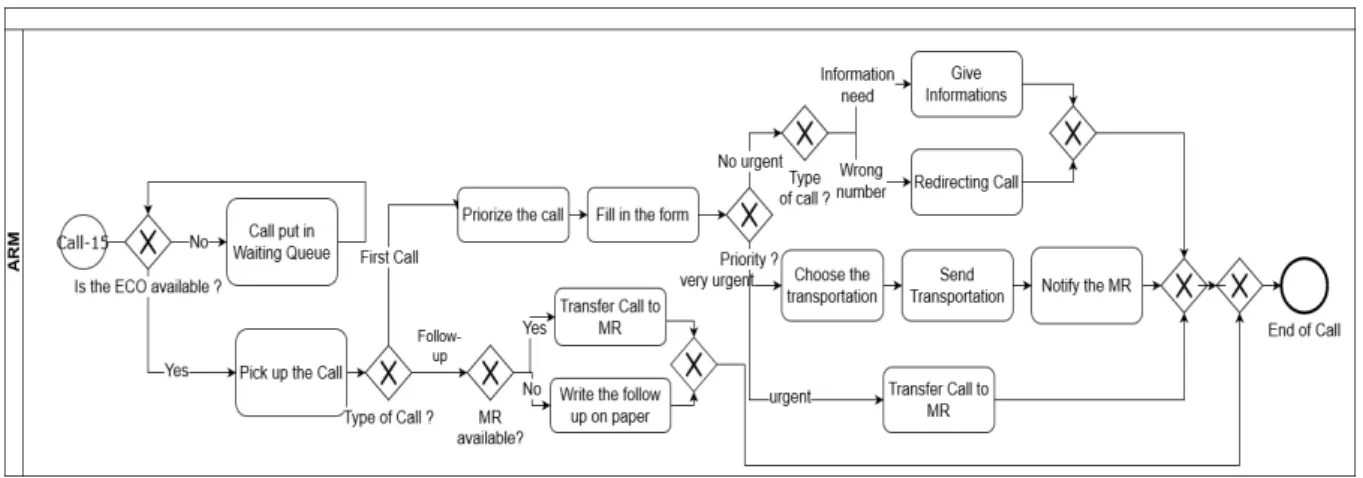
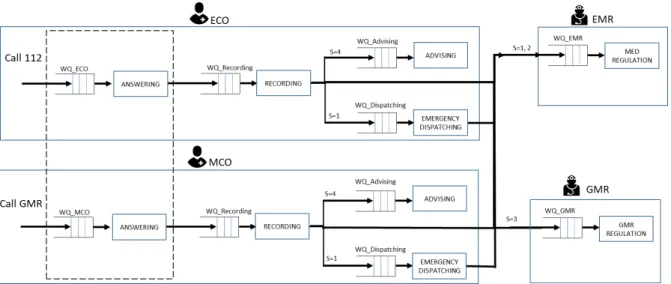
Additionally, we made practitioners’ interviews and observations on site during 3 shifts in order to qualify how the process run and to identify the rules of resource management on one hand, and of prioritization on the other hand. Figure 3 and Figure 4 illustrate these through a BPMN and a Flow Diagram representation.
Figure 4. Example of Flow Diagram resulted from the interviews and observations
In this case, call operators who answer the calls and set the level of severity and physicians are the used resources. In the following we consider Emergency call Operators (ECO) and Medicine Call Operators (MCO) for general medicine calls. Once a call is answered by a CO it is transferred to an Emergency Medical Regulator (EMR) or a General Medical Regulator (GMR) who are both Physicians. The calls have three different severity levels: S=1 for calls which need a diagnosis by an EMR, S=2 for calls which need a diagnosis by a GMR and S=3 for calls which need only a piece of advice. At this stage, the data are completed with the skill of the resources. The noticed distribution is like mentioned on Table 1.
Table 1: Call severity repartition between incoming flow
Phase 2: ECC process mapping
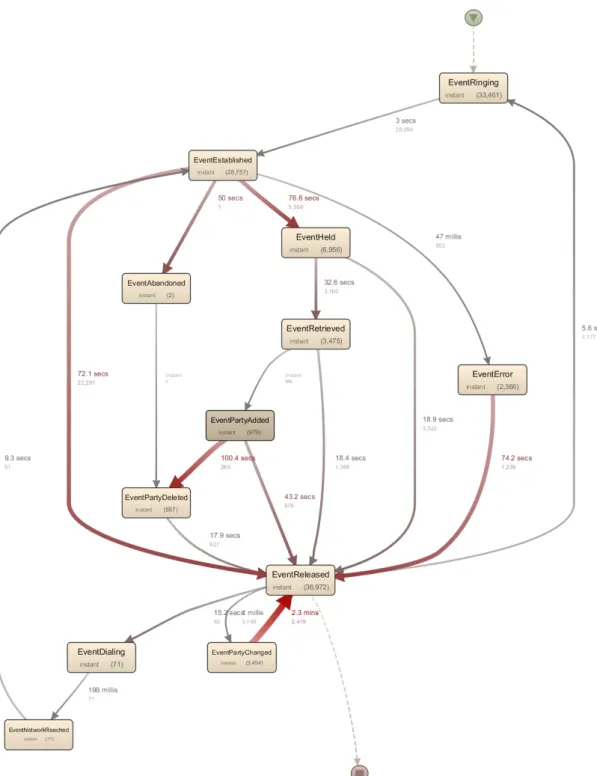
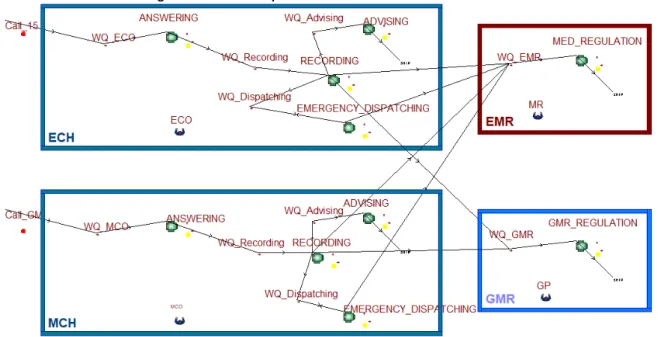
During this phase, we applied a Process-Mining approach on the data set we gathered from Phase 1. It results the mapping shown on Figure 5. This mapping indicates the median duration between events, and the number of occurrences for each activities’ path. Time between two events corresponds to either a waiting time or a communication time with one resource from the ECC.
EventRinging – Event Established: waiting time between the call arrives and when pick it up.
Event Established – (EventHeld OR EventReleased OR): communication time that can vary function of the skills that are used (qualification, regulation, etc.).
Event Held - (Event Retrieved OR EventReleased): waiting for another activity. Event Retrieved -Event Released: communication time.
EventReleased-EventPartyChanger: instananeous event which means that the call is picked up by a first resource and directly transmitted to a second one.
ReventPartyChanged -EventReleased: communication between the second resource (generally a physician) and the caller before the end of the call.
The main benefit of this step consists in getting accurate parameters for the discrete event simulation model to be implemented in the following phase.
Severity Emergency General Medicine Diagnosis
E C C 1 20.2% 1% 2 0.5% 16.7% 3 79,3% 82.3%
Figure 5. Obtained Process Mapping
Phase 3: ECC digital modeling
The discrete event simulation model was developed on Witness® software. The incoming calls were based on the profiles’ analysis briefly described on Figure 2. The model was set up accordingly to the parameters extracted from the real dataset preprocessed through the process-mining step executed in Phase 2. The model was calibrated by comparing the simulated outputs with the real ones through a Pearson Test. We obtained the value of 95% on this test and considered that the model was valid. Figure 5 shows a screenshot of the discrete event simulation model developed.
Figure 6. Screenshot of the discrete event simulation model developed.
Phase 4: ECC organizational experiments
During this phase, we decided to focus on an unexpected spike of demand – ten times as many calls in the 8-9 pm – following a crisis (huge car accident, terrorist attack, etc.). The experiment scenarios were:
Scenario 1: the baseline, considering normal demand and 2 dedicated resources, one for emergency calls, one for generalist calls.
Scenario 2: crisis scenario considering the spike of demand and the same organization. Scenario3: crisis scenario considering the spike of demand and multi-skills resources.
Scenario 4: crisis scenario considering the spike of demand, multi-skills resources and one additional resource available on-demand who can come from another ECC.
Phase 5: ECC organizational recommendations
The results of the simulation are given on Table 2. KPIs that have been used for this assessment where the Quality of Service (QS) ratio defined as the number of calls answered within x seconds on the total of calls received. In this case, we considered QS20 and QS60, with an objective of 95% and 100% respectively. Additionally, we also measured the time to recovery (i.e. time to answer all the calls and to come back to a normal situation), in order to estimate the resiliency capability of the ECC.
Table 2: Simulation Results
It appears that the existing organization of this ECC fails to get the “normal” objectives of QS20 and QS60. It highlights that the existing resources are probably not sufficient and/or not well organized regarding the performance objectives. Different actions should be studied in order to improve the nominal performance of this ECC like for instance: additional resource, development of the multi-skills resources, mutualization with another ECC, etc.
Regarding the second scenario, results are logically worst. The simulation demonstrated that in case of crisis the current organization will have huge difficulties to answer to all beneficiaries in a reasonable amount of time. Particularly, the time to recovery is particularly high, with more than 2 hours to go back to normal. Scenarios 3
Scenario Max WT QS20 QS60 TtoR
S1 00:09:35 61% 72% -
S2 01:05:48 45% 54% 02:07:00
S3 00:21:36 72% 75% 01:06:57
and 4 demonstrate that multi-skills resources allow improving a lot the ECC organization by increasing of 27% QS20 and of 21% QS60. It means that this improvement axis is probably very relevant for this ECC. Working on collaboration by using additional resource on demand, also appears particularly relevant by allowing to win 11% and 12% on QS20 and QS60 respectively.
Obviously, the purpose of this case is not to focus on the improvements of this specific ECC but to demonstrate that such a proposal can be useful for supporting the organizational improvements of ECCs.
CONCLUSION AND FURTHER RESEARCH
Emergency Call Centers (ECCs) are critical, heterogeneous and complex organizations that often perform not optimally. There is a need for them to engage some continuous improvement steps, and consequently there is a need for dedicated decision support systems. The current research work develops a contribution to fill this gap through a 5-phases framework and its associated tools. This framework is data-driven and use discrete event simulation technique as a backbone to ensure accuracy and relevancy on the analyses and recommendations. The paper also develops a brief ongoing real case to highlight the usability of the framework. Obviously, this research work remains in its infancy and there are still many avenues for improvement. Notably, the authors would want to extend significantly the experiments in order to better assess the benefits and limits of the proposal. Particularly, the authors would want to study more precisely the expected impact of multi-skills resources and ECCs’ collaboration and/or mutualization.
REFERENCES
A. M. Law et D. w Kelton, Simulation Modeling and Analysis. McGraw·HiII, 2000.
C. M. Passmore et J. Zhan, « Determining Appropriate Staffing Adjustments in a Call Center Staff Group », in 2013 International Conference on Social Computing, 2013.
D.M. Goldberg, P.K. Garvey, L. Xia, and S. Hong. “Modeling local ambulance resource scheduling.” 25th Americas Conference on Information Systems (AMCIS), 2019.
E. Petitdemange, F. Fontanili, E. Lamine and M. Lauras, Tool-Based Framework to Assess and Challenge the Responsiveness of Emergency Call Centers. IEEE Transactions on Engineering Management, 2019. E. S. Devlin, Crisis Management Planning and Execution. Auerbach Publications, 2006.
G. Koole et A. Mandelbaum, « Queueing Models of Call Centers: An Introduction », Ann. Oper. Res., vol. 113, no 1‑4, p. 41‑59, juill. 2002.
G. Robinson et C. Morley, « Call centre management: responsibilities and performance », Int. J. Serv. Ind. Manag., vol. 17, no 3, p. 284‑300, mai 2006.
J. G. Dai et S. He, « Estimating customer patience-time density in large-scale call centers », in 2010 7th International Conference on Service Systems and Service Management, 2010.
J. Hodgetts and J. Smith, « Essential role of prehospital care in the optimal outcome from major trauma », Emerg. Med., vol. 12, no 2, p. 103‑111, 2000.
J. Vincent, « EXCLUSIF. Palmarès des hôpitaux et cliniques : les nouveautés 2018 », Le Point.fr, vol. 201808, August 2018.
K. J. Song et al., « Dispatcher-assisted bystander cardiopulmonary resuscitation in a metropolitan city: A before–after population-based study », Resuscitation, vol. 85, no 1, p. 34‑41, janv. 2014.
K.M. Haque, V.C. Chen, and B.L. Huff. “A discrete-event simulation model for adaptive allocation of police patrol.” Proceedings of the IIE Annual Conference, pp. 1169-1174, 2017.
L. Brown et al., « Statistical Analysis of a Telephone Call Center: A Queueing-Science Perspective », p. 61, 2005.
Mission d’Audit d’Expertise et d’Audit Hospitalier (MeaH)., « Organisation des Centres 15 : “chaque appel compte, chaque seconde compte”. », MEAH, 2008.
M. van Buuren, G.J. Kommer, R. van der Mei, and S. Bhulai. “EMS call center models with and without function differentiation: A comparison.” Operations Research for Health Care 12, pp. 16-28, 2017. N. Gans, G. Koole, et A. Mandelbaum, « Telephone Call Centers: Tutorial, Review, and Research Prospects »,
N. Gans, N. Liu, A. Mandelbaum, H. Shen, et H. Ye, « Service times in call centers: Agent heterogeneity and learning with some operational consequences », in Institute of Mathematical Statistics Collections, Beachwood, Ohio, USA: Institute of Mathematical Statistics, 2010
N. Sikka and G. Margolis, « Understanding diversity among prehospital care delivery systems around the world », Emerg. Med. Clin., vol. 23, no 1, p. 99‑114, févr. 2005
O. Garnett, A. Mandelbaum, et M. Reiman, « Designing a Call Center with Impatient Customers », Manuf. Serv. Oper. Manag., vol. 4, no 3, p. 208‑227, juill. 2002.
R. Zhou et D. Soman, « Looking Back: Exploring the Psychology of Queuing and the Effect of the Number of People Behind », J. Consum. Res., vol. 29, no 4, p. 517‑530, mars 2003.
T. R. Robbins, D. J. Medeiros, et T. P. Harrison, « Does the Erlang C model fit in real call centers? », 2010, p. 2853‑2864.
Van Der Aalst, Wil. Process mining: discovery, conformance and enhancement of business processes. Vol. 2. Heidelberg: Springer, 2011.
Y. Penverne et al., « Key performance indicators’ assessment to develop best practices in an Emergency Medical Communication Centre. », Eur. J. Emerg. Med. Off. J. Eur. Soc. Emerg. Med., mai 2017.