Trophic interactions between two neustonic organisms: insights from
Bayesian stable isotope data analysis tools
Gilles Lepoint
1,*, Laurent Bernard
1, Sylvie Gobert
1& Loïc N. Michel
1 1 Laboratory of Oceanology, FOCUS centre, University of Liège.* Corresponding Author: [email protected]
ABSTRACT. The by-the-wind sailor Velella velella (Linnaeus, 1758) and its predator, the violet snail Janthina globosa (Swainson, 1822) are both floating neustonic organisms. Despite their global oceanic distribution and widespread blooms of V. velella in recent years, many gaps remain in our understanding about prey/predator interactions between these two taxa. Using stable isotope ratios of carbon and nitrogen, we aimed to study the trophic relationship between V. velella and J. globosa and investigate diet variation of V. velella and J. globosa in relation to individuals’ size. Bayesian approaches were used to calculate isotopic niche metrics and the contribution of V. velella to the J. globosa diet. Our data showed that the isotopic niche of V. velella differed markedly from that of J. globosa. It was larger and did not overlap that of the J. globosa, indicating a more variable diet but at a lower trophic level than J. globosa. The isotopic niche of V. velella also varied according to the size class of the individual. Small individuals showed a larger isotopic niche than larger animals and low overlap with those of the larger individuals. J. globosa displayed very low isotopic variability and very small isotopic niches. In contrast, there were no isotopic composition nor isotopic niche differences between J. globosa of any size. This very low isotopic variability suggested that J. globosa is a specialist predator, feeding, at least in this aggregation, principally on V. velella. Moreover, outputs of a stable isotope mixing model revealed preferential feeding on medium to large (> 500 mm2) V. velella colonies. While our isotopic data
showed the trophic relationship between V. velella and J. globosa, many questions remain about the ecology of these two organisms, demonstrating the need for more fundamental studies about neustonic ecosystems. KEY WORDS: Janthina globosa, Velella velella, Mediterranean Sea, neuston, SIBER, SIAR
INTRODUCTION
The by-the-wind sailor Velella velella (Linnaeus, 1758) and the violet snail Janthina
globosa (Swainson, 1822) are both neustonic
organisms, i.e., organisms that live upon the upper surface of the ocean and inland waters or beneath its surface film (see definition review by Marshall & Burchardt, 2005). The colonial
V. velella (Cnidaria, Hydrozoa, Anthoathecata)
floats partly in and partly out of the water whereas
J. globosa (Mollusca, Gastropoda) is found
just beneath the surface, floating with the head pointing down. Both possess floating structures (i.e., chitinous float and bubble raft, respectively), both are unable to swim, and both are passively
transported by winds and surface currents. They accumulate in oceanic divergences, where other floating and positively buoyant organisms, such as fish eggs or macrophyte rafts, also concentrate (Zaitsev, 1971; Marshall & Burchardt, 2005; Purcell et al., 2012). These two offshore oceanic species have a worldwide distribution and may sometimes be found stranded in vast numbers on beaches (Wilson & Wilson, 1956; KeMP, 1986). In recent years, widespread blooms of V. velella have been observed (Purcell et al., 2015).
Velella velella is a zooplankton feeder,
preying actively on diverse planktonic taxa (e.g., copepods, fish larvae), fish eggs or
organisms associated with floating macroalgal rafts (Purcell et al., 2012). Moreover, it hosts symbiotic zooxanthellae, containing chloroplasts (BanasZah et al, 1993). Therefore, it has a relatively varied diet, mixing diverse animal prey and, potentially, symbiotic inputs.
Janthinids are considered to be strict carnivores highly specialised in the consumption of neustonic cnidarians (essentially V. velella, the blue button Porpita porpita and the Portuguese man-of-war Physalis physalis; Bieri, 1966). This has been shown in both laboratory and field conditions, but only through discrete observations of ingestion. Moreover, it is not established whether all individuals of a particular population of a Janthina species have exactly the same diet or if variability may occur, for example across individuals of different size. Overall, many gaps remain in our understanding of prey/predator interactions between these two taxa.
Stable isotope ratio measurements are now a classical method used to delineate trophic relationships and to study animal diets (deniro & ePstein, 1981). This technique relies upon the fact that the isotopic composition of consumer tissues is the weighted average of the isotopic composition of its food sources, modified by the net isotopic fractionation between diet and animal tissues. Isotopic fractionation (i.e., isotopic composition changes between a substrate and a product, or between two physical states for example) is the result of isotopic effects (i.e., small differential physico-chemical comportments of each isotope), due to mass difference between isotopes. More recently it has been proposed that the variability in isotopic composition of a population or a species (i.e., its isotopic niche) may be used as a proxy to assess the trophic niche of this population or species, and/or the degree of individual specialisation in the population (BearhoP et al., 2004). This isotopic niche concept has also been developed considerably through diverse numerical methods (MattheWs & MaZuMder, 2004; layMan et al., 2007; neWsoMe et al., 2007; JacKson et al., 2011).
Using stable isotope ratios and Bayesian numerical tools, the goals of this study were: (1) to study the trophic relationship between
V. velella and J. globosa using trophic biomarkers;
(2) to assess the degree of specialism exhibited by J. globosa and (3) to investigate potential differences in feeding habits of individuals of
V. velella and J. globosa of different sizes.
MATERIAL AND METHODS
Sample collection and preparation
Velella velella and Janthina globosa were
sampled on 23 May 2012 in Calvi Bay (Corsica), from large accumulations present in the surface waters of the harbour of the STARESO oceanographic station (University of Liège). To the best of our knowledge, this was the first time that J. globosa had been observed in Calvi gulf since being recorded there by the University of Liège in 1968. It does not belong to the neuston normally inhabiting the bay (collard et al., 2015), so the organisms probably came from offshore areas and passively accumulated in the bay. This exceptional event gave us an opportunity to sample 73 hydrozoan colonies and 74 gastropods, encompassing all size classes observed in the swarm, composed of thousands of individuals. Specimens were sampled using a landing net, manually separated and conserved individually at -28°C until further analysis.
V. velella float length and width were measured
to the nearest mm and float area was calculated assuming an elliptical shape using the following formula: A = πab, where a is half the length and b half the width of the float. Janthina globosa aperture width was measured as a proxy of shell size. V. velella were freeze-dried and analysed as a whole after being reduced to homogeneous powder. Gastropod individuals were dissected to separate the foot muscle from other organs. Muscle samples were then freeze-dried and reduced to homogeneous powder for isotopic analysis.
Isotopic measurements
Isotopic ratios of carbon and nitrogen were measured on IR-MS (Isoprime 100, Isoprime, UK) coupled with an N-C-S elemental analyser (Vario Microcube, Elementar, Germany). Stable isotope ratios were expressed in δ notation according to coPlen (2011). Certified materials were IAEA-N2 (δ15N = +20.30 ± 0.20 ‰) and
IAEA C-6 (sucrose) (δ13C = –10.80 ± 0.47 ‰).
Repetitive measurements of glycine (δ15N = 2.25
± 0.3 ‰; δ13C = -47.5 ± 0.3 ‰) were also used
to calibrate isotopic data and as an elemental standard. One of the samples was randomly selected and analysed multiple times (once every 15 analyses). Repeatability of these replicate measurements was 0.3 ‰ for both δ13C and δ15N.
Elemental data are expressed in %Dry Mass, and C/N ratios are weight-based.
Statistical analysis
A Mann-Whitney U test was used to test differences between the stable isotope compositions of the two consumers.
Individuals of V. velella and J. globosa were,
a posteriori, attributed to different size classes,
based on float area (0-500, 501-1000; 1001-1500 mm2) and aperture width (10-13, 14-18, 19-22
mm), respectively. Allocation to size classes was done by dividing the size range by three, representing small, medium and large individuals in the sampled raft. This was necessary to run the SIAR model. We believe it is of ecological relevance to divide size range into small, medium and large classes and that these size classes reflect the size range observed in the raft. Differences among stable isotopic compositions of respective sizes classes were tested using a non-parametric Kruskal-Wallis test, because conditions for a parametric approach were not present for all groups. Dunn’s Multiple Comparison Tests were used to assess pairwise differences when Kruskal-Wallis revealed statistically significant effects. All test results were considered as significant when p was ≤
0.05. Statistical analyses were conducted using Prism 5.04 (GraphPad Software, La Jolla, USA).
SIBER modelling
Isotopic niche parameters were computed using SIBER (Stable Isotope Bayesian Ellipses in R; JacKson et al., 2011) package (version 2.0) in R 3.2.2 (R Development Core Team, 2008). SIBER was used to generate bivariate standard ellipses that represent core isotopic niches of consumers. Areas of the ellipses associated with each species (SEAB) were computed using Bayesian modelling (106 iterations), and direct pairwise comparisons
of SEAB were performed. Model solutions were presented using credibility intervals of distributions of probability density function.
SIAR Modelling
The stable isotope mixing model SIAR (Stable Isotope Analysis in R; Parnell et al., 2010) was used to estimate the relative contribution of different V. velella size classes (isotopic sources) to the diet of J. globosa. SIAR 4.2 was fitted in R 3.2.2., including isotopic compositions of each individual, isotopic compositions of food sources (mean ± SD) and trophic enrichment factors (TEFs; expressed as mean ± SD) that correspond to the net isotopic composition change between a consumer and its ingested food source(s).
Here, TEFs for both isotopic ratios were derived from our data using the difference between individual measurements (n=74) of isotopic composition of muscle of J. globosa and the average isotopic composition of V.
velella. Individual TEFs were then averaged
to obtain a mean TEF (and associated standard deviation) to be introduced into the SIAR model. Food sources for J. globosa were the different size classes of V. velella (see above). Model was run with 106 iterations and burn-in size was set
as 105. Model solutions were presented using
frequency histograms of probability density functions (Parnell et al., 2010).
RESULTS
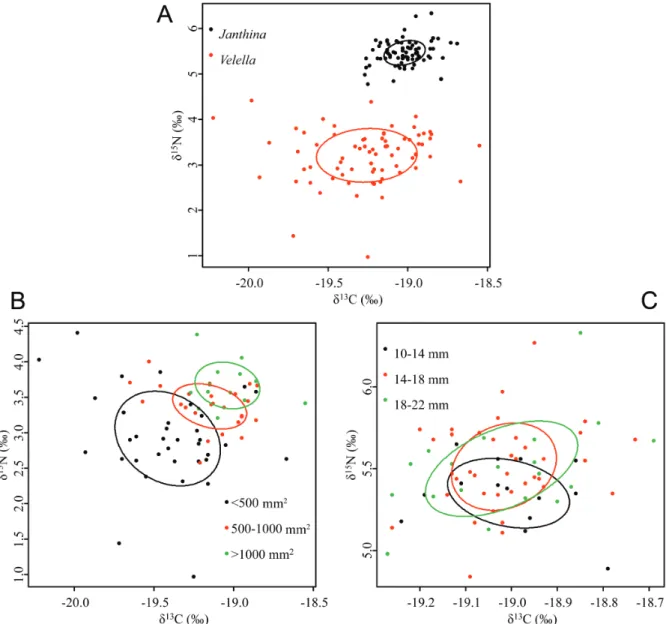
δ15N and d13C values of V. velella ranged
from 1.1 to 4.4 ‰ and from -20.2 to -18.6 ‰, respectively (Fig. 1a). They differed significantly from those of J. globosa (Mann-Whitney U, p<0.001 for both stable isotope ratios). d15N and
d13C values of J. globosa ranged from 4.8 to 6.3
‰ and from -19.3 to -18.7 ‰, respectively. TEF values for J. globosa were 2.3 ± 0.3 ‰ and 0.2 ± 0.1 ‰ (mean ± S.D., n= 74) for d15N
and d13C, respectively.
There was no overlap between the isotopic niches of V. velella and that of J. globosa
(Fig. 1a). Standard Ellipse Area (SEA) of
V. velella was greater than that of J. globosa
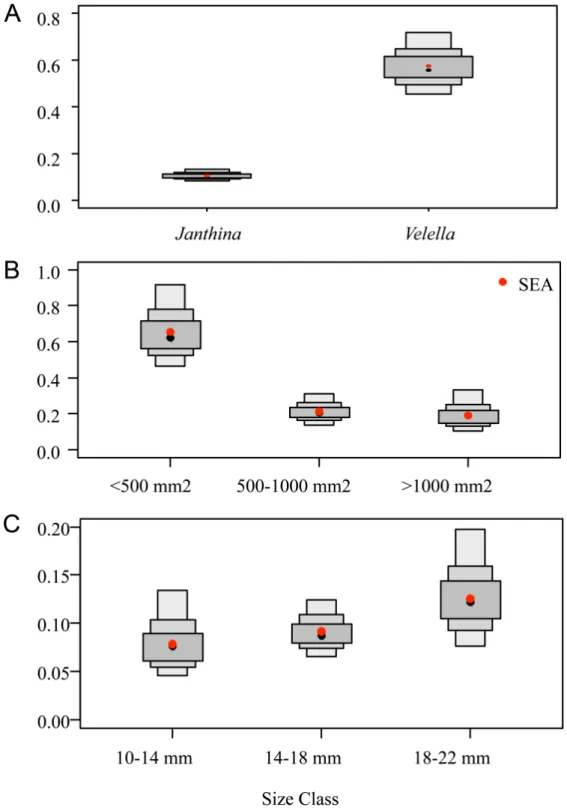
(0.574 vs. 0.106 ‰2). This is confirmed by SEA B
estimation, which showed that, in more than 99.99 % of the solutions generated by the model, ellipses for V. velella were greater than those calculated for J. globosa.
δ15N and 13C values for the different V. velella
size classes differed significantly (Kruskal-Wallis test, p < 0.001; Fig. 1b). The smallest
V. velella (< 500 mm2) displayed significantly
lower d15N and more negative d13C values than
those of the other two size classes (Dunn’s Multiple Comparison Tests, p < 0.01 for all). d15N and d13C values of medium and large size
Fig. 1. – Stable isotope compositions of V. velella and J. globosa. Symbols are individual measurements, and lines are are bivariate standard ellipses that represent the core isotopic niches of consumers. A. V. velella vs. J. globosa. B. Different size classes of V. velella. C. Different size classes of J. globosa.
Fig. 2. – Boxplots of model-estimated bivariate standard ellipse area (SEAB). A. V. velella vs. J. globosa.
B. different size classes of V. velella. C. different size classes of J. globosa. Dark, median and light grey boxes
are respectively the 50 %, 75 % and 95 % credibility intervals of probability density function distributions of the model solutions, and black dots are the modes of these distributions. Red dots are the SEA values associated with each group.
classes did not differ significantly (Dunn’s Multiple Comparison Tests, p ≥ 0.5).
SEA of small V. velella was greater than for medium and large individuals (0.654 vs. 0.212
and 0.190 ‰2, respectively; Fig. 1b). SEA B
calculations suggested that this was true in over 99.99 % of model runs (Fig. 2b). SEAs of small and medium V. velella overlapped by 0.054 ‰2
of medium and large individuals overlapped by 0.62 ‰2 (i.e., about 30 % of medium SEAs).
There was no overlap between SEAs of small and large individuals.
There was no significant difference between the d15N and d13C values of the three mollusc
size classes (Kruskal-Wallis test, p ≥ 0.05; Fig. 1c). Although SEA of individual J. globosa seemed to increase according to size (0.079, 0.091 and 0.125 ‰2 for small, medium and large
size classes, respectively; Fig 1c), SEAB did not differ between the three size classes (Fig. 2C). Overlap between SEAs of the three size classes of J. globosa was very large (from 0.051 to 0.092 ‰2). Overlap between small and medium
janthinids represented 65 % of the SEAs of small janthinids (Fig. 1c). Overlap between medium and large janthinids represented 100 % of the SEA of medium janthinids (Fig 1c). Overlap between small and large janthinids represented 72 % of the SEA of small janthinids.
Because there was no significant difference between the stable isotopic composition of medium and large V. velella, SIAR modelling was run with two potential food sources: Velella <500 mm2 and Velella >500 mm2. According
to model outputs, the two size classes did not contribute equally to the janthinid diet (Fig. 3). The contribution of medium and large V. velella was greater than that of small individuals in
Fig. 3. – Contribution of small and medium/large V. velella to the J. globosa diet, computed using SIAR. Data are presented as frequency histograms of probability density functions of the model solutions.
98.77 % of model solutions. The contribution of small V. velella to the J. globosa diet ranged from 0.25 to 0.55 (mode: 0.46), while for medium and large V. velella, it ranged from 0.40 to 0.75 (mode: 0.58).
DISCUSSION
Our isotopic data showed the trophic relationship between V. velella and J. globosa, confirming previous results from stomach content examinations and feeding observations (e.g., Bieri, 1966). The nutritional quality of
V. velella as a food for J. globosa could appear
questionable because jellyfish are generally considered to be of low nutritional quality (e.g., Bullard & hay, 2002). However, C/N ratios of V. velella were relatively close to C/N ratios of J. globosa muscles (4.5 ± 0.2 vs. 3.6 ± 0.1, respectively) indicating that V. velella could be a suitable food source. Indeed, this C/N value indicates a high protein content and matches a previous observation for the closely related species Porpita porpita (Bullard & hay, 2002), another neustonic species consumed by janthinids. Protein contents of P. porpita were much higher (18 mg.ml-1) than in other gelatinous
plankton species (< 0.1 mg.ml-1 for common
schyphozoans such as Aurelia sp.) making them valuable prey for predatory organisms despite their nematocyst protection (Bullard & hay, 2002). Nutritional value and the presence/absence of nematocysts are the main parameters explaining the consumption (or not) of gelatinous plankton by predators (Bullard & hay, 2002). V. velella colonies have numerous small gasterozoids with venomous nematocysts to defend the colony and to capture prey. It seems that, in common with other cnidarian-eating specialists such as the leathery turtle Dermochelis coriacea, the loggerhead sea turtle Caretta caretta or the moonfish Mola mola (cardona et al., 2012),
J. globosa is able to tolerate nematocyst attacks.
Despite these poisonous cells, janthinids may target the soft tissues of the biggest V. velella (Bayer, 1963), largely ignoring sail and float. This could be a way to optimise food quality,
as the chitinous float and sail of V. velella are potentially less palatable than the colony’s soft tissues (Bayer, 1963).
The trophic enrichment factors (i.e., the difference between the stable isotope composition of a consumer and the stable isotopic composition of its food) observed here are in the range reported for carnivorous marine invertebrates (Mccutchan et al., 2003). The TEF values calculated here are based on the difference between isotopic compositions of individual J. globosa and the average δ15N of V. velella. This is only truly valid if J. globosa feed
exclusively on V. velella in the study area and if they have only been feeding on V. velella for a long period preceding the sampling. As V. velella is the most important neustonic hydrozoan in this area, and considering the extent of the sampled raft (i.e., thousands of V. velella), we consider that these assumptions were valid in this case but we cannot totally exclude that other food sources are occasionally eaten by J. globosa. Another incertitude in this calculation is the fact we averaged a global V. velella isotopic composition without taking into account the possibility of size selectivity by J. globosa (see modelling results below), and differences in isotopic composition of different V. velella size classes. Looking at nitrogen TEFs, these appear comparable to those measured between the schyphomedusa
Chrysaora plocamia and its parasitic amphipod Hyperia curticephala (2.3 ± 0.3 vs. 1.6 ‰,
respectively; riascos et al., 2015), while carbon TEFs seem lower (0.2 ± 0.1 vs. 1 ‰) perhaps in relation to good nutritional quality of V.
velella. For 15N, in comparison to other molluscs,
TEFs are comparable with the upper range, yet higher than values measured for herbivorous gastropods (0.4 to 2.0 ‰; chiKaraishi et al., 2007). TEFs measured here are also markedly different from TEFs measured for the bivalve
Mytilus edulis (2.2 ‰ and 3.8 ‰ for carbon and
nitrogen, respectively; duBois et al., 2007). This observation supports the hypothesis that diet type (here carnivorous vs. herbivorous or suspension feeder) is often more reliable in explaining TEF
variability than phylogeny or life environment (caut et al., 2009).
The isotopic niche of V. velella differed markedly from that of J. globosa. It was larger and did not overlap, indicating a more variable diet but at a lower trophic level than J.
globosa, as indicated by d15N values. V. velella
is an opportunistic zooplankton feeder, eating copepods, fish eggs and larvae and other mesozooplanctonic organisms (Purcell et al., 2012). Nevertheless, when possible, it shows positive selection of some zooplankton items (fish larvae and copepods; Purcell et al., 2012). Moreover, it could derive a part of its organic matter from its symbiosis with zooxanthellae (BanasZah et al., 1993), which could contribute to enlarging its isotopic niche and lowering its trophic level.
Nevertheless, the isotopic niche of V. velella varied according to size: small individuals showed a wider isotopic niche than that of larger individuals, and showed low to no overlap with those of larger individuals. In addition, d15N
values were lower for the smallest V. velella than for the two other size classes. There are other examples among jellyfish of isotopic variability according to size, related to diet or trophic level shift (e.g., FleMing et al., 2015; riascos et al., 2015). Here, smaller V. velella most likely have a more diversified diet that larger ones but feed at a lower trophic level (smaller prey for example). Indeed, FleMing et al. (2015) have suggested that jellyfishes of different sizes present simultaneously in a water column occupy different trophic positions in the food web.
A second, not exclusive, explanation is that the isotopic composition of smaller individuals may not be at isotopic equilibrium with their current food. V. velella individuals we sampled were from a neustonic colony, composed of many individuals and reproducing asexually. However, colony founders are produced sexually from medusae living in deep waters, between 100 and 800 m depth in the Mediterranean (larson, 1980). Founders begin their life at that depth
and, therefore, their initial isotopic composition reflects their feeding in the epipelagic zone where isotopic composition of prey may differ from the euphotic zone. Because of tissue renewal, it takes time to go from an initial isotopic composition to one reflecting that of a changed diet (MattheWs & MaZuMder, 2005). This additional source of variability linked to habitat may also explain the larger isotopic niche of small individuals (Flaherty & Ben -david, 2010). Moreover, each individual may originate from different epipelagic areas and join the neustonic raft at different moments and in different locations. Neustonic organisms indeed passively accumulate according to wind pattern and Langmuir cell organisation (Zaitsev, 1971). Finally, V. velella could partly rely on a symbiosis with zooxanthellae to find its nutritional balance (BanasZah et al., 1993). Although these symbionts are already present in medusae and larvae (BanasZah et al., 1993), the contribution of these symbiotic relationships to the diet of V. velella may vary according to size. In contrast to V. velella, the J. globosa displayed a very low isotopic variability (± 0.3 and 0.1 ‰ S.D. for d15N and d13C, respectively, n= 74).
This variability is lower than the instrument repeatability of our measurement system (cf. “Material and Methods” section). It is largely inferior to isotopic variability measured for other planktonic or benthic organisms sampled from Calvi bay (lePoint et al., 2000; Michel et al., 2014), or for other predatory marine gastropods such as Terebrids (Fedosov et al., 2014). Moreover, it was impossible to see any variability in relation to the size of our individuals. Commonly, in both fish and invertebrates, diet changes according to age (change of prey and/or trophic level; Jennings et al., 2008; Frederich et al., 2010; riascos et al., 2015). As indicated by the absence of 15N variability, in this sampled
raft, J. globosa did not shift to other prey or other trophic levels during their growth. Laboratory observations report the existence of cannibalism by larger individuals on smaller ones (Bayer, 1963). It was apparently not common in our population, since the trophic level (i.e. d15N)
did not increase according to individual size and d15N values were consistent with one trophic
level increase between V. velella and J. globosa. Most isotopic niche studies focus on generalist species or populations, trying to determine the degree of individual specialisation or isotopic niche area and overlap (layMan & allgeier, 2012; FleMing et al., 2015). BearhoP et al. (2004) hypothesized that a specialist population (or species) composed of individuals feeding on the same unique food source, or a generalist population composed of generalist individuals all feeding on exactly the same food sources, should display almost no isotopic variability, compared to a generalist population composed of individuals feeding on different food sources. This has been demonstrated experimentally by diet-controlled experiments (FinK et al., 2012). The very low isotopic variability recorded here for J. globosa supports the idea that the hypothesis of BearhoP et al. (2004) applies also for this natural population. Nevertheless, the extremely low isotopic variability observed here (i.e. close to 0) cannot be attributed to a generalist population composed of generalist individuals (i.e. with a diet composed of different food sources) because this would imply that every
J. globosa individual fed on exactly the same
food sources in the same proportion. In natural populations, when more than one food source is eaten, there is always an isotopic variability link to small diet difference between individuals. This could indicate that our population was composed of individuals feeding almost exclusively on the same unique food source, namely the V. velella.
Here, in this population, the diet of J. globosa could be invariable regardless of age and could be exclusively one prey. However, we may hypothesise that inter-population variability in feeding habits may occur. Gut content examinations have shown that other pelagic prey may be consumed (P. porpyta, Physalis physalis, tropical pelagic anemones; Bieri, 1966). In addition, cannibalism has also been observed (Bayer, 1963), although not demonstrated by our data set (i.e., no increase of δ15N with individual
size). We sampled just one J. globosa population associated only with abundant numbers of V.
velella meaning individuals were probably easily
able to find sufficient food by preying exclusively on V. velella. Nevertheless, these two species are cosmopolitan and may encounter different life conditions (e.g., a different mix of neustonic species, less availability of prey and starvation), depending of the area where they live (tropical vs. temperate for example) and raft history.
SIAR modelling showed an effect of V. velella class size on diet of J. globosa related to size of
V. velella. TEFs used to run the model did not
taken into account the different size classes of
V. velella. Nevertheless, we believe that any
possible uncertainty arising as a consequence of TEF variability is taken into account by the standard variation introduced around our average TEF, and overall believe that our mixing model remains valid against this potential incertitude. SIAR modelling demonstrated that J. janthina feed preferentially on bigger V. velella. Janthina spp. may chew an entire individual of V. velella within a few hours (Bayer, 1963). But it has also been observed that Janthina spp.only graze on the soft part of V. velella leaving the chitinous part of the colony (Bayer, 1963). Large V.
velella individuals offer more soft tissues than
little ones, which may explain this preference. Moreover, J. globosa were also observed discarding their bubble raft, climbing on colonies of V. velella to graze on their soft parts and then reforming a new bubble raft (Bayer, 1963). Such behaviour is probably only possible when V. velella are large enough to support the weight of the janthinids. Indeed, janthinids are unable to swim and sink to their death when separated from their bubble raft (Bayer, 1963). Feeding behaviour could therefore explain the preferential consumption of medium to large
V. velella colonies. The neustonic ecosystem is
omnipresent, as more than 70 % of Earth’s area is covered with water. Here, we showed that much is yet to be discovered, even about the basic ecology of cosmopolitan, widespread species. Neuston currently receives little attention, and most of the functioning and biodiversity of these
systems remains unknown. This demonstrates a need for more fundamental studies on neustonic ecosystems and their ecology.
ACKNOWLEDGEMENTS
Authors are grateful to STARESO for their support and for access to laboratory facilities. G.L. is presently Research Associate at Fonds National de la Recherche Scientifique (F.R.S.- FNRS; Belgium). This study was partly funded by TransPolMed project (Fonds Spéciaux ARD, University of Liège). This is MARE paper N° 334.
REFERENCES
BanasZah, at, iglesias-Prieto r & trench
RK (1993). Scrippsiella velellae Sp. Nov.. (Peridiniales) and Gloeodinum viscum Sp. Nov. (Phytodiniales), dinoflagellates symbionts of two hydrozoans (cnidaria). Journal of Phycology 29 (4): 517-528.
Bayer FM (1963). Observations on pelagic mollusks
associated with the siphonophores Velella and Physalia. Bulletin of Marine Science 13 (3): 454-466.
BearhoP s, adaMs ce, Waldron s, Fuller ra
& Macleod H (2004). Determining trophic niche
width: a novel approach using stable isotope analysis. Journal of Animal Ecology 73 (5): 1007-1012.
Bieri R (1966). Feeding preferences and rates of the
snails, Ianthina prolongata, the barnacle, Lepas anserifera, the nudibranchs Glaucus atlanticus and Fiona pinnata, and the food web in the marine neuston. Publications of the Seto Marine Biological Laboratory 14 (2): 161-170.
Bullard sg & hay ME (2002) Palatability of
marine macro-holoplankton: Nematocysts, nutritional quality, and chemistry as defences against consumers. Limnology and Oceanography 47 (5): 1456-1467.
cardona l, de Quevedo ia, Borrell a &
aguilar A (2012). Massive consumption of
gelatinous plankton by Mediterranean apex predators. PLoS ONE 7 (3).
caut s, angulo e & courchaMP F (2009).
Variation in discrimination factors (δN-15 and δC-13): the effect of diet isotopic values and applications for diet reconstruction. Journal of Applied Ecology 46 (2): 443-453.
collard F, collignon a, hecQ Jh, Michel l
& goFFart A (2015). Biodiversity and seasonal
variations of zooneuston in the northwestern Mediterranean Sea. Belgian Journal of Zoology 145 (1): 40-48.
coPlen TB (2011). Guidelines and recommended
terms for expression of stable-isotope-ratio and gas-ratio measurements results. Rapid Communications in Mass Spectrometry 25: 2538-2560.
deniro MJ & ePstein S (1981). Infuence of diet on
the distribution of nitrogen isotopes in animals. Geochimica et Cosmochimica Acta 45: 341-351. duBois s, Jean-louis B, Bertrand B & leFeBvre
S (2007). Isotope trophic-step fractionation of suspension-feeding species: Implications for food partitioning in coastal ecosystems. Journal of Experimental Marine Biology and Ecology 351 (1-2): 121-128.
Fedosov ae, tiunov av, KiyashKo si & Kantor
YI (2014). Trophic diversification in the evolution of predatory marine gastropods of the family Terebridae as inferred from stable isotope data. Marine Ecology Progress Series 497: 143-156. FinK P, reichWaldt es, harrod c & rossBerg
AG (2012). Determining trophic niche width: An experimental test of the stable isotope approach. Oikos 121 (12): 1985-1994.
Flaherty ea & Ben-david M (2010). Overlap and
partitioning of the ecological and isotopic niches. Oikos 119 (9): 1409-1416.
FleMing nec, harrod c, neWton J & houghton
JDR (2015). Not all jellyfish are equal: isotopic evidence for inter- and intraspecific variation in jellyfish trophic ecology. PeerJ 3: e1110.
Frederich B, lehanse O, vandeWalle P &
lePoint G (2010). Trophic niche width, shift,
and specialization of Dascyllus aruanus in Toliara Lagoon, Madagascar. Copeia 2010 (2): 218-226.
JacKson AL, inger R, Parnell AC & BearhoP S
(2011). Comparing isotopic niche widths among and within communities: SIBER - Stable Isotope
Bayesian Ellipses in R. Journal of Animal Ecology 80 (3): 595-602.
Jennings S, MaxWell TAD, schratZBerger M
& Milligan SP (2008). Body-size dependent
temporal variations in nitrogen stable isotope ratios in food webs. Marine Ecology Progress Series 370: 199-206.
KeMP PF (1986). Deposition of organic matter on a
high-energy sand beach by a mass stranding of the cnidarian Velella velella (L.). Estuarine, Coastal and Shelf Science 23 (4): 575-579.
larson RJ (1980). The medusa of Velella velella
(Linnaeus, 1758) (Hydrozoa, Chondrophorae). Journal of Plankton Research 2 (3): 183-186.
layMan CA & allgeier JE (2012). Characterizing
trophic ecology of generalist consumers: A case study of the invasive lionfish in the Bahamas. Marine Ecology Progress Series 448: 131-141.
layMan CA, arrington DA, Montana CG
& Post DM (2007). Can stable isotope ratios
provide for community-wide measures of trophic structure? Ecology 88 (1): 42-48.
lePoint G, nyssen F, goBert S, dauBy P &
BouQuegneau JM (2000). Relative impact of
a seagrass bed and its adjacent epilithic algal community in consumer diets. Marine Biology 136 (3): 513-518.
lorrain A, Paulet YM, chauvaud L, savoye
N, donval A & saout C (2002). Differential
δ13C and δ15N signatures among scallop tissues:
Implications for ecology and physiology. Journal of Experimental Marine Biology and Ecology 275 (1): 47-61.
Marshall, HG & Burchardt L (2005). Neuston:
its definition with a historical review regarding its concept and community structure. Archiv fur Hydrobiologie 164 (4): 429-448.
MattheWs B & MaZuMder A (2004). A critical
evaluation of intrapopulation variation of δ13C
and isotopic evidence of individual specialization. Oecologia 140: 361-371.
MattheWs B & MaZuMder A (2005). Consequences
of large temporal variability of zooplankton δ15N
for modeling fish trophic position and variation. Limnology and Oceanography 50 (5): 1404-1414.
Mccutchan JHJ, leWis WMJ, Kendall C &
Mcgrath CC (2003). Variation in trophic shift
for stable isotope ratios of carbon, nitrogen, and sulfur. Oikos 102: 378-390.
Michel LN, dauBy P, goBert s, graeve M,
nyssen F, thelen N & lePoint G (2014).
Dominant amphipods of Posidonia oceanica seagrass meadows display considerable trophic diversity. Marine Ecology 36: 969-981.
neWsoMe SD, del rio CM, BearhoP S & PhilliPs
DL (2007). A niche for isotopic ecology. Frontiers in Ecology and the Environment 5 (8): 429-436.
Parnell AC, inger r, BearhoP s & JacKson AL
(2010). Source partitioning using stable isotopes: coping with too much variation. Plos One 5(3).
Purcell JE, clarKin e & doyle TK (2012).
Foods of Velella velella (Cnidaria: Hydrozoa) in algal rafts and its distribution in Irish seas. Hydrobiologia 690 (1): 47-55.
Purcell JE, Milisenda G, riZZo A, carrion SA,
ZaMPardi S, airoldi S, ZagaMi G, guglielMo
L, Boero F, doyle TK & Piraino S (2015).
Digestion and predation rates of zooplankton by the pleustonic hydrozoan Velella velella and widespread blooms in 2013 and 2014. Journal of Plankton Research 37(5): 1056 - 1067.
riascos JF, docMac F, reddin C & harrod C
(2015). Trophic relationships between the large scyphomedusa Chrysaora plocamia and the parasitic amphipod Hyperia curticephala. Marine Biology 162 (9): 1841-1848.
Wilson D & M Wilson (1956). A contribution to
the biology of Ianthina janthina (L.). Journal of Marine Biology Association UK 35: 291-305
Zaitsev YP (1971). Marine neustonology. Editor
Vinogradov K.A. Jerusalem, Israel Program for Scientific Translations, 207 pp.
Received: 29 March 2016 Accepted: 15 July 2016