Centre Énergie Matériaux Télécommunications
BROADBAND GRAPHITIC CARBON NITRIDE-BASED
PHOTOCATALYSTS FOR ENVIRONMENTAL AND ENERGY
APPLICATIONS
Par
Qingzhe Zhang
Thèse présentée pour l’obtention du grade de Philosophiae Doctor (Ph.D.)
en sciences de l’énergie et des matériaux
Jury d’évaluation
Président du jury et
examinateur interne Professeur Francois Vidal INRS-ÉMT
Examinateur externe Professeur Adam Duong
Université du Québec à Trois-Rivières
Examinateur externe Professeur Patanjali Kambhampati
Universitéde McGill
Directeur de recherche Professeur Dongling Ma
INRS-ÉMT
Codirecteur de recherche Professeur Mohamed Chaker
INRS-ÉMT
Dedicated to all my teachers,
my friends,
and my family members;
to all the people
ACKNOWLEDGEMENTS
First and foremost, I would like to express my deepest gratitude to my supervisor, Prof. Dongling Ma, for her constant encouragement, invaluable guidance, and immense patience during the past four years. I am extremely grateful for her continuing, unconditional support and for providing me with great opportunities to develop myself, such as attending international conferences, serving as conference assistant, and competing for various awards. Her ability to transform my raw and immature ideas into insightful storylines has always been fascinating me. She helped me to cope with the challenges of academic research and the difficulties in life. I have learned so much from her, including the way of thinking, giving credit to people, valuing collaboration and reputation, and communicating ideas effectively. I feel extremely lucky to be her student to work with her. My special thanks go to my co-supervisor, Prof. Mohamed Chaker, for his substantial support and guidance throughout my Ph.D. journey. He has always been giving me inspiring motivation and encouragement when I was stuck in a problem or could not see the value of my work. He taught me how to know or judge a problem from a macroscopic perspective. He always looks energetic even though he just had a 4-hour sleep one night. It is my great privilege to have had him as my co-supervisor.
Being able to learn from my two supervisors has been my great fortune.
I am indebted to my previous supervisors and teachers, Prof. Yanjun Xin, Prof. Nan Bao, and Prof. Dong Ma who brought me to this research field. Their mentorship made me start along the path to where I am today.
I would like to thank Prof. Francois Vidal, Prof. Adam Duong, and Prof. Patanjali Kambhampati for being the members of my thesis committee and offering their precious comments and valuable time.
I have been fortunate to collaborate with many excellent individuals, including Shuai Zhou, Prof. Nan Bao, Gang Wang, Prof. Yanjun Xin, Dr. Xin Jin, Prof. Luca Razzari, Prof. Alexander O. Govorov, Prof. Giacomo Giorgi, and Prof. Maurizia Palummo, who gave me enormous help both in experimental and theoretical aspects. Their contributions made this thesis possible.
I felt incredibly lucky and a great honor to meet Prof. Ma’s wonderful friends and collaborators, including but not limited to Prof. Nianqiang Wu, Prof. Jin Zhong Zhang, Prof. Baoquan Sun, Prof. Xuhui Sun, Prof. Dunwei Wang, Prof. Hong Liu, Prof. Bruce Koel, and Prof. Ricardo Izquierdo.
Talking with them always benefit me a lot. I especially thank Prof. Nianqiang Wu who enlightened me with his profound knowledge and unique views and encouraged me to aim high.
Prof. Dongling Ma’s group is an amazing community, where I shared joys with and gained assistance from current and former group members and friends, Prof. Zhenhe Xu, Prof. Jiujun Deng, Prof. Jianming Zhang, Prof. Guozhu Chen, Prof. Hongyan Liang, Prof. Haiguang Zhao, Prof. Kun Zhang, Dr. Fan Yang, Dr. Fuqiang Ren, Dr. Long Tan, Dr. Yannan Liu, Dr. Xiaolei Liu, Dr. Amir Mirzaei, Yanlong Liu, Deepak T. Gangadharan, Shengyun Huang, Pandeng Li, Yong Wang, Chen Wang, Ting Yu, Wanting He, and Guolong Song. I especially thank Prof. Zhenhe Xu for training me to start my research work in INRS.
I really enjoy my stay in the INRS-EMT center. I would like to thank Prof. Marc A. Gauthier, Prof. Ana Tavares, Prof. Fiorenzo Vetrone, Prof. Andreas Ruediger, Prof. Shuhui Sun, and Prof. Jinyang Liang, for the inspiring conversations with them. I benefited tremendously from them. I would also like to thank the nice and helpful technicians and administrative staffs in INRS-EMT, especially Christophe Chabanier, Catalin Harnagea, Etienne Charette, Georges Lamoureux, Claude Sirois, Julie Gaudet, Sylvain Gingras, Louise Hudon, Hélène Sabourin, Hélène Tanguay, Michelle Marcotte, Priscille Ernotte, and Jean-Yves Lavoie. I feel lucky to know a lot of friends (in addition to our group members) to share joys with them during the past years, particularly Mengyang Fan, Xin Chai, Li Shi, Yuting Lei, Minghui Hao, Xin Liu, Xianglei Liu, Cheng Jiang, Jiyun Chen, Faying Li, Min Zhang, Na Xu, Daling Cui, Xin Tong, Chao Wang, Hui Zhang, Jiabin Liu, Nathanael Komba, Artiom Skripka, Jesús Angel Valdez, Lucas Vazquez Besteiro, Zineb Matouk, and many others. Thank Xin Chai for helping me in French translation.
I am also very grateful to Jean-Philippe Masse, Gwenaël Chamoulaud, Alexandre Arnold, and Galyna Shul, who provided massive help and support in the characterizations of my samples. Last, but not least, I am profoundly indebted to my grandpa, parents and sister for their continual love, understanding, support, and patience, which keep me grounded and energetic regardless of all the ups and downs in life. They also shared my pains and joys of this journey.
It could not be possible to complete this thesis without the contributions from so many people along the journey in the past four years. The names listed herein are just some representatives I am grateful to, and I apologize in advance if I failed to mention you. But rest assured that I really appreciate those who are reading these lines.
ABSTRACT
As a semiconductor photocatalyst, graphitic carbon nitride (g-C3N4) has attracted tremendous interest of material scientists by virtue of its fascinating merits, such as nontoxicity, facile preparation, moderate bandgap, strong redox capability, “earth-abundant” nature, and good physicochemical stability. However, g-C3N4 still suffers from poor photocatalytic activity and low quantum efficiency due to the high recombination rate of photogenerated charge carriers. Moreover, the optical bandgap (2.7 eV) of g-C3N4 largely restrains the range of its visible light absorption to wavelengths shorter than 460 nm. Thus, the development of efficient and broadband responsive (from ultraviolet (UV), visible to near-infrared (NIR) regions) g-C3N4 based photocatalysts is a task of great significance and urgency, though challenging. In this thesis, three kinds of g-C3N4 based broadband photocatalysts were developed and used in photocatalytic degradation of organic pollutants and green fuel production.
Firstly, a plasmon and upconversion enhanced broadband photocatalyst based on Au nanoparticle (NP) and NaYF4:Yb3+, Er3+, Tm3+ (NYF) microsphere loaded g-C3N4 nanosheets (Au-NYF/g-C3N4) was subtly designed and synthesized. The simple one-step synthesis of NYF in the presence of g-C3N4, which has not been reported in the literature either, leads to both high NYF yield and high coupling efficiency between NYF and g-C3N4. The Au-NYF/g-C3N4 structure exhibits high stability, wide photoresponse from the UV, to visible and NIR regions, and prominently enhanced photocatalytic activities compared with the plain g-C3N4 sample in the degradation of a common pollutant, methyl orange. The high performance of the Au-NYF/g-C3N4 nanocomposite under different light irradiations was ascribed to the distinctively promoted charge separation and suppressed recombination, and the efficient transfer of charge carriers and energy among these components. The promoted charge separation and transfer were further confirmed by photoelectrochemical measurements. Different mechanisms of the photodegradation under separate UV, visible, and NIR illuminations are unveiled and discussed in detail. Under simulated solar light illumination, the involved reactive species were identified by performing trapping experiments.
Secondly, a heterojunction made of 0-dimensional (0D) NIR-responsive PbS@CdS@ZnS core@shell@shell quantum dots (PCZ QDs) and 2-dimensional (2D) g-C3N4 nanosheets, named 0D/2D heterojunction, was rationally constructed. In addition to some typical advantages of 0D/2D composites, such as short required-charge-diffusion-distance and high charge mobility, our designed PCZ QDs/g-C3N4 photocatalysts offer additional beneficial features. The broadband
optical absorption of high-quality PCZ QDs highly dispersed on the surface of the g-C3N4 nanosheets and their strong interaction yield efficient charge transfer between them and endow PCZ QDs/g-C3N4 with high photocatalytic activity from UV to NIR regions. Actually, with the optimization of PCZ QDs loading levels, the achieved, normalized rate constant is higher than the best-reported value for NIR-driven photocatalysis. The charge transfer was investigated and supported by steady-state and time-resolved photoluminescence spectroscopy and solid-state electron spinning spectroscopy (ESR) as well as photoelectrochemical measurements. Superoxide radicals were identified as the most important active species in photocatalysis by scavenger experiments and ESR spectra. PCZ QDs/g-C3N4 possesses good recycling performance and no metal release was detected in the solution after photocatalysis.
Thirdly, a 2D/2D heterojunction of black phosphorus (BP)/g‐C3N4 was designed and synthesized for photocatalytic H2 evolution. The ice‐assisted exfoliation method developed herein for preparing BP nanosheets from bulk BP, leads to high yield of few‐layer BP nanosheets (≈6 layers on average) with large lateral size at reduced duration and power for liquid exfoliation. The combination of BP with g‐C3N4 protects BP from oxidation and contributes to enhanced activity both under λ > 420 nm and λ > 475 nm light irradiation and to long‐term stability. The H2 production rate of BP/g‐C3N4 (384.17 µmol g−1 h−1) is comparable to, and even surpasses that of the previously reported, precious metal‐loaded photocatalyst under λ > 420 nm light. The efficient charge transfer between BP and g‐C3N4 (likely due to formed N-P bonds) and broadened photon absorption (supported both experimentally and theoretically) contributed to the excellent photocatalytic performance. The possible mechanisms of H2 evolution under various forms of light irradiation is unveiled.
Keywords: broadband photocatalyst, carbon nitride, plasmonic, upconversion, near-infrared quantum dots, metal-free, black phosphorus, photocatalytic degradation, hydrogen evolution
RÉSUMÉ
En tant que photocatalyseur à semi-conducteur, le nitrure de carbone graphitique (g-C3N4) présente un grand intérêt pour le domaine des matériaux, pour ses mérites tels que la non-toxicité, la facilité de préparation, la bande interdite modérée, la forte capacité rédox, l’abondance sur terre et la bonne stabilité physico-chimique. Cependant, le g-C3N4 souffre toujours d'une activité photocatalytique médiocre et d'un rendement quantique faible en raison du taux de recombinaison élevé des porteurs de charge photogénérés. En plus, la bande interdite optique (2,7 eV) du g-C3N4 limite grandement la plage d’absorption de la lumière visible aux longueurs d’onde inférieures à 460 nm. Ainsi, le développement de photocatalyseurs basés sur du g-C3N4 répondant efficacement dans une large bande d’absorption couvrant l’ultraviolet (UV), le visible, et l’infrarouge (NIR), demeure une tâche de grande importance et de grande urgence, bien que difficile. Dans cette thèse, trois types de photocatalyseurs à large bande basés sur le g-C3N4 ont été développés et utilisés pour la dégradation photocatalytique de polluants organiques et la production de carburant écologique.
Tout d'abord, nous avons synthétisé un photocatalyseur à large bande amélioré par plasmon et conversion ascendante (upconversion, UP), basé sur des nano-feuilles de g-C3N4 chargées de nanoparticules (NP) d’or et de microsphères de NaYF4:Yb3+, Er3+, Tm3+ (NYF) (Au-NYF/g-C3N4). La synthèse en une simple étape de NYF en présence de g-C3N4, qui n'a pas été rapportée dans la littérature, conduit à la fois à un rendement élevé en NYF et à une efficacité de couplage élevée entre NYF et g-C3N4. La structure Au-NYF/g-C3N4 présente une stabilité élevée, une large bande de photoréponse allant de l’UV aux régions visibles et NIR, ainsi qu'une activité photocatalytique nettement accrue au g-C3N4 lors de la dégradation du méthyl orange. Les hautes performances du nano-composite Au-NYF/g-C3N4 sous différentes irradiations lumineuses sont attribuées au fait que la séparation des charges est nettement favorisée et à la suppression de la recombinaison ainsi qu'au transfert efficace des porteurs de charge et de l'énergie entre ces composants. Le fait que la séparation et le transfert de charge soient favorisés a ensuite été confirmé par des mesures photoélectrochimiques. Différents mécanismes de photo-dégradation réalisée séparément sous des éclairages UV, visible et NIR sont mis en évidence et discutés en détail. En simulant une illumination solaire, les espèces réactives impliquées ont été identifiées en effectuant des expériences de piégeage.
Deuxièmement, une hétérojonction, constituée de points quantiques PbS@CdS@ZnS core@shell@shell (PCZ QDs) et de g-C3N4 à deux dimensions (2D), et dénommée hétérojonction
0D/2D, a été synthétisée. En plus des avantages typiques des composites 0D/2D, tels qu’une courte distance de diffusion par charge et une mobilité élevée des charges, nos photocatalyseurs PCZ QDs/g-C3N4 offrent des fonctionnalités supplémentaires. L'absorption optique à large bande de PCZ QD de haute qualité dispersés sur toute la surface des nano-feuilles de g-C3N4 et leur forte interaction permettent un transfert de charge efficace entre eux. Ceci confère aux hétérojonctions PCZ QDs/g-C3N4 une activité photocatalytique élevée de l’UV à la région NIR. En fait, avec l’optimisation des niveaux de charge des PCZ QD, l’efficacité photocatalytique normalisée est supérieure à la meilleure valeur rapportée dans la littérature pour la photocatalyse dans le NIR. Le transfert de charge a été étudié et analysé grâce à la spectroscopie à photoluminescence en régime continu et résolu dans le temps, par spectroscopie à spin électronique (ESR) ainsi que par des mesures photoélectrochimiques. Les radicaux superoxydes ont été identifiés comme l’espèce active la plus importante dans la photocatalyse par des expériences «scavenger» et des spectres d’ESR. Les PCZ QDs/g-C3N4 possèdent de bonnes performances de recyclage et aucun relâchement de métal n’a été détecté dans la solution après photocatalyse.
Troisièmement, une hétérojonction 2D/2D de phosphore noir (BP)/g-C3N4 a été conçue et synthétisée pour le dégagement photocatalytique de H2. La méthode d’exfoliation assistée par de la glace développée ici pour la préparation de nano-feuilles de BP à partir de BP massif conduit à un rendement élevé en nano-feuilles de BP à plusieurs couches (6 couches en moyenne) avec une grande taille latérale et une exfoliation liquide de courte durée et de faible puissance. La combinaison de BP avec le g-C3N4 protège le BP de l’oxydation et contribue à une activité accrue sous irradiation lumineuse > 420 nm et > 475 nm et à une grande stabilité à long terme. Le taux de production de H2 à partir de BP/g-C3N4 (384,17 µmol g-1 h-1) est comparable voire supérieur à ce qui a été rapporté dans la littérature, à savoir celui d’un photocatalyseur chargé de métaux précieux sous irraditation > 420 nm. Le transfert de charge efficace entre BP et g-C3N4 (probablement dû à la formation de liens N-P) et la large bande d’absorption (démontrés à la fois expérimentalement et théoriquement) contribuent à l’excellente performance photocatalytique. Les mécanismes possibles d'évolution de H2 sous différentes types d'irradiation lumineuse sont mis en évidence.
TABLE OF CONTENTS
ACKNOWLEDGEMENTS ...III ABSTRACT ... V RÉSUMÉ ... VII TABLE OF CONTENTS ... IX LIST OF FIGURES ... XIII LIST OF TABLES ... XIX LIST OF ABBREVIATIONS AND ACRONYMS ... XXI LIST OF PUBLICATIONS, CONFERENCE PRESENTATIONS, AND AWARDS ... XXIII
1 INTRODUCTION ... 1
1.1 General Background ... 1
1.2 Fundamentals of Photocatalysis ... 2
1.3 Requirements and Current Challenges for Photocatalysis ... 5
1.3.1 Photo-response range ... 5
1.3.2 Redox capability ... 5
1.3.3 Charge separation and transportation ... 6
1.3.4 Adsorptivity and stability ... 6
1.4 Graphitic Carbon Nitride Photocatalyst ... 7
1.4.1 Microstructure ... 7
1.4.2 Electronic structure ... 8
1.4.3 Synthesis methods ... 8
1.4.4 Inherent drawbacks ... 9
1.5 Strategies to Construct Broadband g-C3N4 Based Photocatalysts ... 10
1.5.1 Employing upconversion materials ... 11
1.5.2 Introducing surface plasmon resonance effect ... 14
1.6 Thesis Objectives and Organizations ... 27 1.6.1 Thesis objectives ... 27 1.6.2 Thesis organizations ... 28 2 EXPERIMENTAL ...31 2.1 Materials ... 31 2.2 Synthesis of g-C3N4 Nanosheets ... 31 2.3 Synthesis of Au-NYF/g-C3N4 ... 31 2.3.1 Preparation of Au NP colloids ... 31
2.3.2 In-situ synthesis of NYF/g-C3N4 composites ... 32
2.3.3 Preparation of Au NP loaded NYF/g-C3N4 photocatalysts ... 32
2.4 Synthesis of PCZ QDs/g-C3N4 Nanosheets ... 32 2.4.1 Synthesis of PbS QDs... 32 2.4.2 Synthesis of PbS@CdS core@shell QDs ... 33 2.4.3 Synthesis of PCZ core@shell@shell QDs ... 33 2.4.4 Preparation of PCZ QDs/g-C3N4 nanosheets ... 34 2.5 Synthesis of BP/g-C3N4 Nanosheets ... 34
2.5.1 NMP-ice-assisted preparation of BP nanosheets. ... 34
2.5.2 Preparation of BP/g-C3N4 photocatalysts. ... 34
2.6 Characterizations ... 35
2.7 Photoelectrochemical Measurements ... 36
2.8 Photocatalytic Activity Evaluation and Trapping Experiments ... 37
2.8.1 Photocatalytic degradation of MO by Au-NYF/g-C3N4 ... 37
2.8.2 Photocatalytic degradation of MO by PCZ QDs/g-C3N4 ... 37
2.8.3 Trapping experiments ... 38
2.8.4 Photocatalytic H2 evolution by BP/g-C3N4 ... 38
2.9 Theoretical Calculations ... 38
3.2 Experimental Section ... 45
3.2.1 Materials ... 45
3.2.2 Preparation of Au NP colloids ... 45
3.2.3 Preparation of g-C3N4... 46
3.2.4 In-situ synthesis of NYF/g-C3N4 composites ... 46
3.2.5 Preparation of Au NP loaded NYF/g-C3N4 photocatalysts ... 46
3.2.6 Photocatalytic experiment and the detection of active species ... 46
3.2.7 Characterization ... 47
3.3 Results and Discussions ... 48
3.3.1 Structural and morphological characterization ... 48
3.3.2 Optical properties ... 50
3.3.3 Photocatalytic activities ... 52
3.3.4 Detection of active species and relevant mechanisms ... 55
3.4 Conclusions ... 59
Acknowledgements ... 60
3.5 Supporting Information ... 60
4 NIR-RESPONSIVE QUANTUM DOTS/CARBON NITRIDE ...63
4.1 Introduction ... 65 4.2 Experimental Details ... 67 4.2.1 Materials ... 67 4.2.2 Synthesis of PbS QDs... 67 4.2.3 Synthesis of PbS@CdS core@shell QDs ... 68 4.2.4 Synthesis of PCZ core@shell@shell QDs ... 68 4.2.5 Preparation of PCZ QDs/g-C3N4 nanosheets ... 69 4.2.6 Characterization ... 69
4.2.7 Photocatalytic activity measurements and trapping experiments ... 70
4.3 Results and Discussion ... 71
4.3.2 Photocatalytic activity and stability ... 75
4.3.3 Charge transfer dynamics and PEC measurements ... 78
4.3.4 Detection of active species ... 79
4.3.5 Proposed possible mechanism ... 80
4.4 Conclusions ... 82
Acknowledgements ... 82
4.5 Supporting Information ... 83
5 METAL‐FREE BLACK PHOSPHORUS/CARBON NITRIDE ...93
5.1 Introduction ... 95
5.2 Results and Discussions ... 97
5.2.1 Preparation of BP nanosheets and BP/g-C3N4 photocatalysts ... 97
5.2.2 Morphological and structural characterization ... 98
5.2.3 Optical properties ... 102
5.2.4 Photocatalytic H2 evolution ... 103
5.2.5 PEC measurements and charge transfer dynamics ... 105
5.2.6 UPS measurement ... 106
5.2.7 Mechanism of photocatalytic H2 evolution under different light irradiations ... 107
5.3 Conclusions ... 108
Acknowledgements ... 108
5.4 Supporting Information ... 109
5.4.1 Experimental section ... 109
5.4.2 Theoretical calculations ... 112
6 CONCLUSIONS AND PERSPECTIVES ... 121
6.1 Conclusions ... 121
6.2 Perspectives ... 122
LIST OF FIGURES
Figure 1.1 Schematic illustration of the principle of semiconductor photocatalysis. (I) the formation of charge carriers by a photon; (II) the charge carrier recombination to liberate heat; (III) the initiation of a reductive pathway by a CB electron; (IV) the initiation of an oxidative pathway by a CB hole; (V) the further thermal (e.g., hydrolysis or reaction with active oxygen species) and photocatalytic reactions to yield mineralization products; (VI) the trapping of a conduction band electron in a dangling surficial bond; (VII) the trapping of a VB hole at the surface of the semiconductor. Reprinted with permission.39 Copyright 2014, The Royal Society of Chemistry... 3 Figure 1.2 (a-b) Electronic structure of semiconductor photocatalysts and Gibbs energy change in photocatalytic reactions. (c-d) Two distinct classifications of photocatalytic reactions, namely downhill (c) and uphill (d) reactions. Reprinted with permission.29 Copyright 2018, WILEY-VCH. ... 4 Figure 1.3 Spectral distribution of the solar photon irradiation based on the AM1.5 global data. Reprinted with permission.40 Copyright 2012, The Royal Society of Chemistry. .. 5 Figure 1.4 The hypothetical ideal structure of g-C3N4 based on (a) s-triazine and (b)
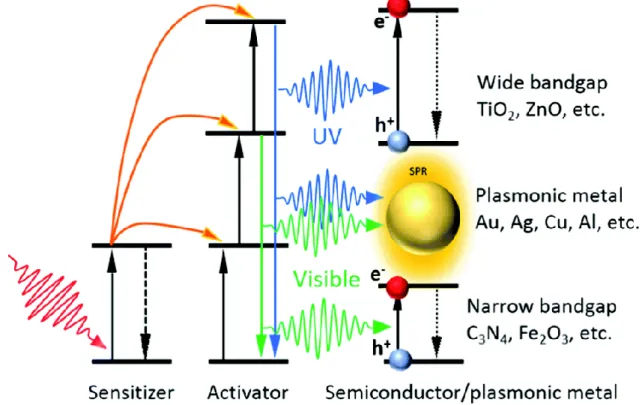
tri-s-triazine (heptazine) tectonic units. Reprinted with permission.92 Copyright 2012, American Chemical Society. ... 8 Figure 1.5 Schematic illustration of the synthesis process of g-C3N4 by thermal polymerization of different precursors such as melamine,103,104 cyanamide,101,105 dicyandiamide,106,107 urea,108,109 thiourea.110,111 The black, blue, white, red, and yellow balls denote C, N, H, O, and S atoms, respectively. Reprinted with permission.93 Copyright 2016, American Chemical Society. ... 9 Figure 1.6 Lanthanide-doped UC particles and photon UC. (a) Schematic energy level diagram showing that UC luminescence primarily originates from electron transitions between energy levels of localized dopant ions. (b) Schematic illustration of UC particles composed of a crystalline host and lanthanide dopant ions embedded in the host lattice. Reprinted with permission.153 Copyright 2010, The Royal Society of Chemistry. (c) Typical lanthanide-based UC emission bands covering a broad range of wavelengths from UV (~290 nm) to NIR (~880 nm) and their corresponding main optical transitions. Reprinted with permission.149
Copyright 2015, Springer Nature. (d) Typical emission spectra showing multiple narrow and well-separated emissions produced by cubic NaYF4:Yb/Tm (20/0.2 mol%) and NaYF4:Yb/Er (18/2 mol%) particles. (e) UC multicolor fine-tuning through the use of lanthanide-doped NaYF4 particles with varied dopant ratios. Note that the emission spectra and colors are associated with the host composition, particle size, and particle surface properties. Reprinted with permission.154 Copyright 2008, American Chemical Society. ...12 Figure 1.7 Illustration of the UC enhanced photocatalysis. Reprinted with permission.152
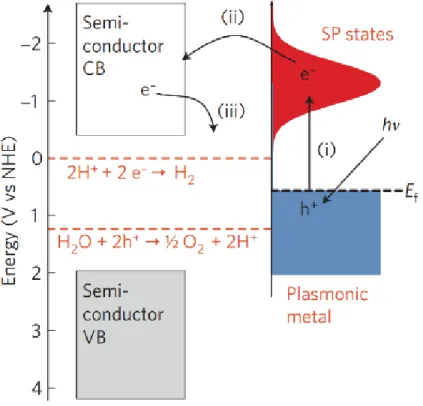
Copyright 2019, Royal Society of Chemistry. ...13 Figure 1.8 Schematic illustration of plasmon oscillation on a plasmonic metal sphere. An oscillation of conduction electron charge cloud relative to the nuclei is established by the external oscillating electric field. Reproduced with permission.200 Copyright 2003, American Chemical Society. ...14 Figure 1.9 (a) Normalized extinction spectra of spherical Ag (38 ±12 nm diameter), Au (25 ± 5 nm) and Cu (133 ± 23 nm) particles. The intensity of solar radiation (data for air mass 1.5 solar spectrum from the National Renewable Energy Laboratory) is also shown, in black. The metal extinction is a consequence of the excitation of SPR. Dashed portions of the metal extinction curves indicate interband transitions. (b) Normalized extinction spectra for Ag wire (90 ± 12 nm diameter and > 30 aspect ratio), cube (79 ± 12 nm edge length) and sphere (38 ± 12 nm diameter) NPs. (c) Normalized extinction spectra for Ag nanocubes as a function of size (56 ± 8 nm, 79 ± 13 nm and 129 ± 7 nm edge lengths correspond to orange, red and blue spectra, respectively). The inset shows a photograph of the three nanocube samples suspended in ethanol. Reproduced with permission.199 Copyright 2011, Springer Nature. ...15 Figure 1.10 Mechanism of SPR-induced charge transfer with approximate energy levels on the NHE scale. Dashed red lines refer to the water-splitting redox potentials. (i) Electrons near the metal Fermi level, Ef are excited to surface plasmon (SP) states; (ii) the electrons transfer to a nearby semiconductor particle; (iii) this activates electron-driven processes such as the H2-evolution. Reproduced with permission.199 Copyright 2011, Springer Nature. ...16 Figure 1.11 Optical simulations showing SPR-enhanced electric fields owing to photo-excited
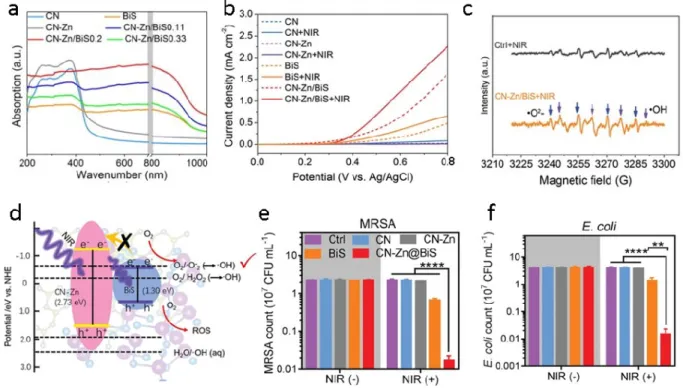
electric field intensity (and therefore charge-carrier generation) is the highest at the metal/semiconductor/liquid three-phase boundary. Reproduced with permission.223 Copyright 2011, American Chemical Society. ...17 Figure 1.12 (a) Illustration of the phenomenon where electron-hole pairs generated deep under the surface of the semiconductor recombine easily. (b) Illustration of the situation when plasmonic metals are loaded at the surface of the semiconductor. The light-absorption layer becomes thinner where electron-hole pairs are generated at a high rate as a result of near-field electromagnetic resonant energy transfer. The generated electron-hole pairs take part in the reactions easily owning to their shorter migration length. Reproduced with permission.43 Copyright 2015, WILEY-VCH. ...18 Figure 1.13 (a) Schematic illustration of the energy flux (Poynting vectors) and the electric-field intensity for an incident electromagnetic wave with an electric field in the plane of the image. Red/blue represent high/low electric-field intensity. The scattering effect is neglected. Reproduced with permission.201 Copyright 2011, Royal Society of Chemistry. (b) Schematic illustrating the scattering mechanism. The addition of optically excited plasmonic nanoparticles increases the average path length of photons in the composite structure. Reproduced with permission.199 Copyright 2011, Springer Nature. ...19 Figure 1.14 (a) Schematic representation of the quantum confinement effect on the energy level structure of a semiconductor material. The lower panel shows colloidal suspensions of CdSe nanocrystals of different sizes under UV excitation. Courtesy of R. Koole (Philips Research Laboratories, Netherlands). Reproduced with permission.303 Copyright 2011, Royal Society of Chemistry. (b) Absorbance spectra of PbS QDs with diameter being tuned from 3 to 10 nm, leading to excitonic maxima ranging from 900 to 2100 nm. Reproduced with permission.306 Copyright 2011, American Chemical Society. ...24 Figure 1.15 (a) UV-visible-NIR absorption spectra of CN, CN-Zn, BiS, and CN-Zn/BiS. (b) Linear volt‐ampere curve of CN, CN-Zn, BiS, and CN–Zn/BiS with and without 808 nm NIR irradiation. (c) ROS detection of CN-Zn/BiS through ESR with DMPO probe. Blue arrows indicated •O2- and purple arrows indicated •OH. (d) The mechanism of ROS enhancement based on the DFT calculation compared with individual CN-Zn and BiS. Red arrows mean generated ROS species. (e) MRSA and (f) E. coli strain counts calculated from spread‐plate assays after treatment
with CN, CN-Zn, BiS, or CN-Zn/BiS (200 µg mL−1) under 808 nm light irradiation. Reproduced with permission.245 Copyright 2019, WILEY-VCH. ...26 Figure 3.1 TEM images of (a) Au NPs, (b) g-C3N4 nanosheets, (c) 1 wt% Au-NYF/g-C3N4
photocatalysts, (d) the enlarged view and (e) the EDX spectrum of the rectangle area in (c). The inset in (a) is the high magnification TEM image of Au NPs. (f) XRD patterns of g-C3N4, NYF, NYF/g-C3N4 and1 wt% Au-NYF/g-C3N4 samples. The corresponding standard data for the β-NaYF4 phase (JCPDS 28-1192) is also given at the bottom. ...49 Figure 3.2 (a) UV-vis-NIR absorption spectra and (b) upconversion photoluminescence spectra of the obtained samples. The inset in (a) is the absorption spectrum of Au NPs in water. ...51 Figure 3.3 Time-dependent UV-vis absorption spectra for the photocatalytic degradation of MO over 1 wt% Au-NYF/g-C3N4 (a) and the plot of (c/c0) vs reaction time (b) under UV light irradiation. The plot of ln(c0/c) vs reaction time (c, d, e, f) for the photocatalytic degradation of MO over x wt% Au-NYF/g-C3N4 (x=0, 1, 2, 3, 4 and 5) photocatalysts, under UV light (c), λ > 420 nm (d), λ > 475 nm (e), and the NIR light (f) irradiation. The insets in (c, d, e, f) are the apparent rate constants (k value)
vs Au loading. ...54
Figure 3.4 (a) Photocatalytic degradation of MO and (b) the kinetics study over different photocatalysts under simulated solar light illumination. The inset in (b) shows the rate constants vs Au loading. (c) Photocatalytic stability of 1 wt% Au-NYF/g-C3N4 photocatalyst in five successive cycling reactions. The duration of simulated solar light exposure in each cycle is 7 h. (d) Photocatalytic degradation of MO in the presence of three types of scavengers and 1 wt% Au-NYF/g-C3N4 photocatalyst under simulated solar light irradiation. ...56 Figure 3.5 (a) EIS Nyquist plots of NYF/g-C3N4 and 1 wt% Au-NYF/g-C3N4 in the dark and under illumination; (b) transient photocurrent density response of NYF/g-C3N4 and 1 wt% Au-NYF/g-C3N4 during on/off cycles under a 0.2 V bias versus Ag/AgCl. .57 Figure 3.6 Proposed photocatalytic mechanism of Au-NYF/g-C3N4 photocatalyst under (a) UV and (b) visible light (λ > 475 nm) irradiation, respectively. (c) Schematic energy level diagrams, upconversion excitation and UV- visible light emissions for the NYF microspheres under the NIR light (980 nm laser) illumination. ...58
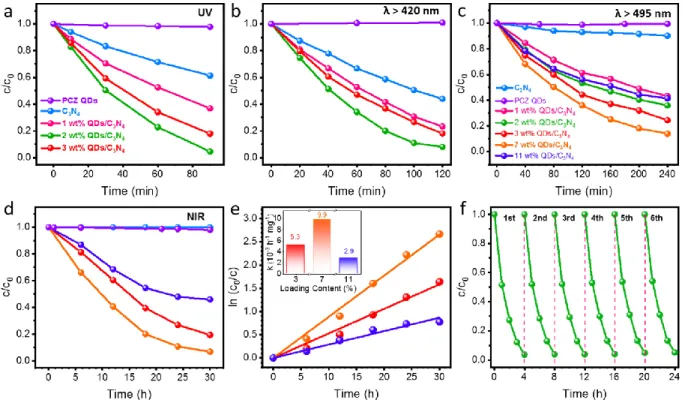
Figure 4.1 TEM images of (a) g-C3N4 nanosheets, (b-c) PCZ QDs, (d-f) 2 wt% QDs/g-C3N4 photocatalysts with different magnifications. Insets in (c) and (f) are the HRTEM images of PCZ QDs and PCZ QDs/g-C3N4, respectively. Scale bars in (a-b) and (d-f) are 50 nm. (g) EDX spectrum of (f). (h) XRD patterns of g-C3N4, PCZ QDs, and PCZ QDs/g-C3N4 samples. ...73 Figure 4.2 (a) FTIR spectra, (b) survey XPS spectra, high-resolution (c) C 1s and (d) N 1s XPS spectra of g-C3N4 and PCZ QDs/g-C3N4 samples, (e) high-resolution S 2p XPS spectra of PCZ QDs and PCZ QDs/g-C3N4, and (f) absorption spectra of g-C3N4 and PCZ QDs/g-C3N4. Insets in (f) are the photographs of the prepared powder samples and the NIR absorption spectrum of PCZ QDs. ...75 Figure 4.3 Photocatalytic degradation of MO over bare PCZ QDs and 0-11 wt% QDs/g-C3N4
samples under (a) UV, (b) λ > 420 nm, (c) λ > 495 nm, and (d) NIR light irradiation (980 nm). (e) The plot of ln(c0/c) vs reaction time of (d). (f) Photocatalytic stability of 2 wt % QDs/g-C3N4 photocatalyst in six successive cycling reactions under simulated solar light irradiation. ...77 Figure 4.4 (a) PL spectra with the excitation at 375 nm, (b) TRPL decay curves with emission at 460 nm, and (c) solid-state ESR spectra in the dark and after visible light irradiation of g-C3N4 and 2 wt% QDs/g-C3N4. (d) PL spectra with the excitation at 780 nm of PCZ QDs and 7 wt% QDs/g-C3N4. (e) Photocurrent response and (f) EIS Nyquist plots in the dark and under simulated solar light irradiation of g-C3N4 and PCZ QDs/g-C3N4 samples. (g) Photocatalytic degradation of MO over 2 wt% QDs/g-C3N4 in the presence of three different scavengers under simulated solar light irradiation. DMPO spin-trapping ESR spectra of (h) •O2− and (i) •OH radicals for g-C3N4 and PCZ QDs/g-C3N4 in the dark and under visible light (λ > 420 nm) irradiation. ...80 Figure 4.5 Proposed possible mechanism for the photocatalysis over PCZ QDs/g-C3N4
samples under a) UV or λ > 420 nm and b) λ > 495 nm or NIR light irradiation. Band energies (in eV referenced to the vacuum level) are taken from literatures. ...81 Figure 5.1 (a) Schematic illustration of the preparation of BP nanosheets with
NMP-ice-assisted exfoliation method. (b) TEM image of BP nanosheets and (c) EDX spectrum of (b). (d) Tapping mode AFM topographical image of few-layer BP nanosheets. Scale bars in b) and d) are 500 nm. (e) The height profiles of BP nanosheets along the blue Line 1 and green Line 2 in (d). (f) Distribution of BP
layers calculated from the height profiles of 150 BP nanosheets in AFM images. ...98 Figure 5.2 Typical TEM images of (a) g-C3N4 and (b-d) BP/g-C3N4 with different magnifications. (e) HAADF STEM image of (d), (f-i) STEM-EDX mapping of C, N, P, and the overlay of all the elements of the selected area in (e). (j) HRTEM image of BP/g-C3N4, and (k) EDX spectrum of (j). Scale bars: (a) and (c-i), 250 nm; (b), 1 μm; (j), 5 nm. The TEM grids used in (a), (j) and (k) are carbon film coated copper grids, and those used in the other figures are lacey carbon film coated nickel grids. ... 100 Figure 5.3 High-resolution (a) C1s and (b) N1s XPS spectra of g-C3N4 and BP/g-C3N4, and (c) P2p XPS spectra of BP and BP/g-C3N4 samples. (d) XRD patterns of bulk BP, BP nanosheets, g-C3N4 and BP/g-C3N4 samples. The inset is the amplification of XRD patterns of bulk BP and BP nanosheets in the lower-angle range, which is marked by the dashed rectangle in (d). (e) UV-vis-NIR absorption spectra of g-C3N4 and BP/g-C3N4 powder samples. Insets in (e) are the absorption spectrum of BP nanosheets in dispersion (top), photos of BP/g-C3N4 (middle) and g-C3N4 (bottom) powders. (f) Theoretical Tauc-plot curves of BP with different layer numbers (1-4 and 6 layers). (g, i) Photocatalytic H2 evolution and (h) H2 evolution rate achieved in the presence of BP (orange), g-C3N4 (blue), 3 wt% BP/g-C3N4 (red), 10 wt% BP/g-C3N4 (green) and 15 wt% BP/g-C3N4 (purple) photocatalysts under (g-h) λ > 420 nm and (i) λ > 475 nm light irradiations. ... 101 Figure 5.4 (a) EIS Nyquist plots of g-C3N4 and BP/g-C3N4 with and without illumination. (b) Transient photocurrent density response of g-C3N4 and BP/g-C3N4 during light on/off cycles under a 0.2 V bias versus Ag/AgCl electrode. (c) Steady-state PL spectra with the excitation at 380 nm, and (d) TRPL decay curves measured at 457 nm of g-C3N4 and BP/g-C3N4 samples. Valence band UPS cut-off spectra of (e) BP and (f) g-C3N4 samples. ... 106 Figure 5.5 Schematic energy diagram of BP/g-C3N4 photocatalyst and proposed possible mechanism for the photocatalytic H2 evolution under (a) λ > 420 nm and (b) λ > 475 nm light irradiation. ... 108
LIST OF TABLES
Table 1.1 Representative narrow-bandgap materials and their bandgap values. ...21 Table 1.2 Some examples of the broadband photocatalysts based on narrow-bandgap semiconductor/g-C3N4 heterostructure for NIR photocatalytic applications. ...25 Table S4.1 Reaction rates for photocatalytic degradation of organics under NIR light irradiation in recent published literatures. ...90 Table S4.2 ICP-OES detection of metals released into the reaction solution after 24 h of photocatalysis under simulated solar light irradiation in the presence of PCZ QDs/g-C3N4. ...90 Table S4.3 ICP-OES detection of metals released into the reaction solution for PbS@CdS QDs under simulated solar light irradiation. ...91 Table S4.4 PL Lifetime of g-C3N4 and PCZ QDs/g-C3N4 samples obtained from TRPL measurements with excitation and emission at 408 nm and 460 nm, respectively. ...91 Table S5.1 Comparison of the yield of few-layer BP nanosheets from different exfoliation methods. ... 114 Table S5.2 Atomic composition of g-C3N4 and BP/g-C3N4 photocatalysts. ... 114 Table S5.3 Photocatalytic H2 production rate under visible light (λ > 420 nm) irradiation. ... 116 Table S5.4 The atomic percentage of P1, P2, and P3 in BP and BP/g-C3N4 photocatalysts estimated from Figure S5.3. ... 117
LIST OF ABBREVIATIONS AND ACRONYMS
0D Zero-dimensional
1D One-dimensional
2D Two-dimensional
3D Three-dimensional
AFM Atomic force microscopy
BP Black phosphorus
BQ Benzoquinone
CB Conduction band
CdO Cadmium oxide
DMF N,N-dimethylformamide
DMPO 5,5-dimethyl-1-pyrroline N-oxide EDX Energy dispersive X-ray spectroscopy
ESR Electron spin resonance
FTIR Fourier transform infrared spectroscopy
GC Gas chromatography
g-C3N4 Graphitic carbon nitride
HCl Hydrochloric acid
HNO3 Nitric acid
ICP-OES Inductively coupled plasma-optical emission spectrometry
IPA Isopropanol
MB Methylene blue
MO Methyl orange
MPA Mercaptopropionic acid
Na2EDTA Disodium ethylenediaminetetraacetate
NaF Sodium fluoride
NaOH Sodium hydroxyl
NHE Normal hydrogen electrode
NIR Near-infrared NMP N-methyl-2-pyrrolidinone NPs Nanoparticles OA Oleic acid ODE Octadecene OLA Oleylamine PbCl2 Lead chloride PEC Photoelectrochemical PL Photoluminescence QDs Quantum dots
ROS Reactive oxygen species
RhB Rhodamine B
SPR Surface plasmon resonance
SEM Scanning electron microscope
t-BuOH tert-butyl alcohol
TEM Transmission electron microscopy
UC Upconversion
UPS Ultraviolet photoelectron spectroscopy
UV Ultraviolet
VB Valance band
LIST OF PUBLICATIONS, CONFERENCE PRESENTATIONS, AND
AWARDS
Book Chapter
1. Zhang Q, Liu Y, Xu Z, Zhao Y, Chaker M, Ma D (2018) Visible-Light-Driven Photocatalysts.
Nanomaterials for Energy Conversion and Storage, Wang D & Cao G (Eds.) World Scientific,
New Jersey. p. 109-173.
Patent
2. Zhang Q, Ma D, Chaker M (2019) Facile Method for Large-scale Producing Few-layer Black
Phosphorous Nanosheets. International Patent, PCT/CA2019/050813.
Peer-Reviewed Articles
3. Deng J 1, Zhang Q 1, Lv X, Zhang D, Xu H, Ma D, Zhong J (2020) Understanding Hematite
Photoelectrochemical Water Splitting with X-ray Absorption Spectroscopy. ACS Energy Lett. 5: 975-993. (Co-first author)
4. Wang G 1, Zhang Q 1, Chen Q, Ma X, Xin Y, Zhu X, Dong M, Cui C, Zhang J, Xiao Z (2019)
Photocatalytic degradation performance and mechanism of dibutyl phthalate by graphene/TiO2 nanotube array photoelectrodes. Chem. Eng. J. 358:1083-1090. (Co-first author)
5. Gao Y, Lin J, Zhang Q *, Yu H, Ding F, Xu B, Sun Y, Xu Z (2018) Facile Synthesis of Heterostructured YVO4/g-C3N4/Ag Photocatalysts with Enhanced Visible-Light Photocatalytic Performance. Appl. Catal., B 224:586-593. (Corresponding author)
6. Zhang Q, Yang F, Zhou S, Bao N, Xu Z, Chaker M, Ma D (2020) Broadband Photocatalysts Enabled by 0D/2D Heterojunctions of Near-Infrared Quantum Dots/Graphitic Carbon Nitride Nanosheets. Appl. Catal., B. 270:118879.
7. Zhang Q, Deng J, Xu Z, Chaker M, Ma D (2017) High-Efficiency Broadband C3N4 Photocatalysts: Synergistic Effects from Upconversion and Plasmons. ACS Catal. 7(9):6225-6234.
8. Zhang Q, Jin X, Xu Z, Zhang J, Rendon UF, Razzari L, Chaker M, Ma D (2018) Plasmonic Au Loaded Hierarchical Hollow Porous TiO2 Spheres: Synergistic Catalysts for Nitroaromatic Reduction. J. Phys. Chem. Lett. 9(18):5317-5326.
9. Zhang Q, Huang S, Deng J, Gangadharan DT, Yang F, Xu Z, Giorgi G, Palummo M, Chaker M, Ma D (2019) Ice‐Assisted Synthesis of Black Phosphorus Nanosheets as a Metal‐Free Photocatalyst: 2D/2D Heterostructure for Broadband H2 Evolution. Adv. Funct. Mater. 29(28):1902486.
10. Zhang Q, Yang F, Xu Z, Chaker M, Ma D (2019) Are lanthanide-doped upconversion materials good candidates for photocatalysis? Nanoscale Horiz. 4(3):579-591.
11. Zhang Q, Thrithamarassery Gangadharan D, Liu Y, Xu Z, Chaker M, Ma D (2017) Recent Advancements in Plasmon-Enhanced Visible Light-Driven Water Splitting. J. Materiomics 3(1):33-50.
12. Zhang Q, Liu Y, Xu Z, Zhao Y, Chaker M, Ma D (2019) Optimized design and mechanistic understanding of plasmon and upconversion enhanced broadband photocatalysts. Catal.
Today DOI: 10.1016/j.cattod.2019.05.017.
13. Zhang Q, Bao N, Wang X, Hu X, Miao X, Chaker M, Ma D (2016) Advanced Fabrication of Chemically Bonded Graphene/TiO2 Continuous Fibers with Enhanced Broadband Photocatalytic Properties and Involved Mechanisms Exploration. Sci. Rep. 6:38066.
14. Huang S, Zhang Q, Li P, Ren F, Yurtsever A, Ma D (2018) High-Performance Suspended Particle Devices Based on Copper-Reduced Graphene Oxide Core-Shell Nanowire Electrodes. Adv. Energy Mater. 8(18):1703658.
15. Deng J, Zhang Q, Feng K, Lan H, Zhong J, Chaker M, Ma D (2018) Efficient Photoelectrochemical Water Oxidation on Hematite with Dual Cocatalysts of Fluorine-doped FeOOH and FeNiOOH. ChemSusChem 11:3783-3789.
16. Huang S, Zhang Q, Yang F, Gangadharan DT, Li P, Ren F, Sun B, Ma D (2020) An Effective Way for Scalable Fabrication of High Performance Silver Nanowire Network Transparent Conductive Electrodes for Flexible Smart Windows. J. Mater. Chem. A. Revision.
17. Tan L, Li P, Zhang Q, Izquierdo R, Chaker M, Ma D (2018) Toward Enhancing Solar Cell Performance: An Effective and "Green" Additive. ACS Appl. Mater. Interfaces 10(7):6498-6504.
18. Gangadharan DT, Li P, Zhang Q, Yang F, Izquierdo R, Sun B, Giorgi G, Palummo M, Ma D (2019) Reducing trap-assisted recombination in Pb-less perovskite solar cells by combined compositional and 2D/3D engineering. ACS Appl. Energy Mater. Revision.
19. Xu Z, Kibria MG, AlOtaibi B, Duchesne PN, Besteiro LV, Gao Y, Zhang Q, Mi Z, Zhang P, Govorov AO, Mai L, Chaker M, Ma D (2018) Towards Enhancing Photocatalytic Hydrogen Generation: Which is More Important, Alloy Synergistic Effect or Plasmonic Effect? Appl.
Catal., B 221:77-85.
Conference Presentations
1. Zhang Q, Chaker M, Ma D (2019) Broadband solar harvesting via plasmonic nanostructures for catalysis. International Conference on Energy, Materials and Photonics 2019, EMP19, Shanghai, China, 14-16 July, invited oral presentation.
2. Zhang Q, Chaker M, Ma D (2019) Constructing broadband photocatalysts for environmental and energy applications. 102nd Canadian Chemistry Conference and Exhibition, CCCE2019, Quebec City, Canada, 3-7 June, oral presentation.
3. Zhang Q, Chaker M, Ma D (2018) Broadband solar harvesting via plasmonic photocatalysts for environmental applications. 256th ACS National Meeting & Exposition, Boston, USA, 19-23 August, oral presentation.
4. Zhang Q, Chaker M, Ma D (2018) Enhanced solar harvesting via plasmonic and upconversion nanostructures for catalysis. Annual Symposium of Inorganic Chemistry of Quebec 2018, SACIQ 2018, 3 August, oral presentation.
5. Zhang Q, Chaker M, Ma D (2018) Enhanced solar harvesting via plasmonic nanostructures for broadband photocatalysis. International Conference on Energy, Materials and photonics 2018, EMP 18, 8-11 July, Montreal, Canada, invited oral presentation.
6. Zhang Q, Chaker M, Ma D (2018) Plasmonic photocatalysts toward broadband solar harvesting for efficient photocatalysis. 2nd Annual Conference of the Quebec Centre for Advanced Materials, QCAM 2018, 3-4 May, Montreal, Canada, oral presentation.
7. Zhang Q, Chaker M, Ma D (2017) Upconversion and plasmon-enhanced photocatalysis for broadband solar harvesting. 2017 MRS Fall Meeting, 26 November-1 December, Boston, USA, oral presentation.
8. Zhang Q, Chaker M, Ma D (2017) Plasmon-enhanced Photocatalysis for Broadband Solar Harvesting. 1st Annual Conference of the Quebec Centre for Advanced Materials, QCAM 2017, 23-24 October, Sherbrook, Canada, oral presentation.
9. Zhang Q, Xu Z, Chaker M, Ma D (2017) Broadband solar harvesting for photocatalysis via plasmonic Au nanoparticles. Colloque Plasma-Québec 2017, 17-18 May, Montreal, Canada,
oral presentation.
10. Zhang Q, Xu Z, Chaker M, Ma D (2017) Enhancing photon harvesting via plasmonic nanostructures. 41st International Conference and Expo on Advanced Ceramics and Composites, ICACC 2017, 22-27 Jan, Daytona Beach, USA, oral presentation.
11. Zhang Q, Xu Z, Chaker M, Ma D (2016) Synthesis and applications of Au, Pt and Pt-Au alloy nanoparticles. Colloque Plasma-Québec 2016, 1-2 June, Montreal, Canada, poster
presentation.
Awards and Honors
1. Fonds de recherche du Québec-Nature et technologies (FRQNT) - Doctoral Research Award, 2019-2020 (Rank 2/32 in Quebec province)
2. Scholarship from the China Scholarship Council (CSC) for Pursuing Ph.D. Overseas under State Scholarship Fund, 2015-2019
3. New research star award (Relève étoile Louis-Berlinguet) of FRQNT, January 2020 4. Outstanding Reviewer, Applied Catalysis B: Environmental, Elsevier
5. Outstanding Reviewer, Journal of Environmental Chemical Engineering, Elsevier 6. Best Talk, SACIQ 2018, 3 August 2018, Trois-Rivières, Canada
7. Best Talk, EMP 18, 8-11 July 2018, Montreal, Canada 8. Speaker Travel Stipend, the American Ceramic Society
9. Visit of a Chinese delegation-INRS Excellence Scholarship, 20 November 2017 10. INRS Excellence Scholarship for 2017
1 INTRODUCTION
1.1
General Background
Since the industrial revolution, our thirst for energy provided by fossil fuels, including oil, coal, and natural gas, has been becoming stronger and stronger. During the past hundreds of years, fossil fuels have boosted the progress of human society and economic development, and it is not too much to claim that they are the cornerstone of our modern civilization. It is further predicted that in 2050 the worldwide energy consumption will be 25-27 Terawatts (TW), over 80% of which will still rely on fossil fuels, which are neither renewable nor sustainable, and will undoubtedly be exhausted sooner or later.1-4 Moreover, the combustion of these fossil fuels causes the emission of hazardous substances, which has led to severe air and water contamination. With the rampant unregulated industrial growth and the unceasing world population increase, the energy crisis and environmental pollution caused by the intensive consumption of fossil fuels have been the two main issues facing human beings. To maintain the sustainability of our human society, the seeking of green and renewable energy sources is imperative and urgent.
Of the various renewable and clean energy sources, solar energy that powers all the lives on our planet is considered to be an inexhaustible and secure natural resource. The solar energy striking Earth per hour (4.3 × 10²⁰ J) is more than the annual global energy demand (4.1 × 10²⁰ J in 2001), which dwarfs all other fossil-based and renewable energy resources combined together. 5-8 Solar power has thus emerged as a promising alternative to finite fossil fuels and its efficient utilization is also attracting extensive and heightened attention though challenging.
Semiconductor photocatalysis, which can directly harvest and convert solar energy for green, solar fuel production and environmental remediation at room temperature and standard atmospheric pressure (atm), has been recognized as one of the green sustainable and ideal avenues to address the global energy and environmental concerns.9-11 In 1972, Fujishima and Honda first discovered that the TiO2 electrodes can be used for photocatalytic water splitting to produce H2 under ultraviolet (UV) light irradiation.12 In 1977, Frank and Bard, for the first time, realized the remediation of environmental pollution by photocatalysis via reducing CN− ion in aqueous TiO2 suspensions under light illumination.13 Since these pioneering work, photocatalysis has by far spurred immense and incessant research interests in many different fields, such as photocatalytic degradation of various harmful and toxic organic contaminants, solar water splitting, CO2 reduction, heavy-metal removal, and N2 fixation.14-24
From the economic and environmental point of view, H2 produced from solar-driven water splitting is an ideal substitute for fossil fuels, due to the abundance of solar energy and water, the extraordinarily high specific energy density of H2 (33.3 kWh kg−1), as well as the emissions free of CO2 and other toxic gases.25-27 Photocatalytic oxidation of organic substances constitutes another field of significant importance, as it can fully degrade some hazardous organic contaminants. The increasing amounts of wastewater containing organic pollutants with high toxicity and the encountered difficulties for the traditional treatment technologies, such as energy-consuming, low efficiency, the co-existence of inorganics and organics, have prompted extensive research in photocatalytic oxidation.14,21,28-31 As a fundamental and applied science, photocatalysis will continue to be an integral component of modern chemistry and a promising approach to pursue a sustainable future by utilizing sunlight to drive energy conversion in the 21st century.
1.2
Fundamentals of Photocatalysis
The term “photocatalysis” is made from the combination of photochemistry and catalysis, signifying that light and catalysts are required to trigger or/and to accelerate a redox reaction.32 For semiconductor photocatalysis, the energy band theory has been used to demonstrate the underlying complex physicochemical processes.33 Differing from conductors, the electron-filled valence band (VB), and the vacant conduction band (CB) of semiconductor are clearly separated by a bandgap, which is the energy difference between the lowest unoccupied state in the CB and the highest occupied state in the VB.26,34,35
As displayed in Figure 1.1, multiple processes occur in an illuminated semiconductor. When the semiconductor photocatalyst is irradiated by photons (hv, where h and v represents the Planck constant and photon frequency, and hv refers to one photon energy) with energy equal to or greater than its bandgap energy (Eg), the electrons (e-) in the VB can be promoted to the CB, simultaneously leaving positively charged holes (h+) in the VB (Figure 1.1 I).
There are several pathways that the photogenerated charge carriers can take after photoexcitation. The photo-induced e- and h+ separate and migrate rapidly within photocatalysts to their surface. In the absence of a suitable acceptor, the photo-induced charge carriers tend to recombine in the bulk phase or on the surface on a nanosecond time scale and dissipate the additional energy in the form of light emissions or phonon vibrations (Figure 1.1 II), which is
The photo-generated electrons and holes possess strongly reductive and oxidative capabilities, respectively, and they migrate to the surface to drive redox reactions. Specifically, the excited electrons in the CB have a reduction potential of +0.5 to -1.5 V vs the normal hydrogen electrode (NHE) and the holes in the VB possess an oxidation potential of +1.0 to +3.5 V, which can reduce (Figure 1.1 III) the adsorbed electron acceptors (A) and oxidize (Figure 1.1 IV) or even mineralize (Figure 1.1 V) the electron donors (D) into CO2 and H2O.39 In the photocatalytic degradation system, electrons react with the adsorbed O2 to produce superoxide (•O2-) radicals, while holes react with H2O or OH- to generate hydroxyl (•OH) radicals. The produced •O2- radicals, •OH radicals, and holes are strongly oxidative and active and can effectively degrade the present organic substances. For water splitting, the electrons and holes are used to reduce and oxidize water to produce H2 and O2. In addition, the charge carriers can migrate to the surface of the semiconductor and get trapped in metastable surface states (Figure 1.1 VI and Figure 1.1 VII), such as crystalline defects and dangling surficial bonds. Therefore, the semiconductor with a better crystallinity can lead to lower recombination rate of charge carriers and generally show higher photocatalytic efficiency.40
Figure 1.1 Schematic illustration of the principle of semiconductor photocatalysis. (I) the formation of charge carriers by a photon; (II) the charge carrier recombination to liberate heat; (III) the initiation of a reductive pathway by a CB electron; (IV) the initiation of an oxidative pathway by a CB hole; (V) the further thermal (e.g., hydrolysis or reaction with active oxygen species) and photocatalytic reactions to yield mineralization products; (VI) the trapping of a conduction band electron in a dangling surficial bond; (VII) the trapping of a VB hole at the surface of the semiconductor. Reprinted with permission.39 Copyright 2014, The Royal Society of Chemistry.
For a photocatalytic reaction to occur, the redox potentials of the charge carriers, which are determined by the band position, should meet some requirements. The VB maximum should be more positive than the oxidation potential of the reactant to be oxidized (Pox), while the CB minimum is supposed to be more negative than the reduction potential of the reactant to be reduced (Pred).29 The energy difference between Pred and Pox represents the overall change of Gibbs free energy (∆G) (Figure 1.2a-b).41 In terms of energy, when P
red is lower than Pox, ΔG is negative, otherwise, ΔG is positive. It is thereby concluded that photocatalysis can drive both negative-ΔG and positive-ΔG reactions. For example, photocatalytic degradation of organics in the presence of O2 is generally a downhill reaction with a negative ∆G change (Figure 1.2c), while CO2 reduction and water splitting are thermodynamically uphill reactions, i.e., positive-ΔG reactions (Figure 1.2d).42 It is worth noting that only if both the partial ΔG in oxidation by h+ (ΔG
h) and reduction by e− (ΔG
e) are negative, the redox reactions can be triggered.41 Meeting thermodynamic requirements is a sufficient condition for the occurrence of a photocatalytic reaction.
Figure 1.2 (a-b) Electronic structure of semiconductor photocatalysts and Gibbs energy change in photocatalytic reactions. (c-d) Two distinct classifications of photocatalytic reactions, namely downhill (c) and uphill (d) reactions. Reprinted with permission.29 Copyright 2018, WILEY-VCH.
1.3
Requirements and Current Challenges for Photocatalysis
To render the practical application of the photocatalysis possible, it is crucial to develop an efficient and broadband photocatalyst which can achieve the high solar energy utilization efficiency. Based on the aforementioned photocatalytic processes, there are several requirements to construct a superior photocatalyst.
1.3.1 Photo-response range
A narrow bandgap is desired to enable strong and broadband absorption of solar photons. For photoexcitation, only if the incident photons have higher energy than the bandgap of the photocatalyst they can be absorbed. Therefore, a match between the solar spectrum and bandgap is generally required to maximize the harvesting of solar light. However, the most widely studied semiconductors have wide bandgaps (>3.0 eV) and can only respond to the UV light,15,33,43 which accounts for merely ~3-5% of the incident solar spectrum (Figure 1.3), leaving the visible (~44%) and near-infrared (NIR) light (~53%) underutilized.40,44 Such a situation makes the target photocatalytic efficiency of greater than 10% challenging.37
Figure 1.3 Spectral distribution of the solar photon irradiation based on the AM1.5 global data. Reprinted with permission.40 Copyright 2012, The Royal Society of Chemistry.
1.3.2 Redox capability
The excitons are expected to possess strong redox capabilities which are determined by the positions of the VB and CB. Take solar water splitting as an example. As mentioned in Section
1.2, solar water splitting is a thermodynamically uphill reaction. A ΔG of 237.2 kJ mol-1 is required to make one water molecule split into 1/2 O2 and H2 at room temperature and 1 atm.45 Photocatalytic water splitting is thus endothermic and an oxidation-reduction reaction, and according to the Nernst equation, theoretically, the ΔG corresponds to the increased energy (ΔE) of 1.23 V per transferred electron.46,47 In fact, to initiate the solar water splitting reaction, the photocatalyst should have a much larger bandgap than 1.23 eV (corresponding to the absorption edge of much shorter than 1008 nm) to overcome the over potentials of both water reduction (~0.05 V) and oxidation (0.25 V).48,49 Thus, the narrow bandgap and the strong redox potentials of excitons are contradictory and a balance between them should be established.
1.3.3 Charge separation and transportation
The charge carriers should be efficiently generated, separated and transported, and be of minimal or largely suppressed recombination. Charge recombination and separation/migration take place simultaneously while compete with each other during photocatalytic processes. It was reported that most of the photo-induced electrons and holes recombine very fast (within 10 ns),37,50 which makes achieving high photocatalytic efficiency very difficult as water splitting and other photocatalytic reactions occur on a time scale slower than this. Therefore, to gain high photocatalytic efficiency, the efficient generation, separation and transportation of charge carriers to the active redox sites or surface of photocatalysts are desired. Generally, a semiconductor with high crystallinity can decrease the trapping and recombination sites and facilitate the separation/transportation of charge carriers. In addition, photocatalysts with smaller size in some dimension, such as zero-dimensional (0D) nanodots,51-53 one-dimensional (1D) nanowires or fibers,54-56 two-dimensional (2D) nanosheets,9,57-60 can minimize the required diffusion distance of the excited electrons and holes to the surface and can consequently lower their recombination rate.
1.3.4 Adsorptivity and stability
Adsorption of water and reactants is the prerequisite for the occurrence of photocatalytic water splitting or decomposition of organic contaminants. To make the desired photocatalytic reaction happen, the charge carriers prior to their recombination are supposed to be transferred to the adsorbed molecules. The physical adsorptivity for photocatalysts is normally determined by the surface area. To increase the surface area, photocatalysts with different morphologies, such as
were rationally designed and synthesized. As the photo-generated charge carriers are highly reactive, if they cannot be timely consumed for desired photochemical reactions, they can often react with the photocatalyst itself, resulting in the deactivation and disintegration of the photocatalyst. Thus, the stability of the semiconductor photocatalyst is supposed to be excellent to resist both chemical corrosion and photocorrosion. In addition, the cost should also be taken into consideration in designing photocatalyst.
During the past decades, various semiconductor photocatalysts have been extensively explored and reported, such as TiO2,11,66-69 ZnO,70-72 ZrO2,73-75 Fe2O3,76-78 WO3,79-81 BiVO4,82-84 Bi2WO6,85-87 and CdS.88-91 Despite tremendous efforts have been paid to date, a practically viable photocatalyst which is efficient, stable, cost-effective and able to harvest photons with a broad wavelength range has not yet been developed. Most of the semiconductor photocatalysts are still suffering from fundamental efficiency bottlenecks, including the confined photon absorption, inefficient charge separation and transfer, a limited number of active sites and insufficient surface area and poor stability. To achieve the goal of sustainable development with the aid of photocatalysis, the exploration of a high-quality photocatalyst which can address the aforementioned challenges has been a hot research area and a “holy grail” for researchers.
1.4
Graphitic Carbon Nitride Photocatalyst
Among the various categories of semiconductor photocatalysts, graphitic carbon nitride (g-C3N4) has recently attracted tremendous interest of material scientists by virtue of its fascinating merits, such as nontoxicity, facile preparation, moderate bandgap (~2.7 eV), strong redox capability, “earth-abundant” nature, and good physicochemical stability.92-95
1.4.1 Microstructure
With a graphite-like layered structure, g-C3N4 is in a form of 2D sheets, based on s-triazine (Figure 1.4a) or tri-s-triazine (Figure 1.4b) tectonic unit interconnected via tertiary amines.96 In these cases, as the nitride pore size and the electronic environment of the N atom are different, the energetic stability of the allotropes is thus different. Among all the allotropes of C3N4, tri-s-triazine based g-C3N4 is energetically favored and is the most stable one under ambient conditions.93,97,98 Benefiting from the aromatic C-N heterocycles and the high condensation, g-C3N4 with tri-s-triazine ring structure is thermally stable with temperature up to 600 °C in air, which is confirmed by the thermogravimetric analysis (TGA) results.92 Furthermore, the strong interlayer van der Waals interactions render g-C3N4 chemically stable, which can resist most of the organic solvents,
acid and alkali solutions.92,99 The 2D g-C
3N4 nanosheets provides large specific surface area due to its graphite-like layered structure, and the theoretical value of g-C3N4 with monolayers is up to 2500 m2g-1,100 which is favorable for the adsorption of reactants and thus facilitates photocatalysis.
Figure 1.4 The hypothetical ideal structure of g-C3N4 based on (a) s-triazine and (b) tri-s-triazine (heptazine) tectonic units. Reprinted with permission.92 Copyright 2012, American Chemical Society.
1.4.2 Electronic structure
The presence of sp2-hybridized C and N results in the unique established π-conjugated electronic structures of g-C3N4 with a direct bandgap of ~2.7 eV. The appropriate VB and CB band positions at +1.6 eV and −1.1 eV vs NHE are anodically and cathodically sufficient for water oxidation and reduction to produce O2 and H2, respectively.101,102 In comparison to TiO2, which has a bandgap of 3.0-3.2 eV and can only respond to the UV light,11,35 g-C
3N4 shows photocatalytic activity in the visible light region. As a metal-free photocatalyst, Wang et al. in 2009 used g-C3N4 for water splitting to generate H2 under visible light irradiation for the first time.102 Since this pioneering work and due to the aforementioned intriguing properties, g-C3N4 has elicited ripples of excitement in the scientific community and has drawn worldwide attention in recent years.
1.4.3 Synthesis methods
As g-C3N4 consists of earth-abundant C and N elements, it is supposed to be prepared with accessible raw materials at low cost. Several cheap N-rich precursors with C-N core structure, such as melamine,103,104 cyanamide,101,105 dicyandiamide,106,107 urea,108,109 thiourea,110,111 or mixtures thereof,112 have been widely used to prepare g-C
3N4 via thermal polycondensation method (Figure 1.5).93 The N-rich molecules are polymerized into g-C
from urea normally has a higher specific surface area than that synthesized from melamine.113 While the g-C3N4 obtained from urea shows a larger bandgap than that prepared from thiourea.114
Figure 1.5 Schematic illustration of the synthesis process of g-C3N4 by thermal polymerization of different precursors such as melamine,103,104 cyanamide,101,105 dicyandiamide,106,107 urea,108,109 thiourea.110,111 The black, blue, white, red, and yellow balls denote C, N, H, O, and S atoms, respectively. Reprinted with permission.93 Copyright 2016, American Chemical Society.
1.4.4 Inherent drawbacks
Although g-C3N4 has been regarded as the most promising visible light-driven metal-free photocatalyst, several inherent shortcomings are still hindering its practical applications in solar water splitting and photocatalytic decomposition of organic contaminants.104,115 For example, the high recombination rate of the photoexcited electrons and holes along their migration from the bulk to the surface leads to relatively low photocatalytic activity of pristine g-C3N4.116 In addition, the not-so-narrow bandgap of g-C3N4 (~2.7 eV) confines its light response range only into the UV range and a small portion of visible light with wavelength shorter than 460 nm.117,118 As discussed in Section 1.3.1, sunlight covers a broad range of photon wavelengths (250-2500 nm). Therein, the UV (< 400 nm), visible (400-800 nm) and NIR (800-1400 nm) photons account for ∼5%, ∼45% and ~44%, respectively, of the total incident solar flux reaching the Earth surface.87,119-121 As the high percentage (~90%) of visible and NIR light is needed to essentially increase the overall solar energy utilization efficiency, the narrow light response range of g-C3N4 is far from “ideal”