HAL Id: hal-02696948
https://hal.inrae.fr/hal-02696948
Submitted on 1 Jun 2020HAL is a multi-disciplinary open access
archive for the deposit and dissemination of sci-entific research documents, whether they are pub-lished or not. The documents may come from teaching and research institutions in France or abroad, or from public or private research centers.
L’archive ouverte pluridisciplinaire HAL, est destinée au dépôt et à la diffusion de documents scientifiques de niveau recherche, publiés ou non, émanant des établissements d’enseignement et de recherche français ou étrangers, des laboratoires publics ou privés.
Search for multifactorial disease susceptibility genes in
founder populations
C. Bourgain, E. Genin, Hadi Quesneville, F. Clerget-Darpoux
To cite this version:
C. Bourgain, E. Genin, Hadi Quesneville, F. Clerget-Darpoux. Search for multifactorial disease sus-ceptibility genes in founder populations. Annals of Human Genetics, Wiley, 2000, 64 (3), pp.255-265. �10.1046/j.1469-1809.2000.6430255.x�. �hal-02696948�
Printed in Great Britain
Search for multifactorial disease susceptibility genes in founder populations
C. BOURGAIN", E. GENIN", H. QUESNEVILLE# F. CLERGET-DARPOUX" " UniteT de Recherche d’EpideTmiologie GeTneTtique, INSERM U535, Kremlin-BiceVtre
# Laboratoire de Dynamique du GeTnome et Evolution, Institut J.Monod, Paris (Received 4.1.00. Accepted 4.4.00)
The current challenge in biomedical research is to detect genetic risk factors involved in common complex diseases. The power to detect their role is generally poor in populations that have been large for a long time. It has been suggested that the power may be increased by taking advantage of the specificity of founder populations ; linkage disequilibrium spanning larger regions and kinship coefficients being stronger than in large populations. A new method is proposed here, the Maximum Identity Length Contrast (MILC) which, in contrast with other existing methods, does not make the assumption of unique ancestry for the genetic risk factors. It is thus appropriate for a search for common genetic risk factors for complex diseases. Statistical properties of the method are discussed in realistic contexts.
Many genetic studies presently focus on foun-der populations, i.e. populations that are foun-derived from a small number of individuals and have undergone a demographic expansion with neg-ligible migration after foundation. In fact, these populations have been fruitfully exploited to map and clone genes involved in rare monogenic diseases (Ha$ stbacka et al. 1992; Houwen et al. 1994). For the study of these diseases, it is assumed that all affected individuals carry a unique mutation introduced into the population by one ancestor. Random affected individuals are thus assumed to carry an identical by descent (IBD) mutation and to consequently share a common haplotype in the vicinity of the disease locus (de la Chapelle, 1993). Non-random associations of alleles at different loci, usually referred to as Linkage Disequilibrium (LD), are thus expected nearby the disease gene. In fact, disease mutations exhibiting LD with marker Correspondence : Catherine Bourgain, INSERM U535, Batiment Gregory Pincus, 78 rue du Ge! ne!ral Leclerc, 94275 Le Kremlin-Bice# tre Cedex, France. Tel: (33) 01 49 59 53 30 ; Fax : (33) 01 49 59 53 31 ; E-mail : bourgain!kb.inserm.fr
alleles over large regions (5–15 cM) (Groenwald et
al. 1998 ; Starfield et al. 1997 ; Labuda et al. 1996) have been reported in different founder popu-lations. The extent of LD around a disease locus harboring a founder mutation mainly depends on the time that has elapsed since the mutation occurred or entered the population (de la Chapelle & Wright, 1998). LD is a decreasing function of the genetic distance and can be used for the fine mapping of a disease gene.
The current challenge in biomedical research is to detect genetic risk factors involved in common complex diseases. In the last twenty years, epidemiological studies of complex diseases have resulted in a body of convincing arguments that susceptibility alleles are not rare but common. The simplest argument is to consider IBD distributions in affected sib pairs either on the whole genome or on already known susceptibility loci. The proportion z! of affected sibs pairs who are IBDl 0 at a given locus (i.e. the two sibs received two different parental alleles at the locus) is never negligible, showing that, within a family, the disease may cosegregate with different parental alleles. This, in turn, indicates that susceptibility alleles are frequent enough to
be present in both parents or in double dose in one parent. The most classical examples are the IBD distributions in the HLA region for HLA-associated diseases. The proportions z! of affected sibs who are IBDl 0 for HLA are 0.08 for type I diabetes (Payami et al. 1985) and 0.09 for coeliac disease (Greco et al. 1998), and thus clearly non-zero. Conversely, for a rare factor, very small values of z! (i.e. very near to zero) are expected, as the probability for the susceptibility allele to be present in both parents or in double dose in one parent is negligible. In fact, genome scan linkage analyses performed on complex diseases have shown that very small values of z! can be excluded from the whole genome in most cases, implying that genetic factors for these diseases are expected to be common. Further-more, very few genetic risk factors are presently identified for complex diseases but those that are known are common. For instance, it has now been demonstrated that the ApoE4 allele of the apolipoprotein E locus is associated with Alzheimer disease. This allele has a mean fre-quency of about 15 % in human populations. Its frequency is clearly enhanced among affected individuals of all studied human populations (mean frequency of about 30 %, The ApoE and Alzheimer disease meta analysis consortium, 1997). Similarly, the DQA0501–DQB0201 hetero-dimer is strongly associated with coeliac disease. Indeed, this HLA heterodimer has a frequency of 80–95 % among affected individuals of different European origin, but also a frequency of 15–20 % in the corresponding general populations (Clerget-Darpoux et al. 1994).
These factors are neither necessary nor sufficient to develop the disease. The power to detect their role is poor in large panmictic populations. It has been suggested that the power may be increased by taking advantage of the specificity of founder populations, in par-ticular of kinship coefficients stronger than in large populations and of the extent of LD over large regions. Furthermore it has been argued that heterogeneity could be reduced in such populations (Lander & Schork, 1994).
New methods using LD and combined
in-formation on several linked markers have re-cently been proposed to locate genes involved in multifactorial diseases (Lazzeroni, 1998 ; Service
et al. 1999 ; Clayton & Jones, 1999). Even if these approaches allow for an etiologic heterogeneity for the disease by supposing that not all the affected individuals carry the disease allele, all carriers are assumed to have inherited a copy from one unique ancestor present among the founders of the population. This hypothesis is also used in all methods based on the coalescence theory that have been proposed so far (Mc Peek & Strahs, 1999 ; Graham & Thompson, 1998). However, when a genetic risk factor is frequent in a large human population, it certainly must have been frequent among a group of founders 10 to 20 generations earlier (mean time since foundation for many well known founder popu-lations such as the Saguenay population of Quebec, the northern subisolates of Finland etc.). As an example, the study of the non-human primate ApoE gene tends to show that ApoE4 (the allele associated with greater risk) is the ancestral state of the ApoE gene. In fact, Hanlon & Rubinsztein (1995) showed, in comparing sequences of ApoE genes in different primates, that all the non-human primate ApoE alleles correspond to ApoE4. Hence there is no reason to hypothesize that this factor would have been rare among small human groups 200 to 400 years ago. It is unlikely that carriers of the factor in the present time have inherited it from only one unique ancestor of the founding generation.
The aim of the present study is to examine the use of founder populations to locate such com-mon genetic risk factors. In this paper, we present a new statistic, the Maximum Identity Length Contrast (MILC), that makes no as-sumption on the existence of a unique ancestral haplotype. The statistic is based on the same principle as the Haplotype Sharing Statistic (HSS), proposed by Van der Meulen & te Meerman (1997). Like HSS, MILC contrasts genomic identity lengths observed among affected individuals with those observed among random individuals from the same population. However, MILC uses a different way to contrast
both groups and consider the maximum of the statistic over a genomic region. The power of the MILC statistic has been investigated here on simulated data. Interests and limitations of this approach are discussed.
The Maximum Identity Length Contrast Statistic
(MILC)
The principle of MILC is to search for an excess of haplotype identity among affected individuals. This excess is expected to signal the presence of a genetic risk factor.
The sample consists of affected individuals and their parents, typed for a set of linked markers. Two groups of haplotypes are considered : those formed by the parental alleles that are trans-mitted to the affected offspring and those formed by the parental alleles that are not transmitted. These haplotypes may thus be different from parental haplotypes if recombination occurred. The ‘ non-transmitted haplotypes ’ group is rep-resentative of the overall population in a similar manner to what has been demonstrated for non-transmitted alleles (Spielman et al. 1993 ; Thomson, 1995) and used as a control group. In the present study all parents are assumed to be typed, and chromosomal phases systematically known for probands. This hypothesis was made in a first approach for simplicity, as it allows unambiguous determinations of transmitted and non-transmitted haplotypes. Haplotype identity length is characterized in each group and con-trasted over the two groups.
Computation of the haplotype identity length
Let SLj(t) be the score of identity length at
marker L, for the jth pair of haplotypes within the transmitted group and SLj(n) the score of
identity length at marker L for the jth pair of haplotypes within the non-transmitted group. These scores are computed for each possible pair of haplotypes at every marker locus L as follow. Starting from the locus L, marker alleles at that locus are compared between the two haplotypes of the jth pair. The comparison is repeated for
right and left adjacent markers as long as alleles are identical by state. SLj(t) is the distance
between the leftmost and the rightmost markers with identical alleles. For each marker L, we consider ML(t) and ML(n) defined respectively as
the mean of SLj(t) over all possible pairs of
haplotypes, j, in the transmitted group and the mean of SLj(n) over all possible pairs of
haplo-types, j, in the non-transmitted group.
Identity length contrast statistic
Van der Meulen & Te Meerman (1997) have proposed the comparison of these mean values between the two haplotype groups at every locus L. However, to contrast both groups they consider an absence of LD among marker alleles under the hypothesis of no genetic risk factor in the studied genomic region. We showed that this hypothesis on LD is untrue. Additionally, when tests are performed on many markers in a region, investigators usually use the maximum score observed. The statistic we propose makes no assumption on the LD. MILC considers DMLl
ML(t)kML(n) and DM
max, defined as the
maxi-mum value of DML over all markers used on a
chromosomal region.
To look for an excess of haplotype identity length in the group of transmitted haplotypes, we compare the observed value of DMmaxwith its distribution under the null hypothesis of no difference between groups. To obtain this dis-tribution, DMmaxis computed a large number of times on haplotype groups constructed to show no difference : for each parent, we randomly reassigned one of the transmitted or non-transmitted haplotypes to a group, the other haplotype being assigned to the other group. From this distribution, the significance level is determined by obtaining the probability to exceed the observed DMmax under the null hypothesis. Conversely, for a given type one error α, a threshold Tα can be obtained and DMmaxcan be compared to Tαto conclude.
For a given type I error the power of the MILC statistic depends on the population genetic characteristics (kinship coefficient, LD pattern), on the disease genetic model and on the marker
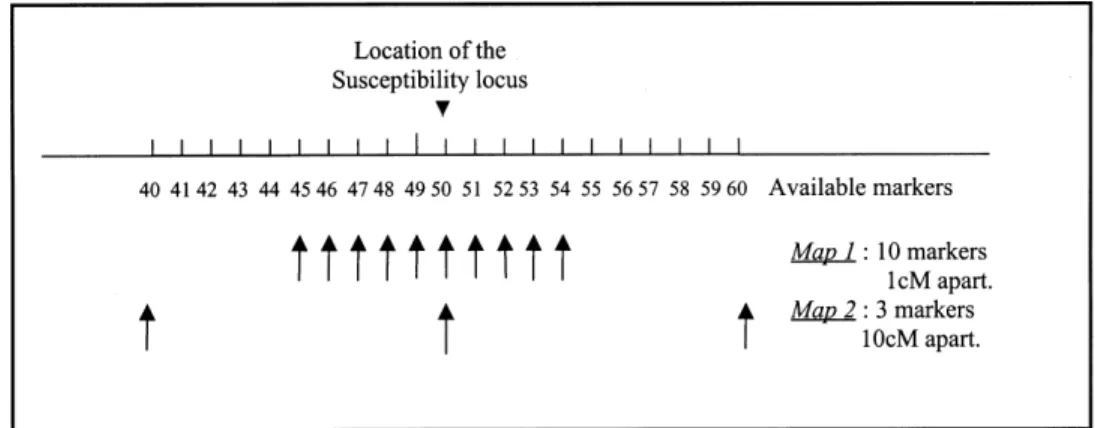
Fig. 1. Typing situations studied. Two situations were considered in terms of number and location of markers on the chromosomes : map 1 and map 2.
map used in the analysis. When working in a given population, as the genetic model under-lying the disease is not known, the only element to be chosen by the investigator is the marker map. In a first approach, we evaluated the power at given type I error of the MILC statistic for different marker typing situations and for a fixed genetic model.
Population genetic characteristics of founder populations are highly determined by stochastic processes occurring during population history : initial sampling process (there are only a few individuals and they are thus not necessarily representative of the population they come from) and genetic drift (due to small population sizes) that occurs during the first generations. The same set of initial and growth population parameters (number of founders, number of generations since foundation, number of children per couple) may lead to different population genetic characteristics. We performed different population simulations in order to obtain the mean power and variance for given population parameters and disease genetic model.
Population and genetic models used in the analysis
Populations are simulated with the software GENOOM, developed by Hadi Quesneville (Quesneville & Anxolabe! he're, 1997). Populations founded by 500 individuals and followed during 10 generations are simulated. The number of offspring per couple is randomly drawn from a
Poisson distribution with a initial mean value of r!l3 and a maximum cut-off value of 10. The reproduction rate, r, varies from generation to generation according to a logistic model (rl (r0–2)(1-N\50,000)j2, with N: size of the popu-lation). Individuals are assumed to live for 3 generations. The mean population size, over 100 population simulations, is 33892 (maximum value of 37008, minimum value of 30092). Random mating, no mutation and no migration are assumed during the 10 generations. Since different non-homologous chromosomes can be considered as independent, each individual is represented by one pair of chromosomes of length 100 cM.
We considered one biallelic disease suscep-tibility locus (located at position 50cM on the chromosome). The allele at greater risk (allele 2) has a frequency of 20 % in the population from which the founders were sampled and the penetrances are 0.03, 0.06 and 0.30 respectively for genotypes 1\1, 1\2 and 2\2. The mean disease frequency over 100 population simulation is 5.00 % (maximum value of 5.86 %, minimum value of 4.27 %). Two marker maps are investi-gated : a dense map with ten markers spaced 1 cM apart, located from position 45 cM to position 54 cM on the chromosome (map 1) and a wider map with three markers 10 cM apart (map 2), located from position 40 cM to 60 cM (see Fig. 1). Each marker has five equifrequent alleles in the original population of the founders (mean heterozygosity of 0.8). One marker is located at the disease susceptibility locus (negligible
re-combination fraction) but this marker is not the disease susceptibility locus itself (i.e. the marker is not the functional polymorphism). No marker allele exhibits any particular linkage dis-equilibrium with the disease susceptibility locus in the population from which the 500 founders are sampled.
Power
The power of the MILC statistic was studied at a nominal value of 5 %, for every simulated population. The power in one population is obtained by computing MILC on 500 different samples of randomly drawn affected individuals in that population. The power is assessed as the proportion of samples for which the MILC statistic is significant at the 5 % level. Each sample consists of 200 affected individuals and their parents. Power was assessed in 100 popu-lation simupopu-lations. The mean power over the 100 populations and the associated variation interval are computed. For comparison, TDT test powers using the GASSOC software (Schaid, 1996) were also computed on the previously described populations using the marker located at position 50cM (position of the disease locus).
To evaluate whether the power of MILC depends on the kinship contrast existing at the disease locus between affected and control indi-viduals, we characterized the kinship coefficients at the disease locus in both haplotype groups, the haplotypes of affected individuals (transmitted) and the control haplotypes (non-transmitted).
Kinship coefficient contrast
The kinship coefficient is calculated as the probability of being identical by descent for two randomly drawn alleles at a given locus, in a given generation. To compute this coefficient a very highly polymorphic marker was simulated at the disease susceptibility locus location (pos-ition 50 cM), in order to have 1000 different alleles in the 500 founder individuals. The kinship coefficient is computed on the same samples as the power computations, for both haplotype groups with 10 000 random drawings and allele comparisons of 2 haplotypes. The coefficients (for
transmitted or non-transmitted groups) assigned to the population are the mean over the 500 haplotypes groups sampled in this population. The mean kinship coefficient values and asso-ciated variation interval over the 100 population simulations are computed. Mean kinship co-efficients in transmitted and non-transmitted haplotype groups are contrasted using a Student
t-test.
Although the power of the MILC statistic relies on this kinship coefficient contrast, this contrast is not directly available from data, as such highly polymorphic markers are not yet available. The power of the statistic thus also relies on the information available on this contrast that is brought by the linkage dis-equilibrium between the marker alleles and the locus and also among marker alleles themselves. Indeed, since the MILC statistic considers the markers one at a time, sequentially along the chromosome, its power also depends on the LD among alleles at adjacent markers. As an il-lustration, we characterised the LD pattern in some of the simulated populations, denoted P!, P", P#, P$ and P%; first between the susceptibility locus alleles and the marker alleles and second between alleles at successive adjacent markers. We measure the LD by a simple chi-square test, as the markers used are polymorphic. This measure is highly dependent on allele frequencies. But in these populations, even after 10 generations, allelic frequencies at every marker are very similar : 5 alleles at every marker locus, with a global mean frequency of 0.199, and a standard deviation of 0.02. In a given popu-lation, LD is measured in 500 random samples of 500 affected individuals and their parents and for the 2 types of haplotype groups. Mean p-value of the global chi-square test over the 500 measures is computed for each population.
RESULTS
Table 1 presents the mean powers and associated variation intervals of the MILC stat-istic for the two typing situations. The power of a TDT at the disease locus is also reported. First, the mean power of the MILC statistic is low in
Table 1. MILC and TDT power* variations among population simulations of given initial and
growth characteristics with a nominal level of 5%
MILC TDT†
Marker located Typing situation Map 1 Map 2 on the locus
Power mean 0.43 0.10 0.10
Variation interval [0.02 ; 0.88] [0.01 ; 0.33] [0.02 ; 0.23]
* The power is calculated in every population over 500 samples of 200 affected individuals and their two parents. Mean power over 100 population simulations is presented.
† TDT tests are performed for the marker located on the susceptibility locus using the Gassoc software (Schaid, 1996).
Table 2. Mean kinship coefficients over all
population simulations in the two types of haplotype groups Transmitted haplotypes Non-transmitted haplotypes Mean kinship coefficient* 0.0064 0.0055 Variation interval [0.0057 ; 0.0071] [0.0051 ; 0.0059] * Kinship coeffcients are computed in groups of 400 transmitted or non-transmitted haplotypes (see text). the situation we studied. However it is enhanced when using a denser map (map 1). Furthermore, the mean power of MILC with a dense map is 4 times greater than that of the TDT. The use of the information simultaneously on several markers may thus increase the power to detect genetic risk factors.
Another important result is the large difference of power among population simulations. Using map 1, the power can vary from nearly 2 % to nearly 90 % for some populations. Situations where the power of the MILC is equivalent for both marker typing situations were even observed.
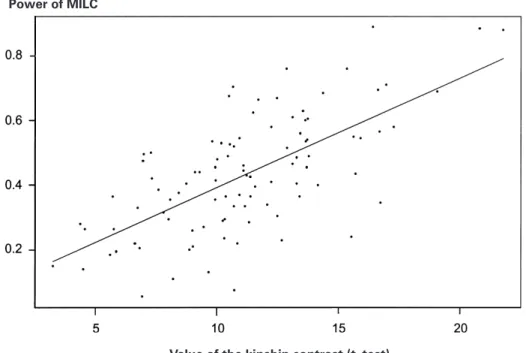
Table 2 presents the kinship coefficients in both haplotype groups. This coefficient is signifi-cantly higher (at the 0.001 level) in the trans-mitted group than in the non-transtrans-mitted and for every population we simulated. As expected, transmitted haplotypes are more related in the vicinity of the susceptibility locus than non-transmitted haplotypes. Furthermore, as shown in Figure 2, there is a linear increase of MILC power with the kinship contrast. Indeed, the linear regression of MILC power over the kinship contrast t-test value is highly significant (R# l 0.44, associated p-value 6i10−"%). Note
how-ever that, even in the transmitted haplotype group, the kinship coefficient is low (0.0064). This is clearly different from the monogenic context in founder populations where a strong kinship coefficient is expected for transmitted haplotypes as all affected individuals are thought to have inherited the disease allele from one common ancestor (for a dominant disease a kinship coefficient close to 0.25 is expected) and a low coefficient for non-transmitted haplotypes (representative of the basal level of kinship due to the population history). The low kinship observed for both groups in our populations is due to the characteristics of the genetic risk factor modelled (frequent at risk genotypes and low associated penetrances).
Note that the disease locus that we modelled in this study very roughly approximates the effect of APOE in Alzheimer disease, considering that allele 2 represents ApoE4 and allele 1 the other
APOE alleles (The ApoE and Alzheimer disease meta analysis consortium, 1997) and considering constant genotype-specific risks with age and sex. Interestingly, the kinship coefficient values we obtained are very close to those observed in a recent study (Vezina et al. 1999) concerning
ApoE4 and Alzheimer disease in the Saguenay area of Quebec (a founder population with characteristics similar to our simulations). The poor contrast between the kinship coefficients explains the relatively poor power we observed for the MILC statistic.
Figure 3 shows the LD between alleles at the susceptibility locus and marker alleles in the population P!. It appears that LD between the susceptibility locus alleles and the alleles of the marker located on the susceptibility locus is
Power of MILC
Value of the kinship contrast (t–test)
Fig. 2. Power of the MILC statistic as a function of the kinship contrast between haplotype groups (with a nominal level of 5 %, for the typing situation 1).
Fig. 3. Linkage disequilibrium between the susceptibility locus alleles and the marker alleles in groups of 1,000 transmitted or non-transmitted haplotypes in the population P!. Mean p-values of the global chi-square test. The global chi-chi-square test is performed in 500 different haplotype groups built with 500 random samples of 500 affected individuals and their parents from population P!. The mean p-values of the global chi-square test over the 500 measures are reported.
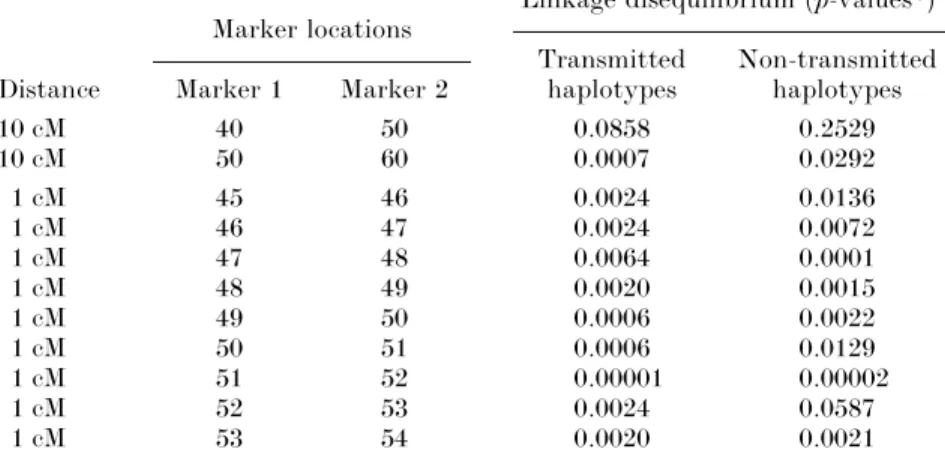
Table 3. Linkage disequilibrium between different marker pairs in groups of 1000 transmitted or
non-transmitted haplotypes in the population P! Marker locations
Linkage disequilibrium (p-values*) Transmitted Non-transmitted Distance Marker 1 Marker 2 haplotypes haplotypes
10 cM 40 50 0.0858 0.2529 10 cM 50 60 0.0007 0.0292 1 cM 45 46 0.0024 0.0136 1 cM 46 47 0.0024 0.0072 1 cM 47 48 0.0064 0.0001 1 cM 48 49 0.0020 0.0015 1 cM 49 50 0.0006 0.0022 1 cM 50 51 0.0006 0.0129 1 cM 51 52 0.00001 0.00002 1 cM 52 53 0.0024 0.0587 1 cM 53 54 0.0020 0.0021
* The global chi-square test is performed in 500 different haplotype groups built with 500 random samples of 500 affected individuals and their parents from population P!. The mean p-values of the global chi-square test over the 500 measures are reported.
significantly stronger among transmitted haplo-types.
LD can be stronger for loci 6 cM apart (marker 44 cM and disease susceptibility locus) than for loci 1cM apart (marker 49 cM and disease susceptibility locus). LD is thus not a simple decreasing function of the genetic distance as observed around a disease mutation in a mono-genic context. Table 3 presents the LD between alleles at adjacent markers 1 cM apart (map 1) and at markers 10 cM apart (map 2). In this population P!, LD may be equivalent for markers 10 cM apart and for markers 1 cM apart (LD between markers 50–60 cM and markers 50– 51 cM for the transmitted group) and even sometimes stronger (markers 50–60 cM and markers 47–48 cM for the transmitted group). We present in Table 4 the power of the statistic in the population P! for both typing situations. Indeed, this allows us to compare the power of
Table 4. Power of the MILC statistic with a
nominal level of 5% for map 1 and map 2 and
power of the TDT test for the marker located on the susceptibility locus in the population P!
MILC (Map 1) MILC (Map 2) TDT
0.33 0.30 0.11
The power is calculated using 200 individuals and their 2 parents.
the statistic at a given kinship contrast but with two different pattern of LD. In this case, MILC power is equivalent for typing situations 1 and 2, meaning that markers 10 cM apart in this population are as informative for the disease susceptibility locus as markers 1 cM apart.
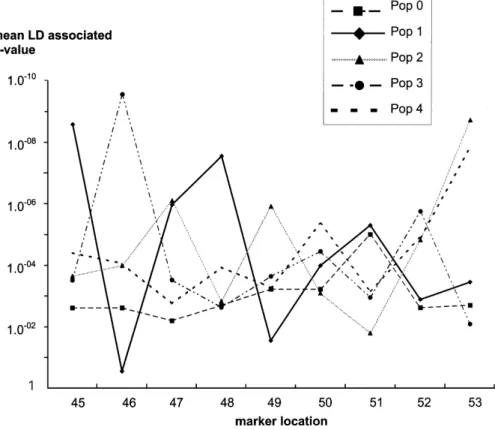
The results presented here on one population (P!) illustrate the large variability of LD observed among chromosomal regions. Figure 4 presents the LD among marker alleles 1 cM apart in groups of transmitted haplotypes for a set of population simulations. It appears that the large variability of LD is also observed among popu-lation simupopu-lations. The LD patterns can be strongly different from one population to the other. This may largely explain the variability of power observed in Table 1 for the MILC statistic.
Unlike other methods that have been proposed previously, the MILC statistic presented in this paper makes no assumption of unique ancestry for the genetic risk factors. It is thus appropriate for the search of common genetic risk factors for complex diseases.
The present study was conducted by simu-lating a marker map on a single chromosome carrying a disease locus. This situation corre-sponds to a candidate gene or candidate region
1
Fig. 4. Linkage disequilibrium between markers 1 cM apart in groups of 1000 transmitted haplotypes in 5 different populations (Pop0 to Pop4). Mean p-values of the global chi-square test are reported.
strategy. We compared the power of MILC with that of the TDT using a marker located on the disease locus. This is the most powerful situation for the TDT. However, if MILC is performed on the whole genome, the significance level must be adjusted for multiple testing. As the statistic uses the maximum of the contrast on a chromo-somal region, the correction deals with the number of regions tested. When considering chromosomal arms, since the tests applied to different arms are independent, a Bonferroni correction may be applied. This correction will lead to an important decrease of power as compared to the situation presented in this paper. Note that the correction would be even more drastic for a systematic TDT.
The use of information on several consecutive markers seems to enhance the power to detect genetic risk factors. However this increase in power depends on the existence of LD among marker alleles. We showed that LD patterns are highly variable in founder populations among
chromosomal regions as well as among popu-lations. Indeed stochastic effects are important in such populations and particularly in the creation and evolution of LD. If, as supposed in our simulation study, no particular LD is present among founders, LD in the first generation can only be created by the initial sampling process of a small group of individuals : the founders are not necessarily representative of the population they come from. During the population growth phase two forces act on LD. Recombination tends to reduce initial LD and genetic drift, due to the small population sizes in the initial generations, tends to randomly create LD. Consequently the power of the genetic study of complex diseases is highly variable. In particular, the large power variability of the MILC statistic among popu-lation simupopu-lations may be closely linked to this LD variability. Interestingly, recent studies tend to confirm this significant variation in LD among human populations (Kidd et al. 1998 ; Goddard et
In our study, no initial LD is modelled between the susceptibility locus and the marker alleles in the initial population. However, LD around genetic risk factors for complex diseases has been observed in several populations. In this way, LD between APOE and marker alleles spanning over less than 5 kb has been observed (Seixas et al. 1999). We could thus realistically model an initial LD between the susceptibility locus and the marker located on it. On the other hand, some intragenic polymorphisms are in linkage equilibrium with APOE.
However, the existence of initial LD between the susceptibility locus and the marker located on it would probably have enhanced the final LD and thus the power of MILC as well as the power of the TDT. For an optimal use of the MILC, a good knowledge of the LD among the markers that are available in the population is thus necessary. Preliminary population studies are required in order to use the best marker map.
The existence of stochastic processes has another important consequence : the strength of LD is not a simple indicator of the genetic distance. The power to locate precisely genetic risk factors for complex diseases may be poor for any fine-mapping method based on linkage disequilibrium, in contrast to rare genetic risk factors for monogenic diseases.
In a first approach, it has been assumed in the present paper that all parents were typed and chromosomal phases systematically known for probands. Indeed, when parents are typed, if the markers are close and polymorphic, phases can be reconstructed in most of the situations. However, discarding families for which phases are ambiguous leads to inflation of the type I error rate (Curtis & Sham, 1995 ; Knapp, 1999). Further work will be required to correct for this bias as well as to consider situations where parental genotypes are not available.
The power of MILC depends on many meters (initial population size, growth para-meters, genetic model, marker map charac-teristics etc) and all the situations could not be considered here. In particular, we assumed that the number of offspring during the growth period
is Poisson distributed. As it has been shown (Austerlitz & Heyer, 1999) that, for the popu-lation of Saguenay Lac StJean (French Canadian
founder population), zero-geometric distribution is a better approximation of the observed distribution, it could be interesting to assess the consequences of a change in this distribution on the power of MILC.
However, our results suggest that the random sampling of affected individuals in founder populations, even when integrating information on several markers, does not seem to be a strategy as powerful for complex diseases as for monogenic diseases. It could be related to the fact that the genetic risk factors involved in complex diseases are different to those involved in monogenic disease : they are possibly common factors, neither necessary nor sufficient to deve-lop the disease. Extensions of the method in order to account for known genealogies in the sampling of affected individuals are under study. Indeed, this information is available in many isolates and may likely enhance power.
We would like to thank Gerard te Meerman for having kindly presented the haplotype sharing statistic and providing his program. We also thank Bernard Prum for helpful considerations on the MILC statistic. The simulation software GENOOM is available at http : \\oxygene.ijm.jussieu.fr\" hadi\software\genoom\ genoom-welcome.html A C-program for the MILC statistic is available on request (e-mail : bourgain!kb. inserm.fr).
Austerlitz, F. & Heyer, E. (1999) Impact of demographic distribution and population growth rate on haplotypic diversity linked to a disease gene and their conse-quences for the estimation of recombination rate : the example a French Canadian population. Genet.
Epidemiol. 16, 2–14.
Clayton, D. & Jones, H. (1999) Transmission\ Disequilibrium Tests for Extended Marker Haplo-types. Am. J. Hum. Genet. 65, 1161–1169.
Clerget-Darpoux, F., Bougherra, F., Kastally, R., Semana, G., Babron, M. C., Debbabi, A., Bennaceur, B. & Elliaou, J. F. (1994) High risk genotypes for celiac disease. C. R. Acad. Sci. Paris. 317, 931–6. Curtis, D. & Sham, P. C. (1995) A note on the application
of the transmission disequilibrium test when a parent is missing. Am. J. Hum. Genet. 56, 811–812.
de la Chapelle, A. (1993) Disease gene mapping in isolated human populations : the example of Finland. J. Med.
Genet. 30, 857–865.
de la Chapelle, A. & Wright, F. (1998) Linkage dis-equilibrium mapping in isolated populations : the example of Finland revisited. Proc. Natl. Acad. Sci.
USA 95, 12416–12423.
Goddard, K. A. B., Hall, J. M. & Witte, J. S. (1999) Linkage disequilibrium and allele frequency distri-butions in 114 SNPs across the genome in five populations. Genet. Epidemiol. 17, 198.
Graham, J. & Thompson, E. A. (1998) Disequilibrium likelihoods for fine-scale mapping of a rare allele. Am.
J. Hum. Genet. 63, 1517–30.
Greco, L., Corazza, G., Babron, M. C., Clot, F., Fulchignoni, M. C., Percopo, S., Zavattari, P. et al. (1998) Genome search in celiac disease. Am. J. Hum.
Genet. 62, 669–675.
Groenwald, J., Liebenberg, J., Groenwald, I., & Warnich, L. (1998) Linkage disequilibrium analysis in a recently founded population : evaluation of the variegate porphyria founder in south african afrikaners. Am. J.
Hum. Genet. 62, 1254–1258.
Hanlon, S. C. & Rubinsztein, D. C. (1995) Arginine residue at codons 112 and 158 in the apolipoprotein E gene corresond to the ancestral state in humans.
Atherosclerosis 112, 85–90.
Ha$ stbacka, J., de la Chapelle, A., Kaitila, I., Sistonen, P., Weaver, A. & Lander E. (1992) Linkage dis-equilibrium mapping in isolated founder populations : diastrophic dysplasia in Finland. Nat. Genet. 2, 204–211.
Houwen, R. H. J., Baharloo, S., Blankenship, K., Raeymaekers, P., Juyn, J., Sandkuijl, L. A. & Freimer NB (1994) Genome screening by searching for shared segments : mapping a gene for benign recurrent intrahepatic cholestasis. Nat. Genet. 8, 380–386. Kidd, K. K., Morar, B., Castiglione, C. M., Zhao, H.,
Pakstis, A. J., Speed, W. C., Bonne-Tamir, B. et al. (1998) A global survey of haplotype frequencies and linkage disequilibrium at the DRD2 locus. Hum. Genet.
103(2), 211–27.
Knapp, M (1999). The transmission\disequilibrium test and parental-genotype reconstruction : the reconstruction-combined transmission\disequilibrium test. Am. J. Hum. Genet. 64(3), 861–70.
Labuda, M., Labuda, D., Korab-Laskowska, M., Cole, D. E. C., Zietkiewicz, E., Weissenbach, J., Popowska, E.
et al. (1996) Linkage disequilibrium analysis in young populations : pseudo-vitamin D-deficiency rickets and the founder effect in French Canadians. Am. J. Hum.
Genet. 59, 633–643.
Lander, E. S. & Schork, N. J. (1994) Genetic dissection of complex traits. Science 30 ; 265(5181), 2037–48.
Lazzeroni, L. C. (1998) Linkage disequilibrium and gene mapping : an empirical least-squares approach. Am. J.
Hum. Genet. 62, 159–170.
McPeek, MS.. & Strahs, A. (1999) Assessment of linkage disequilibrium by the decay of haplotype sharing, with application to fine-scale genetic mapping. Am. J. Hum.
Genet. 65, 858–75.
Payami, H., Thomsom, G., Motro, U., Louis, E. J. & Hudes, E. (1985) The affected sib method. IV. Sib trios. Ann. Hum. Genet. 49, 303–314.
Quesneville, H. & Anxolabe! he're, D. (1997) GENOOM: a simulation package for GENetic Object Oriented Modeling. In the proceeding of the European Math-ematical Genetics Meeting. Ann. Hum. Genet. 61, 543. Schaid, D. J. (1996) General score tests for association of genetic markers with disease using cases and their parents. Genet. Epidemiol. 13, 423–449.
Seixas, S., Trovoada, M. J. & Rocha J. (1999) Haplotype analysis of the Apolipoprotein E and Apolipoprotein C1 loci in Portugal and Sao Tome! e Principe : linkage disequilibrium evidence that Apoe 4 is the ancestral allele. Hum. Biol., 6, 1001–1008.
Service, S. K., Temple Lang, D. W., Freimer, N. B. & Sandkuijl, A. (1999) Linkage-disequilibrium mapping of disease genes by reconstruction of ancestral haplo-types in founder population. Am. J. Hum. Genet. 64, 1728–1738.
Spielman, R. S., McGinnis, R. E. & Ewens, W. J. (1993) Transmission test for linkage disequilibrium : the insulin gene region and insulin-dependent diabetes mellitus. Am. J. Hum. Genet. 52, 506–516.
Starfield, M., Hennies, H. C., Jung, M., Jenkins, T., Wienker, T., Hull, P., Spurdle, A. et al (1997) Localization of the gene causing keratolytic winter erythema to chromosome 8p22–p23, and evidence for a founder effect in South African Afrikaans-speakers.
Am. J. Hum. Genet. 61, 370–378.
The APOE and Alzheimer disease meta anlysis con-sortium (1997) Effects of age, gender and ethnicity on the association between apoliprotein E genotype and Alzheimer disease. J. Am. Med. Assoc. 278, 1349–1356. Thomson, G. (1995) Mapping Disease Genes : family-based association studies. Am. J. Hum. Genet. 57, 487–498.
Van der Meulen, M. A. & Te Meerman, G. T. (1997) Association and haplotype sharing due to Identity by Descent, with an application to genetic mapping. In :
Genetic Mapping of Disease Genes(eds. J. H. Edwards, I. H. Pawlowitzki & E. Thompson). London Academic Press.
Vezina, H., Heyer, E., Ouellette, G., Robitaille, Y. & Gauvreau, D. (1999) A genealogical study of Alzheimer disease in the Saguenay Region of Quebec. Genet.