Aneurysms of the abdominal aorta: familial
and genetic aspects in three hundred
thirteen pedigrees
A. Verloes, N. Sakalihasan, L. Koulischer, and R. Limet, Libge, Belgium Purpose: Familial clustering of abdominal aortic aneurysm was first noticed in 1977. Methods: Through questionnaire and phone inquiry, familial data on 324 probands with
abdominal aortic aneurysms allowed the establishment of 313 multigenerational pedigrees including 39 with multiple affected patients.
Results: There were 276 sporadic cases (264 men, 12 women); 81 cases belonged to multiplex pedigrees (76 men; 5 women). We compared familial and sporadic male cases; the ages at diagnosis were 64.1 -+ 7.9 years and 66.0 -+ 7.3 years (p < 0.05), respectively, the ages at rupture were 65.4 -+ 6.6 years and 75.2 -+ 8.6 years (20 < 0.00i), and the rupture rate was 32.4% and 8.7% (p < 0.001). Survival curves were computed. Relative risk for male siblings of a male patient was 18. We performed a segregation analysis with the mixed model, the most likely explanation for occurrence of abdominal aortic aneurysm in our families was a single gene effect showing dominant inheritance. The frequency of the morbid allele was 1 : 250, and its age-related penetrance was not higher than 0.4. Conclusion: This analysis indicates the preeminence of genetic factors on multifac- toNal/environmental effects of the pathogenesis of abdominal aortic aneurysm. (J VAse
SURG 1995;21:646-55.)
Abdominal aortic aneurysm (AAA) is a c o m m o n disease with an estimated incidence o f 20 to 40 cases per 100,000 persons per year. 1'2 Its prevalence in adult autopsy series lies between 1% and 6%. In a recent English study its prevalence was 2.6% in men aged 60 to 64 years, 6% for those aged 65 to 74 years, and 9% for those older than 75 years. 3 In an epidemiologic survey held in 1992 in England and Wales, AAA caused 1.9% o f all death in men and 0.7% o f all death in w o m e n 60 years or older. The overall survival rate in case o f rupture was 18% including preoperative and perioperative mortality. 4 Although AAA is frequent in the elderly, the familial clustering o f cases has only recently attracted atten- tion. Since the first case report by Clifton was published, 5 several series have been published. They confirm that AAA is one o f the most common "familial" diseases. Although some descriptive statis- tics are available on the familial aspects and on the
From the Centre for Human Genetics, Liege University, and the Depamnent of Cardiovascular Surgery (Dr. Limet), University Hospital of Liege.
Reprint requests: A. Verloes, Centre de Gfin&ique Humaine, C.H.U. Liege, Domaine Universitaire du Sart-Tilman 4000, Litge, Belgium.
Copyright © 1995 by The Society for Vascular Surgery and International Society for Cardiovascular Surgery, North Ameri- can Chapter.
0741-5214/95/$3.00 + 0 24/1/62619 646
natural history o f the disease, the pathogenesis and the genetic background remain obscure. Each mode o f inheritance (dominant, recessive, X-linked, multi- factorial) was advocated in turn.
Most studies o f common diseases assume that genetically determined factors are numerous and give an equal and individually small contribution to the phenotype (polygenic models), hence limiting the possibility o f formal genetic analysis to the compu- tation o f heritability. The question o f whether a single identifiable locus accounts for a significant amount o f the phenotypic variation in a population may be addressed through the methods o f segrega- tion analysis.
In this article we present the results o f a pedigree analysis o f more than 300 probands with classical epidemiologic and statistical tools. We explored the mixed model o f M o r t o n and McLean 6 as modified by Lalouel and Morton. 7
Definition o f AAA. A consensus definition o f AAA does not exist. Depending on authors, minimal infrarenal aortic diameter varies from 30 m m to 40 mm, and the minimal ratio infrarenal diameter/su- prarenal diameter varies from 1.5 : 1 to 2 : 1. We con- sidered a patient to be affected, if he or she had a dilatation o f the infraaortic aorta higher than 30 m m or a ratio infrarenal diameter/suprarenal diameter higher than 1.5 : 1.
JOURNAL OF VASCULAR SURGERY
Volume 21, Number 4 Verloes et al. 647
M A T E R I A L
Between 1986 and 1991, 520 patients (489 men and 31 women) were surgically treated in our department for asymptomatic AAA or symptomatic (ruptured or not) nonsyndromal AAA. We excluded from this series the patients with Marfan syndrome (all of them with thoraco-abdominal aneurysms) or with Ehlers-Danlos syndrome. No systematic ultra- sound screening was performed or even recom- mended for the siblings of the patients during the study period. We sent a written questionnaire ori- ented to personal and familial history to the 520 patients irrespective of any familial or surgical par- ticularity. The questionnaire included names, birth date, address or phone number, and history of vascular problem in parents, siblings, and children of the probands. The patients who filled out the questionnaire (or their spouses, for deceased probands) were interviewed by the phone, and relatives were then contacted in the same way to obtain the most accurate and best cross-validated pedigrees. Anamnestic data were compared with surgical files. Because only a fraction of the affected patients from our referring population were enrolled in this study, and because some families were ascertained more than once, the ascertainment mode was multiple and incomplete.
M E T H O D S
Descriptive statistics. Descriptive statistics were performed with classical methods. Comparison of proportions was done by the chi-squared test (with Yates' correction when sample was small), and comparison of means was done by unpaired t test.
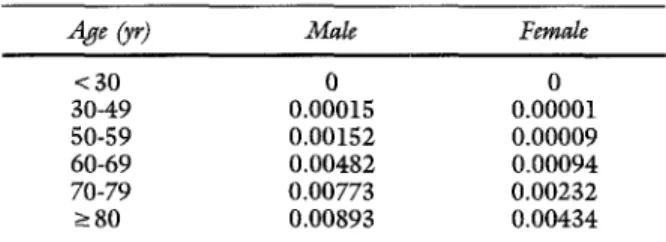
Relative risks. Relative risks were estimated by the ratio between the observed number and the expected number of AAA in the nonproband subjects for each age class, and confidence interval for the risk was computed by the method suggested by Everitt. 8 We used a slightly edited version of the cumulative age incidence published by Majumder et al.9; our version was based on the AAA survey of Bickerstaff et al.~ The modification was to set the incidence to 0 for men younger than 30 years (Table I).
Survival functions. Survival functions were com- puted by the classical Kaplan-Meier product limit. This method estimates the survival function from the continuous survival or failure times. It allows the computation of survival curves when a proportion of the studied patients "fails" (either because they are lost to follow-up or because the experiment stops before they are affected). Relatives alive at time of study or dead without evidence of AAA were
Table I. Relative risk of AAA for siblings of affected patients
Age (yr) Male Female
< 30 0 0 30-49 0.00015 0.00001 50-59 0.00152 0.00009 60-69 0.00482 0.00094 70-79 0.00773 0.00232 ~ 8 0 0.00893 0.00434
Cumulative incidence of AAA by sex (modified from Majumder et al.9).
considered to be censored, and relatives with AAA were considered to be noncensored. The "survival" function (in fact the survival time before a diagnosis of AAA) was estimated for the age at diagnosis. To compare survival cm-ves among several subgroups, we used both Gehan's generalized Wilcoxon test and Cox-Mantel test. Cox-Mantel test is usually consid- ered more powerful when samples come for expo- nential distributions, or when samples are small (<50); Gehan's test is used in the other circum- stances. Results were considered to be significant at p < 0.05. All statistics were performed with the Statistica for Windows v4.0 (Statsoft Inc., Tulsa, Okla.) package.
Segregation analysis. Segregation analysis is basically the comparison of the observed proportion of affected siblings and offspring with the expected proportion according to a particular genetic hy- pothesis. To assess evidence of a major gene effect in the presence of other sources of correlation (poly- gene, sociocultural factors, etc.), pedigrees were analyzed with the pointer strategy, which was devel- oped by Lalouel and Morton 7 as a tool for multigen- erational pedigrees analysis.
Coding of the pedigrees.
Pedigrees were partitioned in nuclear families. A nuclear f a m i l y - t h e unit of analysis-is made of the two parents and their children. Three types of nuclear families differing by the ascertainment mode were enrolled: families where the proband was a child (multiple incomplete selection of proband's siblings), families where the proband was one of the parents (complete selection of proband's children), and families where none of the affected patients was a proband (truncated selection of the siblings). In the latter case "point- ers" had to be added to the nuclear family. A pointer is an affected individual outside the nuclear family who contributed to the selection of this family. A maximum of three pointers is allowed, one to the father, one to the mother, and one to the children. Each pointer is defined by the relationship to the pointee (cousin, nephew, etc.).JOURNAL OF VASCULAR SURGERY
6 4 8 Verloes et al. April 1995
TaMe II. Descriptive statistics o f 315 nuclear families with respect to their family history, sex, and position (subjects younger than 30 years excluded)
Mean age of patients
with A A A +_ SD Mean age of unaffected Age at rupture +_ SD
n A A A (yr) patients +- SD ( y r ) Rupture (%) (yr)
1 5 9 7 3 5 7 6 6 . 4 _+ 7.8 6 8 . 1 + 1 3 . 4 5 2 (14.6) - 3 9 8 7 3 . 3 ± 7.6 7 1 . 6 -- 14.0 4 (50.0) 6 9 . 0 -+ 8.9 3 9 5 7 3 . 0 _+ 7 . 7 7 1 . 4 ± 1 2 . 7 3 (60.0) 70.8 + 8.0 I 0 4 6 8 6 4 . 1 _+ 7.9 ~ 6 4 . 8 ± 11.5 2 2 ( 3 2 . 4 ) t 6 5 . 4 _+ 6 . 6 ~ 4 4 0 -- 6 6 . 4 -+ 10.6 -- T o t a l F a m i l i a l s u b g r o u p Fathers M o t h e r s B r o t h e r s Sisters S p o r a d i c s u b g r o u p Fathers M o t h e r s B r o t h e r s Sisters 2 7 6 0 -- 6 9 . 9 -+ 14.2 - - 2 7 6 0 -- 7 4 . 4 -+ 1 2 . 7 - - 5 4 6 2 6 4 6 6 . 0 ± 7.3 ~ 6 3 . 8 -+- 11.5 23 ( 8 . 7 ) t 7 5 . 2 _+ 8 . 6 5 2 7 3 12 6 8 . 0 _+ 12.5 6 6 . 4 -+ 12.2 0 (0.0) - *p < 0.013. ?p < 0.001. Sp < 0.001.
Age statistics are given based on censoring age or age at death for unaffected subjects and age at diagnosis for patients with AAA.
Table I I I . Age distribution of AAA among brothers in several subgroups with calculation o f relative risk
Age (yr) 30-49 50-59 60-69 70-79 >80 Total
R e l a t i v e risk 0 . 0 0 5 / 3 3 9 4 . 3 15.1 4 . 6 4 . 0 17.9 ( 9 5 % co~fidence interval) 0 ( 0 - 4 2 5 ) (2.9-27.3) (0-17.9) (0-86.5) ( 1 2 . 8 - 2 2 . 9 )
The study was reiterated with multiplex pedigrees only. This selection, limited to familial cases, biased the sample. Accordingly a sampling correction was applied to families with two affected siblings by defining the proband as a pointer (with a "sibling" degree o f relationship), whereas his or her siblings were treated by truncated selection) °
Ascertainment probability.
Ascertainment o f ourpedigree was multiple (some pedigrees had more than one proband) and incomplete. Ascertainment probabilityp is the probability that an affected person in the population is a proband. In our sample p was 0.248 as calculated by a multiple ascertained sibling method and was 0.2 to 0.4 as estimated by the comparison o f the number o f annual AAA operated with the expected number o f cases in the Liege area; an incidence o f 4 per 100,000 per year was assumed. A value o f 0.25 was used for all computations.
Segregation model.
Segregation analysis was car-ried out with the personal computer version o f the computer program POINTER. 7,n This software implements the unified version o f the mixed model o f Morton and McLean 4 modified by Lalouel and Morton. 7 It incorporates the transmission frequen- cies studied by Elston and Stewart. 12
Analysis was limited to the mixed model. It
assumes that a phenotype (expressed as a discrete or continuous value) results from the independent and additive contributions o f three effects on a liability scale measured in SD units: a major monogenic biallelic effect, a multifactorial (genetic or acquired) transmissible effect, and a normally distributed re- sidual. Variation of the phenotype for each major genotype is assumed to be normally distributed. Its variance is the sum o f two components: a part resulting from the multifactorial component and an unexplained residual environmental variance. Note that heritability H represents the ratio o f the multi- factorial component o f the variance to the total phenotypic variance. Two parameters define the phenotype: the overall variance V (set to 1 for qualitative traits) and the overall mean u (set to 0 for qualitative traits). The polygenic component has two parameters, the polygenic heritability in children H and the parent-to-child heritability ratio Z. The parameter o f the monogenic component is formed by the frequency o f the pathologic allele at the major locus q, the distance, or displacement, between the two homozygous genotype means on the liability scale t, and the position d o f the heterozygous mean relative to the two homozygous means (equal to 0, 1, or 0.5 for a recessive, a dominant, or a codominant
JOURNAL OF VASCULAR SURGERY
Volume 21, Number 4 Vcrloes et al. 6 4 9
pathologic allele, respectively), and three transmis- sion probabilities %, %, and %, which are the probabilities for a subject o f genotype AA, Aa, or aa, respectively, to transmit the allele A. Under the mixed model, which assumes mendelian inheritance o f the major effect, % = 1, % = 0.5 and % = 0.
Computation and statistical tests. Parameters o f t h e model were estimated by P O I N T E R by maximiza- tion o f the likelihood o f the phenotypes o f the siblings conditional on the phenotype o f the parents and the pointers. Competing nested models were built by fixing some parameters. Nested models were compared by likelihood ratio test. The difference between - 2 In (likelihood) is asymptomatically distributed as a chi-squared analysis with the degrees o f freedom equal to the difference in the number o f estimated parameters. Nonncsted models were com- pared by the Akaike information criterion, which is two times the number o f estimated parameters - 2 In (likelihood). The best model has the smallest Akaike information criterion.
R E S U L T S
Questionnaire. We obtained answers for 324 patients (62% of our original sample), allowing a two- or three-generational pedigree to be drawn. Four questionnaires were filled out by the spouses of deceased patients. Those 324 probands (312 men and 12 women, sex ratio 26 : 1) came from 313 large pedigrees. The sex ratio o f our original sample o f 520 patients with AAA was 15.7: 1. The higher mean age (at operation) in the w o m e n in the original sample compared with that o f the men (74.07 _+ 9.04 vs 68.2 + 7.9 years) could be a reason for their reduced answer rate compared with that o f the men and a rise o f the sex ratio. Whenever possible relatives o f the proband (usually siblings), including all relatives suspected to have a vascular problem, were inter- viewed by phone. The questionnaire appeared to be a very reliable tool for familial enquiry, because only minor discrepancies were found by this cross- referencing procedure except for some confusion between correction o f AAA and aortofemoral bypass. Because o f the rarity o f aneurysms in young people, we excluded the relatives younger than 30 years from the study.
Descriptive statistics o f the sample. The total number o f patients with AAA in our 313 large pedigrees was 357 (340 men and 17 women, sex ratio 20 : 1). For 276 probands (264 men and 12 women, sex ratio 22:1) no positive familial history was elected, but 68 male patients belonged to 39 multi- plex pedigrees (12.5%). In the latter families 33 new
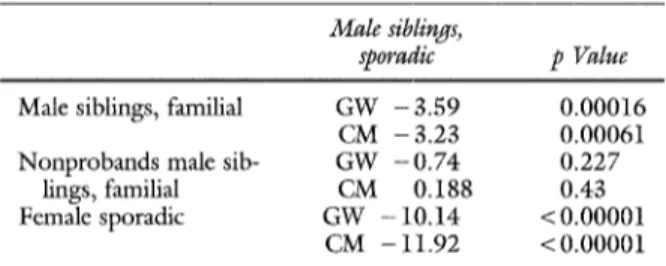
Table IV, A. Comparison o f survival curves for sex and familial history
Male siblings,
sporadic p Value
Male siblings, familial G W - 3 . 5 9 0.00016 CM - 3.23 0.00061 N o n p r o b a n d s male sib- G W - 0 . 7 4 0.227
lings, famifial CM 0.188 0.43 Female sporadic GW - 10.14 < 0.00001
CM - 11.92 < 0.00001
GW, Gehan's Generalized Wilcoxon test; CM, Cox Mantel statistics.
patients with AAA were found (28 men and 5 women), leading to a total o f 81 patients with familial AAA: 76 men and five w o m e n (sex ratio 15:1). Based on 313 large pedigrees we constructed 582 nuclear families including 2695 subjects aged 30 years or older. Those nuclear pedigrees were used for segregation analysis.
In the familial group all affected w o m e n were found among the parents o f the probands. A m o n g familial cases 23 pedigrees showed affected siblings and healthy parents, 10 showed an affected parent and an affected child, and six showed more complex structures (affected cousins, uncle, and nephew, etc.). The sex ratio was not significantly different among familial and sporadic subgroups (Yates corrected chi-squared analysis = 0.06,p = 0.80). In six fami- lies' patients with cerebral aneurysms were observed. Because aneurysms in the central nervous system are hard to dismiss among patients with "sudden death," we did not take those cases into account for the
analysis.
To avoid duplicate use o f subjects (a case being a parent in one nuclear pedigree and a child in another) the descriptive analysis o f the pedigree was limited to the 315 nuclear families in which the probands appeared as children. Those nuclear pedigrees in- cluded 630 parents and 967 children. The 1597 subjects were 965 men and 632 women. After one proband was removed, the sex ratio o f our sample was close to 1 : 1 (625 men and 615 women). Table II presents the numeric data regarding the patients with AAA and their unaffected relatives. They are partitioned in two groups: simplex and multiplex pedigrees. N o significant differences in age were seen between patients with and without AAA. The age at diagnosis was significantly different among affected brothers o f the two groups (t test = 2.50,p = 0.013) and also among affected fathers and affected children in the familial subgroup
JOURNAL OF VASCULAR SURGERY
650 Verloes et al. April 1995
(t test = 3.15, p = 0.002). The latter phenomenon was attributed either to a true "anticipation" of the diagnosis resulting from better medical awareness or to the use of more accurate and advanced methods for diagnosing AAA during the last 10 years. Another hypothesis was that nonrecording or bad diagnosis of some early cases (in the 1950s) led to an undue rise of the mean age at diagnosis. Finally, this phenom- enon could reflect the natural increase in age-specific prevalence of this condition.IS The rupture ratio was much higher in the familial subgroup than in the sporadic one (chi-squared analysis = 23, p < 0.0001). The mean rupture age was significantly different among affected brothers of the two groups (p < 0.001). In the familial group the proportion of rupture in men and women was not significantly different (chi-squared analysis = 0.71, p = 0.040). Relative risk by sex We used only the group of brothers for this analysis. Occurrence in the siblings (after removal of one proband per sibling relation- ship) was compared with the expected recurrence assuming random occurrence of AAA. Table III shows the relative risk by age groups. The overall relative risk was 17.9 (95% confidence interval 12.9 to 22.9). Relative risk appeared to be major in the 50 to 59-year-old subgroup and declined for elder subgroups but with very wide confidence intervals so that no definite conclusion could be drawn.
Survival curves The Kaplan-Meier method was used on several subpopulations of our sample. Fig. 1 shows the survivorship function obtained with the 967 siblings (including 357 patients with AAA) coming from our nuclear pedigrees. To compare effects of sex and of positive familial history, several subgroups of siblings were extracted: men of the multiplex pedigrees, male probands and non- probands of the multiplex pedigrees, male siblings of the sporadic pedigrees, and women of the sporadic pedigrees. To test whether the differences between the survivorship function reached statistical signifi- cance, we applied both Cox-Mantel and Gehan's Wilcoxon tests to the survivorship curves (Table IV, A). A highly significant difference was seen between men and women with sporadic AAA. Male siblings of multiplex pedigrees were affected signifi- cantly earlier than male siblings in the sporadic pedigrees. A significant difference was seen between the two groups of men; a more rapid decrease was seen in the survival curve of the familial subgroup (Gehan's Wilcoxon test: 3.6, p = 0.00016; Cox- Mantel test: 3.23, p = 0.00061) (Fig. 2). This difference was no longer observed when the sibs of sporadic cases were compared with the sibs of familial
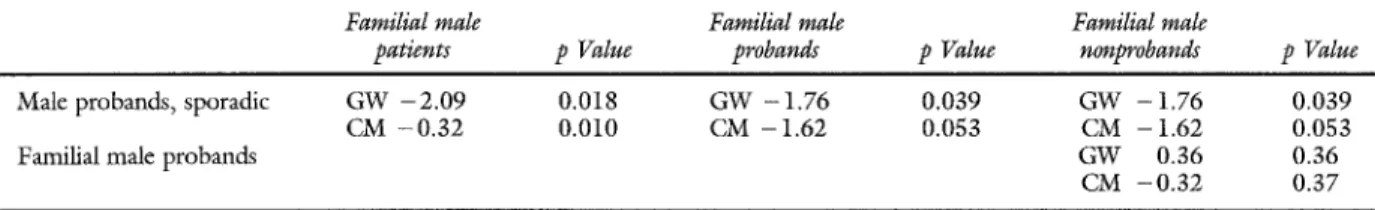
cases after the probands were removed. This finding indicates a possible bias to the earlier diagnosis of AAA in the familial cases. To further explore this phenomenon we compared male probands; a clear difference persists, although of borderline signifi- cance, when male probands of the multiplex pedi- grees are compared with male probands with spo- radic pedigrees. Finally, a significant difference ap- peared to exist between affected probands and affected nonprobands in the familial group (Table IV, B).
Segregation analysis. The 582 nuclear families were analyzed with POINTER. O f those families 101 belonged to the multiplex pedigrees. They were studied separately after recoding. Eight models (sporadic, multifactorial, polygenic, dominant, re- cessive, codominant, mixed, and mendelian) were evaluated.
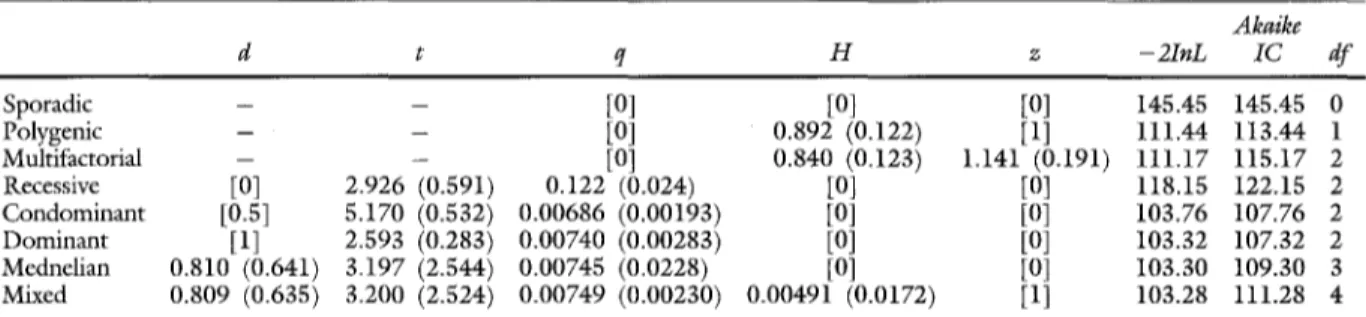
The results of the analysis of the full sample are given in Table V, A. The subset of pedigrees with a positive familial history is shown in Table V, B. Comparison of the models was done as follows. The sporadic model of Table V, A has a - 2InL parameter of 637.23 and the dominant model a -21nL of 503.25. The difference (133.98) as calculated by chi-squared analysis with 3 degrees of freedom was highly significant, indicating that the dominant model is significantly more likely. When the chi- squared test is not significant, the best of the two models is the model with the lesser free parameters (the most parsimonious one). When two models have the same degree of freedom (as in comparison of the dominant, recessive, or codominant models), the smaller Akaike criterion indicates the best model. Analysis of the full set shows that a sporadic model is strongly rejected. When a purely mendelian inheritance of AAA is assumed, the best fit is obtained with a dominant model even when the dominance parameter is set free. No significantly better fit is obtained for a mixed model when a combined effect of dominantly inherited mutation and a weak mul- tifactorial component is assumed, although this situation gives the best likelihood. The analysis of the familial subgroup shows almost similar results; the mixed model does not give a significantly better fit than a purely monogenic model with dominant inheritance (Table V, B).
The most parsimonious way to explain the segregation of AAA in our multiplex pedigrees is to suspect the action of a single dominant genc, for which the frequency of the morbid allele is 1 : 250 and in which the sex-dependent penetrance slowly in- creases with age to reach a maximum of 0.3 in women
JOURNAL OF VASCULAR SURGERY
Volume 21, Number 4 Verloes et al. 6 5 1
1 0.9 0.8 0.7 0.6 0.5- 0.4- 0.3- 0.2- 0.1 20 I I I I I I I 30 40 50 60 70 80 90
time before diagnosis (in years)
Fig. 1. Kaplan-Meier "survivorship" function for siblings (age at distribution) (n = 967;
affected = 343). lOO- o - 0 90 80 7 0 - P e r 6 0 - c e 5 0 - n t 4 0 - U n a 3 0 - f f 2 0 - e C t 1 0 - ~ multiplex pedigrees (n = 104) e - - sporadic pedigrees (n = 546) d
o 30 & 40 ' 4 ; 50 ' 55 ' 60 ' 65 ' 70 ' 75 ' 8'o & 90 '
time before diagnosis (in years)
Fig. 2. C o m p a r i s o n o f survival curves o f male siblings depending on their familial history.
older than 80 years and 0.4 in men older than 80 years. This low penetrance even in the elderly intuitively explains why AAAs are so often sporadic and why generations seem to be skipped in multiplex families. With the mixed model the frequency of the gene is almost similar, and the heritability is only 2%. Note that the heritabifities obtained
with multifactorial models (0.7 and 0.79) are similar to the heritability computed by Powell and Green- halgh. 14
D I S C U S S I O N
Familial aspects. Since the seminal report by Clifton s on three siblings with AAA was published,
J O U R N A L O F V A S C U L A R S U R G E R Y
6 5 2 Verloes et aL April 1995
Table IV, B. Comparison of survival curves in three subpopulations coexisting exclusively o f AAA
Familial male Familial male Familial male
patients p Value probands p Value nonprobands p Value
M a l e p r o b a n d s , s p o r a d i c G W - 2 . 0 9 0 . 0 1 8 G W - 1 . 7 6 0 . 0 3 9 G W - 1 . 7 6 0 . 0 3 9 C M - 0 . 3 2 0 . 0 1 0 C M - 1 . 6 2 0 . 0 5 3 C M - 1 . 6 2 0 . 0 5 3 F a m i l i a l m a l e p r o b a n d s G W 0 . 3 6 0 . 3 6
C M - 0 . 3 2 0 . 3 7
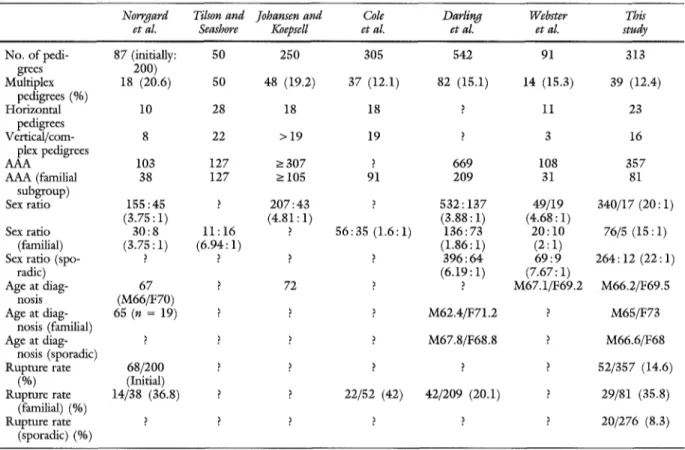
the familial aspect o f AAA was addressed by a few authors. Norrgard et al.15 retrospectively studied 87 pedigrees out o f an initial series o f 200 cases. Cole et al.,16 in a retrospective study, gave data on 305 pedigrees. Darling et al. 17 presented a prospective study o f 542 cases including 84 familial observations (15.1%). Johansen and Koepsel118 gave data on 250 pedigrees. Webster et al.19 thoroughly studied 91 pedigrees both on a descriptive basis and on a more formal genetic basis (Majumder et al.9). We can add to these reports the study o f 50 multiplex pedigrees by Tilson and Seashore. 2° Table VI attempts to compare our series with the six previous ones. Our percentage o f familial cases appears similar to those of other published series. Norrgard et al} s noted the coincidence o f cerebral and aortic aneurysms in the same family. Whether this coincidence was fortuitous or whether it indicates a more generalized predispo- sition to arterial dilatation was left to debate. In our series at least 2% o f our probands had a relative with central nervous system aneurysm, but no patient had both disorders. This point obviously requires further experimentation.
Webster et al.2~ found 16.2% o f familial AAA history based on anamnesis in 43 consecutive patients with AAA. After prospective ultrasonography screen- ing o f the relatives, the number o f familial cases was raised to 27.9%. In male siblings o f patients with AAA, Bengtsson et al. zz found 29% o f AAA after ultrasonography screening.
Genetic aspects. Genetic aspects o f AAA have been the subject o f very few studies. Norrgard et al.15 presented 19 patients (18% o f their sample) with familial AAA but did not discuss etiology. Tilson and Seashore 2° showed 50 families including three pairs o f identical twins. Those families were collected by various teams, and no data were given on the mode o f ascertainment or on the isolated AAA from the same population. Twenty-nine o f 50 were single- generational, 18 showed simple "vertical" transmis- sion, and three were "complex." In an empiric ap- proach o f the results they favored a frequent X-linked
dominant form and a less common auto-
somal/dominant or a multifactorial model. They ex-
cluded recessive inheritance because o f the high fre- quency o f parent-to-sibling transmission and ques- tioned the shift o f the sex ratio. Assuming that AAA is a multifactorial disease, Powell and Greenhalgh 14 cal- culated for a series o f 60 patients (25 with positive family history) a 70% heritability by the method of Falconer. 23 In their set, eleven (8.6%) of 128 parents and 14 (7.3%) o f 192 siblings o f the probands had AAA. Separate heritabilities were not computed for those two subsets. Recently Majumder et al. 9 made an extensive segregation analysis based on 91 probands including 13 familial cases (10 single- generational). The mode o f selection of the families was not reported, but systematic screening was not used. They concluded that susceptibility to AAA can be accounted for by the presence o f a major gene, that it does not require a multifactorial component, and that this gene behaves as a recessive factor.
Our results, like those o f Majumder e t al. 9 indicate that the importance o f the genetic factor in the pathogenesis o f AAA compared with the multi- factorial or environmental effects. Nevertheless our final conclusions are in disagreement. Several factors may explain this discrepancy. Our population differs by the sex ratio. The ascertainment o f our sample is quite different. The mode o f selection of Majumder et al.'s patients 9 was not clear. The number of familial cases was very small, and their sample could have included, by chance, fewer pedigrees with subjects affected in two generations. Moreover their methods were also different. The definition o f AAA was an aortic diameter greater than 5 cm; we used a less stringent definition. Majumder ct al.9 counted as "affected" only patients with operated AAA and used age at operation for analysis. They rejected patients who were discovered by systematic screening, whereas we considered all patients with known AAA, whatever the reason for their discovery (although we had no policy o f systematic screening before 1992). It should be noted that the patients with AAA included in the study by Bickerstaffet al. 1 to compute incidences were gathered from all sources including diagnosis "by chance" and necroscopic discovery of patients not thought to have AAA. Although it is
JOURNAL OF VASCULAR SURGERY
Volume 21, Number 4 Verloes e t al. 6 5 3
Table V, A. Segregation analysis o f the flail sample
A k a i k e d t q H z - 2 I n L I C d f Sporadic - - [0] [0] [0] 637.23 0 Polygenic - - [0] 0.700 (0.045) [1] 518.16 520.16 1 Multifactorial - - [0] 0.796 (0.0488) 0.360 (0.117) 509.97 513.97 2 Recessive [0] 2.813 (0.179) 0.0751 (0.0103) [0] [I] 512.53 516.53 2 C o n d o m i n a n t [0.5] 4.085 (0.470) 0,0361 (0.0098) [0] [1] 509.03 513.03 2 D o m i n a n t [1] 2.255 (0.123) 0.00424 (0.00134) [0] [1] 503.25 507.25 2 Mendelian 0.972 (0.7951) 2.320 (1806) 0.00425 (0.00134) [0] [1] 503.25 509.25 3 Mixed < 1 > 2.213 (0.124) 0.00458 (0.00149) 0.0169 (0.0229) [1] 501.38 506.38 3 Parameter estimation with their _+ SD and likelihood of several segregation models.
Table V, B. Segregation analysis o f the subset o f pedigrees with a positive family history
A k a i k e
d t q H z - 2 I n L I C d f
Sporadic - - [0] [0] [0] 145.45 145.45 0
Polygenic - - [0] 0.892 (0.122) [1] I l l . 4 4 113.44 1
Multifactorial -- - [0] 0.840 (0.123) 1.14i (0.I91) 111.17 115.17 2
Recessive [0] 2.926 (0.591) 0.122 (0.024) [0] [0] 118.15 1 2 2 . i 5 2
C o n d o m i n a n t [0.5] 5.170 (0.532) 0.00686 (0.00193) [0] [0] I03.76 107.76 2 D o m i n a n t [1] 2.593 (0.283) 0.00740 (0.00283) [0] [0] 103.32 107.32 2 Mednelian 0.810 (0.64i) 3.197 (2.544) 0.00745 (0.0228) [0] [0] 103.30 109.30 3 Mixed 0.809 (0.635) 3.200 (2.524) 0.00749 (0.00230) 0.00491 (0.0172) [1] 103.28 111.28 4 Parameter estimation with their _+ SD and likelihood of several segregation models. Numbers in brackets are fixed parameters.
difficult to ascertain whether those differences ac- count for the diverging conclusions, they at least indicate that our studies are not totally comparable in their methods.
Our sample shows a sex ratio much higher than that o f other reported series. We have no definite explanation for this phenomenon. An excess o f men could come from our ascertainment o f cases; male subjects are more exposed to coronary problems or atheromatosis and so have a much greater chance to be diagnosed
"by
chance." The sex ratio o f AAA varies with the age group; the ratio is higher in younger persons. I f the population attending our hospital has a lower mean age compared with other institutions, we could expect a higher sex ratio. Finally, we cannot exclude genetic, sociocultural, or environmental effects, although these are not obvious.Familial cases show a significantly earlier onset as observed by Darling et al.17 Higher rupture rate also characterizes our familial sample. Various explana- tions for earlier diagnosis such as familial awareness o f the risk may be hypothesized. But because penctrance o f the gene appears age-dependent, we may suspect that intrinsic factors affecting penetrance may influence expressivity, for example, more patho- genic mutations o f the putative AAA gene are more
likely to be expressed earlier in several relatives and to lead them more rapidly to an aneurysmal rupture. Kontusaari et al.24 showed two single-base mu- tations in the type III procollagen gene in two families with AAA. In the first multigenerational family the mutation led to the replacement o f glycine 619 by arginine. In the second two-generational family, which presented with AAA and easy bruis- ability, the single-base mutation G - > A in intron 20 was shown to induce aberrant splicing o f the m R N A that reduces the synthesis o f the cd(III) chain. The authors showed that the clinical spectrum in their families with AAA extended from isolated AAA to classical Ehlers-Danlos type IV disease (with prominent cutaneous findings). More interestingly they showed that Ehlers-Danlos type I V and isolated AAA were observed in families with type III procol- lagen mutations, suggesting that a collagen defect could account for a fraction o f AAA, although no precise estimation o f this fraction can be given at this time. This finding also gives additional support to the observations o f Menashi et al.zs on low content o f type III collagen in a group o f patients with familial AAA. In the two families described by Konmsaari et al.,26 the mutation behaved as a dominant trait. This finding appears in contradiction with Majumder et al.'s 9 conclusion on the recessivity o f AAA but rein-
JOURNAL OF VASCULAR SURGERY
6 5 4 Verloes et al. April 199S
Table VI. Comparison of different data of families observed in this study and in six preview studies
Norrgard Tilson and Johansen and Cole Darling Webster This
et aL Seashore Koepsell et al. et al. et al. study
No. of pedi- 87 (initially: 50 250 305 542 91 313
grees 200) Multiplex 18 (20.6) 50 48 (19.2) 37 (12.1) 82 (15.1) 14 (15.3) 39 (12.4) pedigrees (%) Horizontal 10 28 18 18 ? 11 23 pedigrees Vertical/corn- 8 22 > 19 19 ? 3 16 plex pedigrees AAA 103 127 > 307 ? 669 108 357 AAA (familial 38 127 -> 105 91 209 31 81 subgroup) Sex ratio 155:45 ? 207:43 ? 532 : 137 49/19 340/17 (20 : 1) (3.75:1) (4.81:1) (3.88:1) (4.68:1) Sex ratio 30:8 11:16 ? 56:35 (1.6:1) 136:73 2 0 : 1 0 76/5 (15:1) (familial) (3.75 : 1) (6.94: 1) (1.86:1) (2 : 1)
Sex ratio (spo- ? ? ? ? 396:64 6 9 : 9 264:12 (22:1)
radic) (6.19 : 1) (7.67:1) Age at diag- 67 ? 72 ? ? M67.1/F69.2 M66.2/F69.5 nosis (M66/F70) Age at diag- 65 (n = 19) ? ? ? M62.4/F71.2 ? M65/F73 nosis (familial) Age at diag- ? ? ? ? M67.8/F68.8 ? M66.6/F68 nosis (sporadic) Rupture rate 68/200 ? ? ? ? ? 52/357 (14.6) (%) (Initial) Rupture rate 14/38 (36.8) ? ? 22/52 (42) 42/209 (20.1) ? 29/81 (35.8) (familial) (%) Rupture rate ? ? ? ? ? ? 20/276 (8.3) (sporadic) (%) A//, Male; F, female.
forces our own observations (although we have not proved that our cases of AAA have an abnormality of collagen type III).
AAA is a complex disease, and we cannot expect to find a single physiopathologic explanation for all cases. Our data at least suggest that a genetic factor could be of major importance in the onset of AAA. This factor has been shown to be an alteration of one of the collagen III genes in some families. Whether the major gene effect always results from one abnormal collagen gcne or more likely from several dominant genes is still to be demonstrated. Further investigation on selected large families with AAA appears warranted.
AAA is a complex disorder with probably mul- tiple pathogenetic pathways. In this article we presented a familial study of 313 AAA pedigrees selected without the use of systematic screening. Our series illustrates the importance of familial factors in AAA and raises the hypothesis, sustained by a familial genetic analysis, that AAA could be a mainly genetic disease. The major determinant factor in the appear- ance of AAA could be an inborn defect possibly of
collagen type III or of other components of the connective tissue matrix. This defect behaves as a dominant trait with low age-dependent penetrance. Differences in the severity of the complications of AAA between familial and sporadic cases dearly appear. These differences could be related to the variable penetrance of individual mutations.
Systematic screening of AAA is an emerging issue. A common question is whether to apply AAA screening to a general population or to an "at risk" subgroup. We strongly recommend ultrasound screening of first-degree relatives aged 50 years and older, a method that now permits simple, noninva- sive, and accurate detection and follow-up of AAA. Recently in our retrospective study of the determi- nation of the expansion rate and incidence of rupture of abdominal aortic aneurysms, we found 12% of rupture in aneurysms smaller than 44 mm and 22% when the diameter exceeded 50 m m S When the higher incidence of rupture in patients with positive family history and the risk of rupture even for small AAA (less than 50 mm) are considered, a more aggressive therapeutic attitude is mandatory. Ratio-
JOURNAL OF VASCULAR SURGERY
Volume 21, Number 4 Verloes et al. 655
nale for a national screening program has been recently given by Law et al.,4 who recommended one ultrasonography detection in men aged 60 years and older. As long as cost-effectiveness of those general policies has not been demonstrated, a reduced screening policy could be recommended at least for patients with other peripheral artery aneurysms and for first-degree relatives of patients with an AAA.
REFERENCES
I. Bickerstaff LK, Hollier LH, Van Peenen HJ, Melton LI, Pairolero PC, Cherry KJ. Abdominal aortic aneurysm: the changing natural history. J VAsC SURG 1984;I:6-12. 2. Melton LI, Bickerstaff LK, Hollier LH, et al. Changing
incidence of abdominal aortic aneurysms: a population-based study. Am J Epidemiol 1984;120:379-86.
3. Scott RAP, Ashton HA. Abdominal aortic aueurysm screen- ing: acceptance rates, false negative rates and age-related incidence in 2116 patients [Abstract]. B r J Surg 1993 ;80: 518. 4. Law MR, Morris J, Wald NJ. Screening for abdominal aortic
aneurysms. J Med Screening 1994; 1:110-6.
5. Clifton MA. Familial abdominal aortic aneurysms. Br J Surg 1977;64:765-6.
6. Morton NE, McLean CI. Analysis of family resemblance. Part III. Complex segregation of quantitative traits. Am J Hum Genet 1974;26:489-503.
7. Lalouel JM, Morton NE. Complex segregation analysis with pointers. Hum Hered I981;31:312-2I.
8. Everitt BS. Statistical methods for medical investigation. New York: Oxford University Press, 1988.
9. Majumder PP, St Jean PL, Ferrell RE, Webster MW, Steed DL. On the inheritance of abdominal aortic aneurysm. Am J Hum Genet 1991;48:164-70.
10. Lalouel JM, Rao DC, Morton NE, Elston RC. A unified model for complex segregation analysis. Am J Hum Genet 1983;35:816-26.
11. Morton NE, Lalouel JM. Segregation analysis of familial data. In: Morton NE, Rao DC, Lalouel JM, eds. Methods in genetic epidemiology. Basel: Karger, 1983:62-102.
i2. Elston RC, Stewart J. A general model for the genetic analysis of pedigree data. Hum Hered 1974;21:523-42.
13. Fowkes FGR, McIntyre CCA, Ruckey CV. Increasing inci- dence of aortic aneurysms in England and Wales. BMJ 1983;298:33-5.
I4. Powel IT, Greenhalgh RM. Multifactorial inheritance of abdominal aortic aneurysm. Eur J Vasc Surg 1987;1:29-3i.
15. Norrgard O, Rais O, .~mgquist KA. Familial occurrence of abdominal aortic aneurysms. Surgery 1984;95:650-6. 16. Cole CW, Barber GG, Bouchard AG, Roberge C, Waddell
WG, Wellington JL. Abdominal aortic aneurysm: conse- quences of a positive family history. Can J Surg 1989;32: 117-20.
17. Darling RC III, Brewster DC, Darling RC, et al. Are familial abdominal aortic aneurysms different? J VASC SURG 1989; 10:39-43.
18. Johansen K, Koepsell T. Familial tendency for abdominal aortic aneurysms. JAMA 1986;256:1934-6.
19. Webster MW, St Jean PL, Steed DL, Ferrell RE, Majumder PP. Abdominal aortic aneurysm: result of a family study. J VASC SURG 1991;13:366-72.
20. Tilson MD, Seashore MR. Fifty families with abdominal aortic aneurysm in two or more first-order relatives. Am J Surg 1984;147:551-3.
21. Webster MW, Ferrell RE, St Jean PL, Majumder PP, Fogel SR, Steed DL. Ultrasound screening of first-degree relatives of patients with an abdominal aortic aneurysm. J VASC SFRG 1991;13:9-14.
22. Bengtsson H, Norrgard O, ~mgquist KA, Ekberg O, Oberg L, Bergqvist D. Ultrasonographic screening of the abdominal aorta among siblings of patients with abdominal aortic aneurysms. Br J Surg 1989;76:589-91.
23. Falconer DS. Inheritance of liability to certain diseases estimated from the. incidence among relatives. Ann Hum Genet 1965;29:51-76.
24. Konmsaari S, Tromp G, Kulvanierni H, Ladda ILL, Prockop DJ. Inheritance ofa RNA splicing mutation (G +I/vs2°) in the type III procollagen gene (COL3A1) in a family having aortic aneurysms and easy bnfisability: phenotypic overlap between familial arterial aneurysms and Ehlers-Danlos syndrome type IV. Am J Hum Genet 1990;47:1].2-20.
25. Menashi S, Campa JS, Greenhalgh RM, Powel JT. Collagen in abdominal aortic aneurysm: typing, content, and degrada- tion. J VASC SURG 1987;6:578-82.
26. Kontusaari S, Tromp G, Kulvaniemi H, Romanic AM, Prockop DJ. A mutation in the gene for type III procollagen (col 3A1) in a family with aortic aneurysms. J Clin Invest 1990;86:1465-73.
27. Limet R, Sakalihasan N, Albert A. Determination of the expansion rate and incidence of rupture of abdominal aortic aneurysms. J VAsc SUi~G 1991;14:540-8.