ESSAYS ON BIASED NEWSVENDOR ORDERING BEHAVIOR BASED ON LABORATORY EXPERIMENTS
JAIME ANDRÉS CASTAÑEDA ACEVEDO
Università della Svizzera italiana
Facoltà di scienze economiche, Institute of Management Lugano
ESSAYS ON BIASED NEWSVENDOR ORDERING BEHAVIOR BASED ON LABORATORY EXPERIMENTS
JAIME ANDRÉS CASTAÑEDA ACEVEDO
Dissertation submitted in partial fulfillment of the requirements for the degree Dottore in Scienze economiche
Supervised by Prof. Paulo Gonçalves, Ph.D.
Università della Svizzera italiana
Facoltà di scienze economiche, Institute of Management Lugano
ABSTRACT
A behavioral approach studying inventory ordering decisions in Newsvendor settings dates back to the early 2000s. Two systematic biased behavioral patterns have been identified since: a pull-to-center effect, or the tendency to order too many costly (low-safety stock) products and too few cheap (high-safety stock) products relative to the optimal stock level; and a demand chasing bias, or the tendency to adjust inventory ordering quantities towards prior demand realizations. Through three essays, this dissertation extends behavioral research in Newsvendor settings by exploring decision making behavior in structurally similar decisions and testing two different debiasing strategies. Essay 1 develops the Innovator model, an analog to the Newsvendor model for New Product Development projects, and explores project complexity level and resource allocation decision biases. This study finds that project complexity level and resource allocation decision biases resemble Newsvendor biases. Essay 2 proposes a debiasing mechanism that builds on cognitive dissonance theory to stress differences in items’ importance and safety stock levels in joint decisions as a way to debias
Newsvendor ordering decisions for critical items. This study finds that joint consonant decision frameworks reduce to some extent biased Newsvendor ordering behavior, whereas joint dissonant decision frameworks increase it. Finally, essay 3 tests a Newsvendor extension that backlogs unmet demand and compares it to the traditional Newsvendor model that loses unmet demand. This study finds that backorders help achieving better inventory ordering decision making in terms of both profits and product availability relative to lost sales.
SOMMARIO
Una prospettiva comportamentale per lo studio di decisioni d’inventario in strutture Newsvendor risale ai primi anni del 2000. Due comportamenti distorti sistematici sono stati identificati: l’effetto
pull-to-center, ovvero la tendenza a ordinare un numero eccessivo di prodotti costosi (low-safety stock) e
troppo pochi di prodotti economici (high-safety stock) rispetto al livello d’inventario ottimale; e l’errore demand chasing, ovvero la tendenza ad aggiustare le decisioni d’inventario in base alla domanda dei periodi precedenti. In tre saggi, questa tesi amplia la letteratura comportamentale su strutture Newsvendor, esplorando il processo decisionale in strutture di decisioni simili e testando due strategie diverse di correzione degli errori. Il primo saggio sviluppa l’Innovator model, un analogo del
Newsvendor model per progetti di sviluppo di nuovi prodotti, ed esplora errori nelle decisioni sul
livello di complessità di un progetto e sull’allocazione delle risorse. Questo studio rivela che questi errori rispecchiano le distorsioni Newsvendor. Il secondo saggio propone un meccanismo di correzione degli errori che si basa sulla teoria della dissonanza cognitiva e che evidenzia differenze
nell’importanza e nel livello di safety stock degli oggetti per decisioni congiunte d’acquisto. In questo modo possono essere ridotti gli errori Newsvendor per decisioni d’acquisto critiche. Questo studio rivela che decisioni comuni concordanti riducono in qualche misura il comportamento d’inventario
Newsvendor distorto, mentre decisioni comuni dissonanti lo aumentano. In fine, il terzo saggio esplora
un’estensione del Newsvendor model che considera la domanda non servita accumulata degli ordini arretrati e la confronta con il Newsvendor model tradizionale che invece non considera la domanda non servita. Questo studio rivela che gli ordini arretrati aiutano a prendere migliori decisioni d’inventario sia in termini di profitti sia di disponibilità del prodotto rispetto al Newsvendor model tradizionale.
NOTES ON SOFTWARE AND DOCUMENTATION
The experimental Newsvendor settings in chapters 2 and 3 were programmed and run by the author in Forio Business Simulations (www.forio.com). The experimental Newsvendor settings in chapter 4 were programmed and run by the author in z-Tree (Fischbacher, 2007). The data coming from the experiments were compiled in Microsoft Office Excel version 2007.
Bootstrap confidence intervals were computed by the author in Stata/MP version 11.2. Wilcoxon Rank-Sum and Signed-Rank tests were done manually by the author in Microsoft Excel version 2007. Regression models were run by the author in Stata/MP version 11.2.
Forio and z-Tree source codes and data files are available upon request for documentation purposes.
ACKNOWLEDGEMENTS
First of all, I want to express my gratitude to Paulo, a wonderful advisor and an even more wonderful human being. Thanks for having given me the opportunity to come to Lugano and work under your supervision. Many thanks also for all the support you gave me and the time we spent together developing ideas. Your brightness and clarity of thinking are things I aspire to have. Thanks also for all the confidence you placed on me. Last but not least, thanks for having treated me with such kindness and respect. They way you approach and treat people is remarkable and is something I strive for.
I want to thank Nitin for all his support in developing some of the ideas expressed in this dissertation. Many thanks also to Karen for her sharp comments on how to improve further the dissertation. I want to thank also both Paulo and Nitin for their advices to develop further my
academic career. I also want to express my gratitude to all IMA Faculty. All the training and support I received from you helped me sharpening my intellectual skills. Many thanks also to Sebastián, Mohammad and Gloria for all their support in running some of the experiments reported in this dissertation. Finally, thanks also to all the administrative staff at USI who have helped me.
IMA is a great workplace. I want to thank all the colleagues and friends I made here. Min, Soorjith, Karthik, Pooya, Chanchal, Marco, Martina, Sayed, Alessio, Mohammad, Zoltan, Rebeka, Margarita, Sebastián, Manos, Ivona, Marco (the new one), and Stefania (not IMA, but pretty close)… Thank you for all the shared words, the support you all gave me and your kindness whenever I requested your help or advice.
I want to thank also Santiago and Claire for accommodating me when I first got here. Without your help I do not know what would have become of my LugAno experience.
LugAno… I made really good friends here whom I will never forget. I want to thank all of you for having given me the opportunity to share with you and made my last four years truly rewarding. Many thanks also for all the fun we had together here at Lugano and all over Switzerland and Europe. Those are times I will carry always with me.
©tagxedo.com
Last, but most importantly, I want to expresses my most sincere and deepest gratitude to my family and La Tatis. You took and stood the worst part of my four years here. I would not be here if it were not for my family and all the support and confidence they have given me in pursuing an academic career. You were and are always there for me. And to La Tatis… What can I say? Almost 9000 km apart and 6-7 hours time difference were things you dealt with much better than I did. I thank you for your patience and love. You taught me a lot about character these four years and made me a better person even though sometimes it does not seem so. I am deeply indebted to you mi Ñatica. I love you.
TABLE OF CONTENTS
CHAPTER 1: INTRODUCTION 1
1.1. OVERVIEW 1
1.2. STRUCTURE OF THE DISSERTATION 2
CHAPTER 2: AMBITIOUS DESIGN GOALS AND STRETCHED RESOURCE
ALLOCATION: INVESTIGATION OF MANAGERIAL BIASES UNDER INNOVATION
UNCERTAINTY 5
2.1. INTRODUCTION 6
2.2. INNOVATION UNCERTAINTY 8
2.3. THE INNOVATOR MODEL 9
2.4. RESEARCH HYPOTHESIS AND LABORATORY EXPERIMENT 12
2.4.1. Innovators behavior 12
2.4.2. Experimental design 14
2.4.3. Experimental procedure 15
2.5. RESULTS 16
2.5.1. Pull-to-center effect 16
2.5.2. Threshold chasing bias 20
2.6. DISCUSSION 23
CHAPTER 3: IMPACT OF JOINT DECISIONS AND COGNITIVE DISSONANCE ON
PREPOSITIONING (NEWSVENDOR) DECISIONS 29
3.1. INTRODUCTION 30
3.2. THEORY AND HYPOTHESES DEVELOPMENT 33
3.2.1. Prepositioning of emergency supplies as a Newsvendor problem 33
3.2.2. Newsvendor’s pull-to-center effect 34
3.2.3. Joint decision making as a debiasing mechanism 36
3.3. LABORATORY EXPERIMENT 41 3.3.1. Basic design 41 3.3.2. Notation 42 3.3.3. Treatments 42 3.3.4. Experimental procedure 43 3.4. RESULTS 45
3.4.1. Newsvendor biases in inventory prepositioning decisions 45
3.4.2. Baseline results: separate decision treatments 47
3.4.4. Cognitive consonant joint treatment’s results 52
3.4.5. Summary of results 54
3.5. DISCUSSION 55
CHAPTER 4: INVENTORY ORDERING DECISIONS IN A SINGLE ECHELON: THE
EFFECT OF BACKORDERS 63
4.1. INTRODUCTION 63
4.2. NEWSVENDOR PROBLEM WITH BACKORDERS 67
4.2.1. Normative implications 67 4.2.2. Behavioral implications 70 4.3. LABORATORY EXPERIMENT 72 4.3.1. Experimental design 73 4.3.2. Experimental procedure 74 4.4. RESULTS 76 4.4.1. Normative hypotheses 76 4.4.2. Behavioral hypotheses 79
4.4.3. Robustness check to outliers 83
4.5. DISCUSSION 84
CHAPTER 5: CONCLUSIONS 91
5.1. CONTRIBUTIONS 91
5.2. LIMITATIONS AND FUTURE WORK 92
LIST OF FIGURES
Figure 2.1. Average complexity level and resource allocation behaviors 17 Figure 2.2. Average complexity level and resource allocation adjustment behaviors
period-to-period 21
Figure A2.2.1. Sample of game screen 28
Figure 3.1. Average inventory prepositioning behaviors in separate decision treatments 49 Figure 3.2. Average inventory prepositioning behaviors in dissonance-related treatments 51 Figure 3.3. Average inventory prepositioning behaviors in consonance-related treatments 53
Figure A3.2.1. Sample of game screen 60
Figure 4.1. Optimality behavior to increasing values of the purchasing cost c 68 Figure 4.2. 95% bootstrap confidence intervals of average inventory ordering behaviors 77 Figure 4.3. 95% bootstrap confidence intervals of average order adjustment behaviors after a
shortage 80
LIST OF TABLES
Table 2.1. Parallel between the Newsvendor and the Innovator models 12
Table 2.2. Treatments, notation, and number of participants 16
Table 2.3. 95% bootstrap confidence intervals of average complexity level and resource
allocation behaviors 18
Table 2.4. Fixed-effects panel regression of learning to avoid the pull-to-center effect 20
Table 2.5. Wilcoxon Rank-Sum tests of threshold chasing bias 22
Table 2.6. Fixed-effects panel regression of learning to avoid the threshold chasing bias 23
Table 3.1. Treatments, notation, and number of participants 44
Table 3.2. 95% bootstrap confidence intervals of average inventory prepositioning behaviors 47
Table 3.3. Summary of hypothesis tests 55
Table 4.1. Treatments, notation, and number of participants 75
Table 4.2. Regression of larger inventory system effect in low-safety stock conditions 78 Table 4.3. Regression of larger inventory system shortage effect in low-safety stock
conditions 81
LIST OF APPENDICES
Appendix 2.1. Sample of written instructions (CH) 26
Appendix 2.2. Sample of game screen (CH) 28
Appendix 3.1. Sample of written instructions (joint decision treatment) 58
Appendix 3.2. Sample of game screen (T6) 60
Appendix 3.3. Statistical tests 60
Appendix 4.1. Sample of written instructions (BH) 87
CHAPTER 1
INTRODUCTION
1.1. OVERVIEW
The Newsvendor model is an inventory ordering decision making model under demand uncertainty. The model dates back to Edgeworth (1888), who considered the amount of cash to keep at a bank as a product whose inventory should be controlled to satisfy random cash withdrawals from depositors, and to Arrow et al. (1951), who incorporated demand uncertainty to the study of inventory control
policies. The model captures the problem a manager faces when she has to order a product that has to be sold during a season without knowing the product’s demand for that season. It assumes that the item perishes before the next season and that unmet demand is lost. Accordingly, when the manager orders more than the demand, she must dispose of the remaining stock at a loss. And when the manager orders less than the demand, she loses sales opportunities. It is well-known that the solution of the problem is a base stock or order-up-to policy that balances the costs of ordering too little against the costs of ordering too much (Cachon and Terwiesch, 2009).
Despite the model’s long history, a behavioral approach to study Newsvendor ordering decisions is fairly more recent, dating back to Schweitzer and Cachon (2000), who studied how individuals make Newsvendor ordering decisions in a controlled laboratory (lab) experiment. Schweitzer and Cachon’s (2000) seminal study found that individuals make biased inventory ordering decisions. In particular, they ordered less than the optimum when the costs associated with the ordered item and the demand process called for larger orders (high-safety stock or high-profit setting), whereas they ordered more than the optimum when the costs associated with the ordered item and the demand process called for smaller orders (low-safety stock or low-profit setting); this bias is also known as the pull-to-center effect. In addition, the authors also found that when individuals did change inventory ordering decisions period to period, the changes tended to be in direction of the prior demand realization; this bias is also known as demand chasing.
The pull-to-center effect and demand chasing have been replicated in subsequent Newsvendor experiments. The pull-to-center effect has been proved robust to extended experience (Benzion et al., 2010; Bolton et al., 2012), sharpened payoff differentials (Bolton and Katok, 2008; Bostian et al., 2008; Feng et al., 2011), and improved outcome feedback (Bostian et al., 2008; Lurie and
Swaminathan, 2009), among others. Demand chasing has been proved robust to demand distribution (Benzion et al., 2008), non-operations frames (Kremer et al., 2010), and financial risk-taking behaviors (de Véricourt et al., 2013), among others.
This dissertation contributes to the literature on Behavioral Operations Management (Bendoly et
al., 2006; Bendoly et al., 2010; Gino and Pisano, 2008; Loch and Wu, 2007) by looking at biased
Newsvendor ordering behavior from three perspectives. First, it seeks to understand if insights from the Newsvendor model and biased Newsvendor ordering behavior can be translated to structurally similar decisions, in particular to complexity level (or scope) and resource allocation decisions in New Product Development (NPD) projects under innovation uncertainty. Second, it examines if a new debiasing mechanism that builds on Festinger’s (1957) cognitive dissonance theory can effectively debias and strengthen the pull-to-center effect. Finally, it builds on an existing extension of the Newsvendor model to the case of backorders (Bulinskaya, 1964) and examines whether backlogging unmet demand instead of losing sales can effectively debias inventory ordering behavior.
1.2. STRUCTURE OF THE DISSERTATION
This dissertation is composed of three essays that explore biased decision making behavior in Newsvendor settings. Each essay was written to eventually be sent for publication. Hence, there is some repetition of the Newsvendor setting and some literature review in each essay. However, each essay addresses a different aspect of biased Newsvendor decision making behavior. The ensuing three chapters present the three essays with their corresponding findings. Lastly, a final chapter presents concluding remarks and discusses limitations and opportunities for future research. A brief description of the three essays and their findings is given below.
In the first essay (chapter 2), we develop a stylized model of NPD decision making under innovation uncertainty. Assuming a single stage-gate innovation pipeline under a single uncertainty source, the developed model is analogous to the Newsvendor model. We operationalize the model under project complexity level and resource uncertainty separately and test it in a lab experiment. We find that project complexity level and resource allocation biases resembled those observed in
Newsvendor experiments. In particular, we observe the pull-to-center effect, i.e., individuals tend to under react when innovation costs and uncertainty call for ambitious scopes or more resources, whereas they tend to overreact when innovation costs and uncertainty call for less ambitious scopes or fewer resources. In addition, we also observe the threshold (demand) chasing bias, i.e., individuals tend to chase uncertainty thresholds realized in previous innovation efforts. These results suggest that NPD managers may under perform in demanding markets, limiting their a priory likelihood of success; and over perform in less challenging markets, a priory dedicating more resources than those required for success.
In the second essay (chapter 3), we study joint decision making as a potential debiasing mechanism for the pull-to-center effect. In particular, we join or bundle to items that differ in their perceived importance and safety stock condition. Building on cognitive dissonance (Festinger, 1957; Simon et
al., 1995) arguments, we pose that bundling a high-importance high-safety stock item with a
low-importance low-safety stock item (consonance) reduces the bias for the high-low-importance item. Alternatively, we pose that bundling a high-importance low-safety stock item with a low-importance high-safety stock item (dissonance) increases the bias for the high-importance item. We test this new debiasing mechanism in a lab experiment in which we compare joint inventory ordering decisions to corresponding baseline inventory ordering decisions (no bundling). We find support for our
predictions, suggesting that joint consonant and dissonant decision frameworks may help achieving higher product availability (or customer service satisfaction) and/or profits for critical items.
Finally, in the third essay (chapter 4), I test behaviorally Bulinskaya’s (1964) Newsvendor extension to the case of backorders and compare it to the traditional lost sales Newsvendor model. Consistent with a theoretical comparison of both inventory systems, I find that backorders drive
individuals’ inventory ordering quantities upwards compared to lost sales. In addition, consistent with reference dependence and misperceptions of feedback, I also find that individuals react to shortages in a stronger manner when unmet demand is backlogged than when is lost and underweight backorders when making inventory ordering decisions, respectively. These results suggest that suppliers may benefit in terms of product availability (or customer service satisfaction) and/or profits by backlogging rather than losing unmet demand.
CHAPTER 2
AMBITIOUS DESIGN GOALS AND STRETCHED RESOURCE
ALLOCATION: INVESTIGATION OF MANAGERIAL BIASES
UNDER INNOVATION UNCERTAINTY
(with Paulo Gonçalves and Nitin Joglekar)
ABSTRACT
We develop a stylized decision making model to inform decision making in New Product
Development (NPD) under innovation uncertainty. The model incorporates the possibility of setting ambitious (or, alternatively, less aggressive) design goals or stretched (or, alternatively, less restricted) resource allocations. Delivering on these goals enhances market payback, but also creates product launch risks. Our setup is analogous to the Newsvendor model for ordering inventory. We
operationalize and test the model experimentally under complexity and resource uncertainty
separately. Results show that decision making biases resemble those observed in Newsvendor settings. On the one hand, we observe the pull-to-center effect; that is, individuals tend to under react when innovation costs and uncertainty call for either more resources or ambitious scopes, and they tend to overreact when innovation costs and uncertainty call for either fewer resources or ambitious scopes. On the other hand, we also observe the threshold chasing bias; that is, individuals tend to chase uncertainty thresholds realized in previous innovation efforts. Findings suggest that NPD managers may underperform in demanding markets, limiting their a priory likelihood of success; and over perform in less challenging markets, a priory dedicating more resources than those required for success.
Keywords: Behavioral Operations Management, Laboratory Experiments, Innovation Uncertainty,
2.1. INTRODUCTION
New Product Development projects face significant uncertainty impacting their success in the market place. Managing uncertainty to reduce the risk of project failure is a key challenge faced by NPD managers (Cooper, 2003). Uncertainty sources are diverse and include, among others: customer, technological, market, and resource uncertainty (Cooper, 2003; Krishnan and Ulrich, 2001; Moenaert and Souder, 1990; Mullins and Sutherland, 1998; Thomke, 2008). To the extent that information about the uncertainty sources is available and adequate —there is a list of possible events, their probabilities, and their impact on project payoff—, NPD managers can rely on traditional project management tools such as task scheduling and risk management to address them (Pich et al., 2002). Activity network techniques such as Critical Path Method (CPM) and Program Evaluation and Review Technique (PERT) have been widely used for decades for project planning and project management. Risk management, scenario-planning and simulation extend activity network techniques, by identifying possible but uncertain events and planning for them.
However, information about the uncertainty sources is frequently incomplete or inaccurate. NPD managers are not aware of all possible unanticipated events (Schrader et al., 1993) and do not fully understand the impact that their decisions may have on project performance (Pich et al., 2002). Accordingly, empirical research suggests a number of approaches to manage projects in highly uncertain environments. For instance, research shows that iterative prototyping and testing can help NPD projects progress towards acceptable results (Lynn et al., 1996; Thomke, 1998). Alternatively, managers can work on parallel trials to develop multiple solutions, choosing the best one once their outcomes are observable (Beinhocker, 1999; Sobek et al., 1999).
Similarly, analytical approaches suggest how to model information about the uncertainty sources in order to optimize a given project outcome. For instance, Pich et al. (2002) consider a general model that maps a network of activities and a set of influence factors to a project payoff. The uncertain nature of the set of influence factors and the complexity of the map structure make necessary to consider policies —instead of a pre-specified network of activities— that identify in advance a complete set of
actions which are triggered by signals. Under this approach, a policy is then optimal if it maximizes the conditional expected payoff given a signal. Following decision sciences, Loch and Terwiesch (2005) consider a model of preliminary information in which information is treated in the form of probabilities and outcomes. The model also considers events or aggregated set of outcomes and actions that the information receiving party takes. Knowing that earlier actions incur lower costs, but are associated with higher uncertainty, and later actions can use more information, but are more costly, the manager’s problem is then to time actions in the presence of uncertainty so as to minimize
expected costs.
Although these approaches seek to inform decision making under innovation uncertainty, they are too complex and hence derivation of optimal policies is extremely difficult, rendering difficult to quantitatively support managerial decisions (Loch and Terwiesch, 2005; Pich et al., 2002). In addition, these approaches have not been tested behaviorally to the best of our knowledge and hence a clear understanding of how managers behave under innovation uncertainty is lacking (Loch and Wu, 2007).
Addressing such gaps, this work makes two contributions. First, it adapts the seminal Newsvendor model for perishable inventory to NPD decision making under innovation uncertainty. By drawing a parallel between NPD decision making under innovation uncertainty and Newsvendor decision making, we derive a foundational model, which we name the Innovator model, to suitably inform decision making in NPD under innovation uncertainty. Our simple model provides a normative solution for an NPD manager deciding on the complexity level (or scope) of a project and on its resource allocation under complexity and resource uncertainty, respectively. Second, it explores decision biases NPD managers may be prone to. Previous research on judgment and decision theory has shown that individuals are prone to a number of decision biases (Kahneman, 2003; Tversky and Kahneman, 1974). Cooper (2003) recognizes that NPD managers face similar challenges to those faced by other individuals, which suggests that their decisions may deviate from optimum. By running decision experiments applying the Innovator model under either complexity or resource uncertainty, we show that NPD managers may be prone to the well-known pull-to-center effect and demand (threshold) chasing bias commonly observed in behavioral studies of the Newsvendor model.
The rest of the paper is organized as follows: Section 2.2 provides an explanation of innovation uncertainty, emphasizing endogenous uncertainty sources. Section 2.3 draws an analogy between decisions in NPD under innovation uncertainty and Newsvendor settings, developing an analog to the Newsvendor model, which we name the Innovator model. Based on behavioral studies of the
Newsvendor model, section 2.4 develops a research hypothesis and presents the laboratory (lab) experiment designed to test the Innovator model under resource and complexity uncertainty separately. Section 2.5 presents the main results and hypothesis tests. Finally, section 2.6 summarizes the work and discusses the main findings, implications, limitations, and opportunities for future research.
2.2. INNOVATION UNCERTAINTY
Uncertainty is a prevalent issue in innovation. The NPD literature highlights some common sources of uncertainty: customer, technology, market, and resource uncertainty (Cooper, 2003; Krishnan and Ulrich, 2001; Moenaert and Souder, 1990; Mullins and Sutherland, 1998; Thomke, 2008). Customer uncertainty is related with the inability of customers to fully specify all of their needs because they either face uncertainty themselves or cannot articulate their needs on products that do not yet exist (Thomke, 2008). Technological uncertainty arises because there is a lack of knowledge about the availability and performance of new technology (Cooper, 2003). Market uncertainty is related with the absence of information about the market opportunities that a new technology offers (Mullins and Sutherland, 1998). And resource uncertainty is related with the absence of information about the human, financial, and technical resources needed to create the innovation (Cooper, 2003; Moenaert and Souder, 1990; Mullins and Sutherland, 1998).
Customer uncertainty, technological uncertainty, and market uncertainty all originate from the external environment (Moenaert and Souder, 1990). Due to their exogenous nature, these sources of uncertainty are harder for NPD managers to control. In contrast, resource uncertainty originates internally and hence it is arguably easier for NPD managers to measure and control (Jauch and Kraft, 1986). This is so even though resource uncertainty may be impacted by external sources of
managers may choose to allocate in a specific market (Thomke, 2008), they still retain control over the decision. Hence, the Resource Innovator model deals initially with resource uncertainty.
In addition, complexity has been identified as a central contributor to project uncertainty(Hobday, 1998; Pich et al., 2002; Tatikonda and Rosenthal, 2000) and associated with the reasons why NPD projects are often late, over budget, or lacking scope (Kim and Wilemon, 2003; Tatikonda and Rosenthal, 2000). Kim and Wilemon (2003) summarize the different definitions of complexity provided in the NPD literature, defining it as the challenges posed by the different number of
technologies/components/functions in development efforts and the nature of organizational tasks that individuals and organizations face in carrying out NPD programs. From this definition, one can arguably infer that complexity arises from within the organization, both from the characteristics of the product being developed (Griffin, 1997; Murmann, 1994) and from the different number of tasks that need to be carried out to develop the product (Tatikonda and Rosenthal, 2000). Because of its endogenous nature, complexity may be easier for NPD managers to control even though it may be exacerbated by external sources of uncertainty. For instance, significant customer uncertainty can lead to constantly changing product specifications, making it difficult for managers to assess the desired product functionality and total number of development tasks. Still, NPD managers retain control over the decision potentially addressing a subset of customer requirements. Hence, the Complexity Innovator model deals initially with complexity uncertainty.
2.3. THE INNOVATOR MODEL
In the Newsvendor model (Arrow et al., 1951), a manager places an order quantity q at unit cost w facing an uncertain demand D in a single selling season. Once D is realized, the manager sells each unit at price p > w. If q exceeds D, then D units are sold and q – D units can be salvaged for s < w. That is, there is a unit overage cost co = w – s. If D exceeds q, then q units are sold and the potential
profit from selling D – q units is forgone. That is, there is a unit underage cost cu = p – w. For
simplicity, and following previous Newsvendor experiments, we assume no salvage value. That is, co
( ) ( – ) – ( ) (2.1)
where
( ) ( – ) ( – ) (2.2)
is the mismatch cost when ordering q. The normative solution that minimizes mismatch cost equals the maximizer of profits. If D is a random variable with pdf f, the expected mismatch cost can be expressed as a function of the order quantity q:
[ ( )] ∫( – )( ) ∫( – )( ) (2.3)
It is well-known that the normative solution Q* that minimizes expected mismatch cost is an order-up-to or base-stock policy that balances overage and underage costs, which is characterized by the following expression:
( )
(2.4)
where F is D’s cdf. Schweitzer and Cachon (2000) define a product as a high-profit (or high-safety stock) product when F(Q*) ≥ 1/2 and as a low-profit (or low-safety stock) product otherwise.
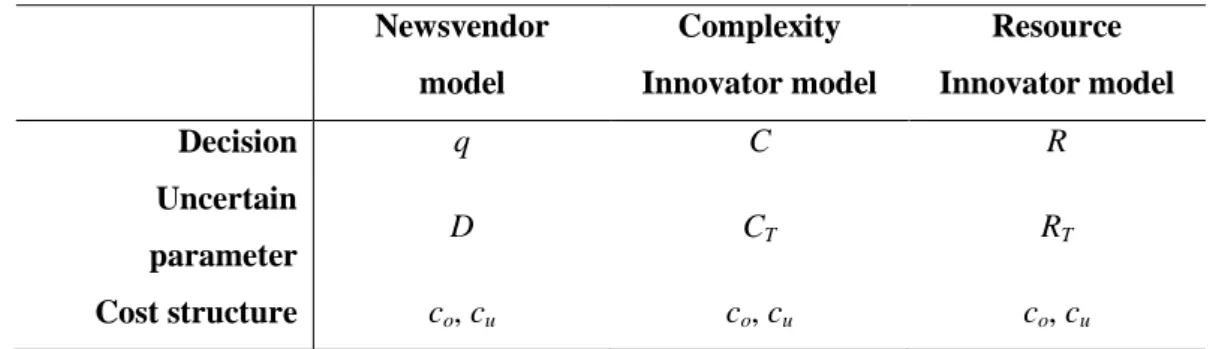
Summarizing, the Newsvendor model is characterized by three main components —a single decision (q), an uncertain parameter (D), and a cost structure (co and cu)— and a relatively simple optimal
policy that balances overage and underage costs given a distribution of the uncertain parameter. Assuming a single stage-gate innovation pipeline, the proposed Innovator model for NPD decision making under innovation uncertainty is characterized by the same structure. In NPD under complexity uncertainty, a manager decides on the complexity level C or scope of a project (e.g. the functionality
of a software program) before observing the functionality threshold CT the project must meet to be
successful in the market (e.g. functionality the software must have at time of launch). Analogously, in NPD under resource uncertainty, a manager decides on the amount of resources R to allocate in a project (e.g. the number of engineer-hours with a fixed productivity in terms of tasks/hour) before knowing the total number of tasks RT the project will require before launch (e.g. planned work and
unplanned rework to program all the functionality the software requires).
Letting p be the unit revenue associated with a project and w the associated unit development cost, the cost structure of the Innovator model is analogous to that of the Newsvendor model. In the Complexity Innovator model, and following the Newsvendor logic, the project cost depends only on the decided complexity level of the project. That is, project cost is independent of the functionality threshold required for product success, and equals wC. A unit overage costs co = w is then incurred
whenever the decided complexity level C is more than the functionality threshold CT required for
product success (e.g. the software program has more functionality than required). That is, the
organization builds more functionality than required for product success, incurring unnecessary costs for the extra work C – CT. In contrast, and again following the Newsvendor logic, project revenue
depends on whether the project is successful. That is, project revenue depends on whether the project meets the functionality threshold, and equals (p – w)C if ≤ T and (p – w)CT if C > CT. A unit
underage cost cu = p – w is then incurred whenever C is less than the CT required for product success.
That is, not all functionality is built and the product is launched lacking functionality, preventing the organization from realizing potential profits from CT – C.
Similarly, in the Resource Innovator model, the project cost depends only on the amount of resources allocated or the number of tasks completed. That is, project cost is independent of the amount of resources necessary to complete all tasks the project will require before launch, and equals
wR. A unit overage cost co = w is then incurred whenever the allocated resources R are more than
enough to complete all required tasks RT (e.g. allocating 100 engineer-hours when 90 engineer-hours
are enough to program all the software functionalities). That is, the organization allocates more
In contrast, and again following the Newsvendor logic, project revenue depends on whether all required tasks are completed. That is, project revenue depends on whether all tasks the project will require before launch are completed, and equals (p – w)R if R ≤ RT and (p – w)RT if R > RT. A unit
underage cost cu = p – w is then incurred whenever R is not enough to complete RT. That is, not all
tasks are completed and the product is launched with defects, preventing the organization from realizing potential profits from RT – R.
Assuming that NPD managers decide on C or R under the assumed cu and co and NPD
organizations collect information about past NPD efforts to learn about the previous uncertainty sources CT or RT (McCarthy et al., 2006), the Newsvendor structure in (2.1)-(2.4) can inform
complexity level or resource allocation decisions under innovation uncertainty, providing managers with a normative complexity level or resource allocation given by (2.4).
Table 2.1 summarizes the parallel between the Newsvendor model and the proposed Complexity and Resource Innovator models.
Table 2.1. Parallel between the Newsvendor and the Innovator models. Newsvendor model Complexity Innovator model Resource Innovator model Decision q C R Uncertain parameter D CT RT Cost structure co, cu co, cu co, cu
2.4. RESEARCH HYPOTHESIS AND LABORATORY EXPERIMENT
2.4.1.
Innovators behavior
Lab experiments on the Newsvendor model have mainly reported two decision biases: level bias and adjustment bias. Level bias refers to individuals’ average tendency to order away from the normative order quantity (Rudi and Drake, 2011). It is commonly reported in terms of the pull-to-center effect, which refers to the average tendency of individuals to order between the normative solution and the
mean demand (Bostian et al., 2008). That is, individuals tend to order too few of high-profit products and too many of low-profit products (Schweitzer and Cachon, 2000).
In a seminal behavioral study of the Newsvendor model, Schweitzer and Cachon (2000) found evidence of the pull-to-center effect in both high- and low-profit products. A number of other studies have provided further support for the effect, showing it is robust to the demand distribution (Benzion
et al., 2008, 2010), sharpened payoff differentials addressing flat maximum concerns and their
impediments to learning (Bolton and Katok, 2008; Bostian et al., 2008), and improved outcome feedback (Bolton and Katok, 2008; Bostian et al., 2008; Lurie and Swaminathan, 2009), among others.
Given the structural similarity between the Newsvendor and both Complexity and Resource Innovators, it is then reasonable to expect complexity level and resource allocation behaviors consistent with the pull-to-center effect. This leads to the first hypothesis:
HYPOTHESIS 1: Complexity level decisions will fall between the mean functionality threshold and the optimal complexity level in both profit conditions. Similarly, resource allocation decisions will fall between the mean number of tasks that need to be completed before launch and the optimal resource allocation in both profit conditions.
In addition, we do not have any reason to expect differences in complexity level and resource allocation behaviors in the same profit condition given the structural similarity between the
Complexity and Resource Innovators in the same profit condition. This leads to the second hypothesis: HYPOTHESIS 2: In the same profit condition, complexity level behavior will be similar to
resource allocation behavior.
Adjustment bias refers to individuals’ average tendency to adjust order quantities period-to-period (Rudi and Drake, 2011). It is commonly reported in terms of the demand (threshold) chasing bias, which refers to the average tendency of individuals to adjust orders towards the prior demand realization (Schweitzer and Cachon, 2000). That is, when individuals adjust orders period-to-period, they tend to do so more frequently towards than away from prior threshold realizations.
In the seminal behavioral study of the Newsvendor model, Schweitzer and Cachon (2000) found also evidence of threshold chasing behavior in both high- and low-profit products. Threshold chasing behavior has been less studied than the pull-to-center effect; however, subsequent studies have also provided further support for the bias, showing it is robust to the demand distribution (Benzion et al., 2008), non-operations frames (Kremer et al., 2010), and financial risk-taking behaviors(de Véricourt
et al., 2013), among others.
Given the structural similarity between the Newsvendor and both Complexity and Resource Innovators, it is then reasonable to expect complexity level and resource allocation adjustment behaviors consistent with the threshold chasing bias. This leads to the third hypothesis:
HYPOTHESIS 3: Complexity level adjustments will be directed more frequently towards than away from prior functionality thresholds in both profit conditions. Similarly, Resource allocation adjustments will be directed more frequently towards than away from prior number of tasks that need to be completed before launch in both profit conditions.
Unlike the pull-to-center effect, the threshold chasing bias does not have corresponding threshold chasing regions. Hence, and despite the structural similarity between the Complexity and Resource Innovators in the same profit condition, we do not make claims about the similarity in complexity level and resource allocation adjustment behaviors in the same profit condition.
2.4.2.
Experimental design
Following previous Newsvendor experiments (Rudi and Drake, 2011; Schweitzer and Cachon, 2000), we set unit project revenue at p = 12 and manipulate unit development cost c. In particular, we set unit development cost for high-profit projects at c = 3, and for low-profit projects at c = 9. Following also previous Newsvendor experiments (e.g., Bolton and Katok, 2008; Schweitzer and Cachon, 2000), we consider uniformly distributed functionality thresholds ~ ( 1 ) and number of task to be
experienced realizations from the same set of threshold values, controlling for the impact of threshold realizations on decision making behavior.
In the Resource Innovator individuals decide on the amount of resources to allocate, and they receive feedback on number of tasks. In this setting, the productivity of resources measures the number of tasks that can be completed per resource. For simplicity, we assume that the productivity of resources equals 1 task per resource. Hence, there is a straightforward conversion between allocated resources and number of tasks. For example, if an individual allocates 50 resource units, the number of tasks completed is 1 task/res r e ∙ 5 res r e nits 5 tasks.
The described parameterization implies a normative complexity level and allocation of resources of 75 percent complexity level and engineer-hours in the high-profit Innovators, respectively, and a normative complexity level and allocation of resources of 25 percent complexity level and engineer-hours in the low-profit Innovators, respectively.
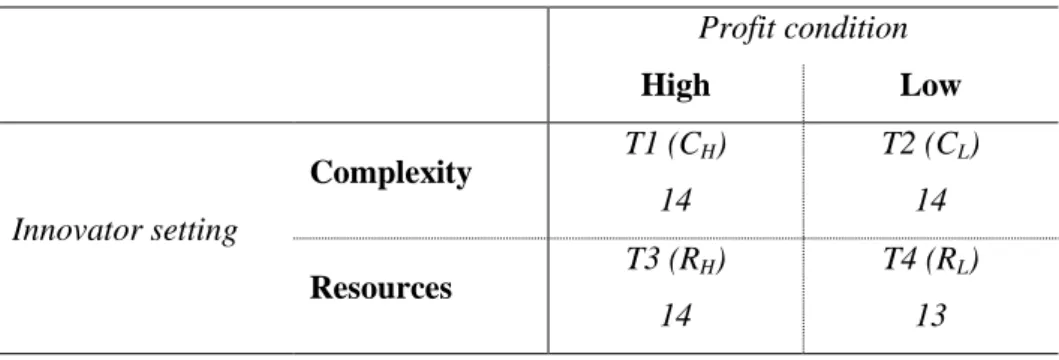
To explore Innovators biases, the experiment hence considers a 2x2 full factorial between-subjects design. The factors are Innovator setting, viz Complexity Innovator and Resource Innovator (C, R), and profit condition, viz high and low (H, L). Notation-wise, Xi, with X Є (C, R), refers to Complexity
Innovator (C) or Resources Innovator (R), where i Є (H, L) refers to a high-profit (H) or a low-profit (L) condition. For example, CH refers to the high-profit Complexity Innovator, whereas RL to the
low-profit Resources Innovator. Thus, the experiment considers four treatments: T1: high-profit Complexity Innovator (CH)
T2: low-profit Complexity Innovator (CL)
T3: high-profit Resources Innovator (RH)
T4: low-profit Resources Innovator (RL)
2.4.3.
Experimental procedure
A total of 55 individuals participated in the experiment. All participants were undergraduate and graduate students from management-related disciplines enrolled in US and Swiss universities. The
experiment was programmed and run with Forio Business Simulations (www.forio.com). Table 2.2 shows the treatments with their corresponding notation and number of participants.
Table 2.2. Treatments, notation, and number of participants.
Profit condition High Low Innovator setting Complexity T1 (CH) 14 T2 (CL) 14 Resources T3 (RH) 14 T4 (RL) 13
Participants arrived and were given the instructions (see Appendix 2.1). Participants had time to ask clarifying questions before initiating the experiment. After having read the instructions and answered any clarifying questions, an assistant initiated the experiment. Participants made 50 consecutive decisions for a single project each decision round aiming at maximizing cumulative profits. Each decision round began with the participant deciding on the complexity level or resource allocation, after which the CT or RT realization and the corresponding realized profits were revealed.
Information on unit project revenue p and unit development cost c was available in the decision screen at any time. Participants had also access to historical information about the outcomes in previous projects, including previous decisions, uncertainty factor realizations, profits, and total cumulative profits (Appendix 2.2 shows a snapshot of the game screen). Monetary rewards were not used to incentivize participants.
2.5. RESULTS
2.5.1.
Pull-to-center effect
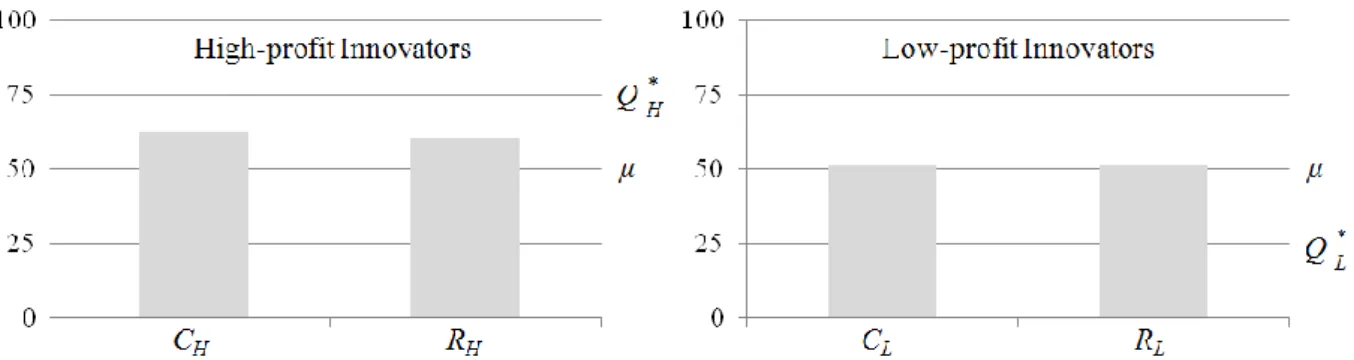
Before showing the formal hypothesis tests, we first show an overview of the average complexity level and resource allocation behaviors. For instance, average complexity level behavior in CH is given by
averaging average complexity levels across rounds for each participant across the number of
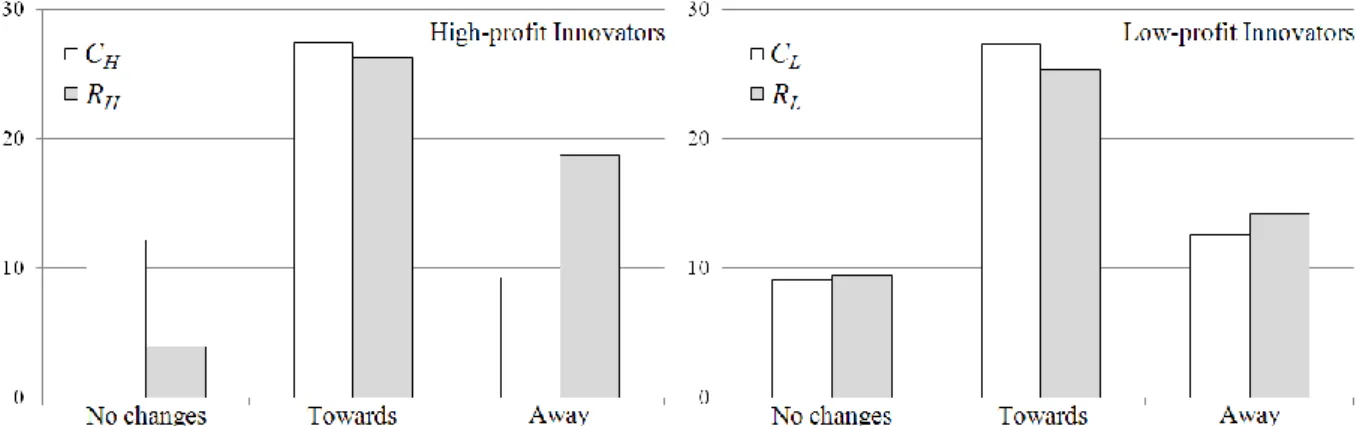
in the high-profit Innovator settings exhibit the pull-to-center, whereas low-profit Innovator settings exhibit a stronger pull-to-center effect. In addition, Figure 2.1 also suggests there are no differences between Innovator settings in the same profit condition. Following, we present the formal hypothesis tests.
Figure 2.1. Average complexity level and resource allocation behaviors.
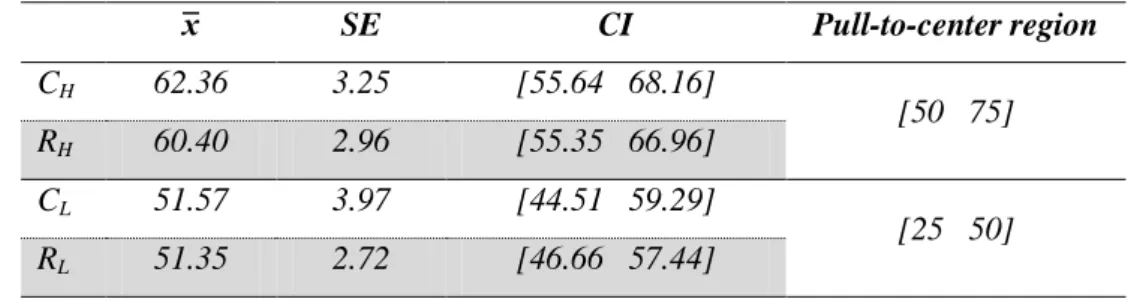
We first formally test whether complexity level and resource allocation behaviors exhibit the pull-to-center effect in both profit conditions (Hypothesis 1). Table 2.3 shows 95% bootstrap confidence intervals around the population of participants’ average decisions for all Innovator settings.1 Table 2.3 shows that the results of the high-profit Innovator settings are consistent with the pull-to-center effect since average complexity level and resource allocation behaviors are contained within the high-profit pull-to-center region. Table 2.3 also shows that the results of the low-profit Innovator settings show an asymmetric pull-to-center effect since average complexity level and resource allocation behaviors are not fully contained within the profit pull-to-center region. Such an asymmetry is common in low-profit conditions (Bolton and Katok, 2008; Bostian et al., 2008; Schweitzer and Cachon, 2000). In addition, a Wilcoxon Rank-Sum test comparing average deviations from the optimum between high- and low-profit Innovator settings shows that the effect is in fact stronger in low-profit conditions (W =
1
We report bootstrap confidence intervals since the sample sizes do not guarantee that the samples conform to the assumptions needed to report standard confidence intervals.
902, z = 2.46, p-value1 tail = 0.0070, r = 0.33). 2
Hence, we observe average complexity level and resource allocation behaviors consistent with the pull-to-center effect in high-profit Innovator settings and with an asymmetric pull-to-center effect in low-profit Innovator settings, providing support for Hypothesis 1.
Table 2.3. 95% bootstrap confidence intervals of average complexity level and resource allocation behaviors. SE CI Pull-to-center region CH 62.36 3.25 [55.64 68.16] [50 75] RH 60.40 2.96 [55.35 66.96] CL 51.57 3.97 [44.51 59.29] [25 50] RL 51.35 2.72 [46.66 57.44]
We next test whether complexity level and resource allocation behaviors are similar in the same profit condition (Hypothesis 2). We compare populations of participants’ average decisions between Innovator settings in the same profit condition. Wilcoxon Rank-Sum tests show that we cannot statistically rule out the possibility that average complexity level and resource allocation behaviors are similar in both high- (W = 190, z = –0.60, p-value2 tails = 0.5503, r = –0.11) and low-profit Innovator
settings (W = 186, z = 0.19, p-value2 tails = 0.8461, r = 0.04).3 Because such similarities are stated as
null hypotheses, the best we can do is to fail to reject them. These results do not automatically allow us to accept the similarities since we could be making a type II error. However, observing the effect sizes —denoted as r— provides us with an objective measure of the importance of the effects (Field, 2009). The effect sizes r = –0.11 and r = 0.04 have a low-to-middle and a low importance in absolute
2
We report a Wilcoxon Rank-Sum tests since the pooled sample sizes (28 and 27 observations for CH + RH and CL + RL,
respectively) do not guarantee that the samples conform to the assumptions needed to report an unpaired t-test. However, a non-reported unpaired t-test shows qualitatively the same results.
3
We report Wilcoxon Rank-Sum tests since the sample sizes do not guarantee that the samples conform to the assumptions needed to report unpaired t-tests.
value since they are below the cut-off values 0.30 and 0.10, respectively (Field, 2009). These results suggest that complexity level and resource allocation behaviors are similar in the same profit condition. Hence, the results are fairly consistent with Hypothesis 2.
Learning
Previous Newsvendor experiments have shown mixed evidence regarding learning to avoid the pull-to-center effect (Benzion et al., 2010; Bolton et al., 2012), yet we also test for it. We compare the population of participants’ average deviations from the optimum in the first 10 rounds to that of the last 10 rounds within each Innovator setting. Wilcoxon Rank-Sum tests show there is significant evidence of learning to avoid the pull-to-center effect in CL (W = 167, z = –1.65, p-value1 tail = 0.0491,
r = –0.31), whereas no evidence in the remaining Innovator settings (CH: W = 195.5, z = –0.34,
p-value1 tail = 0.3652, r = –0.07 — RH: W = 187.5, z = –0.71, p-value1 tail = 0.2382, r = –0.13 — RL: W
= 162.5, z = –0.67, p-value1 tail = 0.2525, r = –0.13).
Within each Innovator setting, we also run a fix-effects panel regression model of the form:
| i t 1 – | 1t 2 eri t n eri t i i t t 1 (2.5)
where the dependent variable captures participants’ tendency to get closer to the optimal decision over time, t refers to round, Overi, t and Underi, t refer to the amount of over- and under-functionality of
participant i in round t, respectively, and serve as a control for threshold chasing effects, vi is the
participants’ effect, and i, t is the error term. Evidence of learning is provided by a significant and
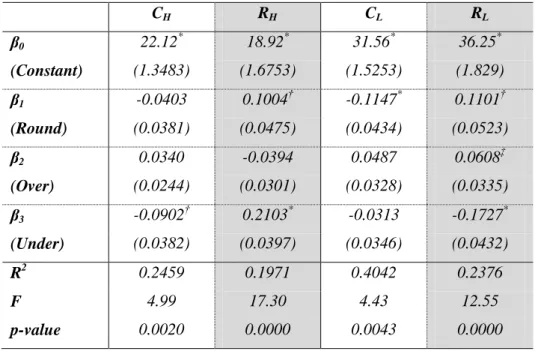
negative round coefficient. Table 2.4 shows highly significant evidence of learning to avoid the pull-to-center effect in CL, whereas significant evidence of learning in both RH and RL.
Taken together, we observe evidence of learning to avoid the pull-to-center effect in CL, whereas
poor evidence in both RH and RL, which is consistent with the mixed evidence presented in previous
Table 2.4. Fixed-effects panel regression of learning to avoid the pull-to-center effect.a CH RH CL RL β0 (Constant) 22.12* 18.92* 31.56* 36.25* (1.3483) (1.6753) (1.5253) (1.829) β1 (Round) -0.0403 0.1004† -0.1147* 0.1101† (0.0381) (0.0475) (0.0434) (0.0523) β2 (Over) 0.0340 -0.0394 0.0487 0.0608‡ (0.0244) (0.0301) (0.0328) (0.0335) β3 (Under) -0.0902† 0.2103* -0.0313 -0.1727* (0.0382) (0.0397) (0.0346) (0.0432) R2 0.2459 0.1971 0.4042 0.2376 F 4.99 17.30 4.43 12.55 p-value 0.0020 0.0000 0.0043 0.0000
a Standard errors in parentheses. *
Highly significant, † Significant, ‡ Marginally significant.
2.5.2.
Threshold chasing bias
Before showing the formal hypothesis test, we first show an overview of the average adjustment behavior period-to-period. For instance, average adjustment behavior towards prior functionality thresholds in CH is given by averaging the number of complexity level adjustments towards the prior
functionality threshold for each participant across the number of participants in CH. Regardless of the
profit condition, Figure 2.2 suggests that when participants did change decisions period-to-period, they did it more frequently towards than away from prior functionality thresholds and number of tasks that need to be completed before launch in the Complexity and Resource Innovators, respectively.
Figure 2.2. Average complexity level and resource allocation adjustment behaviors period-to-period.
We now test whether complexity level and resource allocation adjustment behaviors period-to-period are consistent with the threshold chasing bias in both profit conditions (Hypothesis 3). We compare the population of participants’ number of adjustments towards prior threshold realizations to that of adjustments away from them within each Innovator setting. Wilcoxon Rank-Sum tests in Table 2.5 show that the average number of adjustments towards prior threshold realizations is significantly larger than the average number of adjustments away from them in all Innovator settings, providing support for Hypothesis 3. 4
4
We report Wilcoxon Rank-Sum tests since the sample sizes do not guarantee that the samples conform to the assumptions needed to report unpaired t-tests.
Table 2.5. Wilcoxon Rank-Sum tests of threshold chasing bias.
W z p-value1 tail r Support
27.5 117.5 -3.93 0.0000 -0.74 High 9.3 R 26.3 144 -2.71 0.0034 -0.51 High R 18.8 27.3 123.5 -3.65 0.0001 -0.69 High 12.6 R 25.4 129.5 -2.36 0.0092 -0.46 High R 14.2
Learning
Newsvendor experiments have tested learning to avoid the threshold chasing bias to a lesser extent than learning to avoid the pull-to-center effect. Nevertheless, previous Newsvendor experiments suggest that individuals show a tendency to avoid the threshold chasing bias over time (Benzion et al., 2008; Schweitzer and Cachon, 2000). Accordingly, we compare the population of participants’ number of adjustments towards prior threshold realizations in the first 10 rounds to that of the last 10 rounds within each Innovator setting. Wilcoxon Rank-Sum tests show there is significant evidence of learning to avoid the threshold chasing bias in both CH and CL (CH: W = 162.5, z = –1.86, p-value1 tail
= 0.0314, r = –0.35 — CL: W = 160.5, z = –1.95, p-value1 tail = 0.0254, r = –0.37), marginal evidence
in RH (W = 174.5, z = –1.31, p-value1 tail = 0.0952, r = –0.25), and no evidence in RL (W = 165, z = –
0.54, p-value1 tail = 0.2951, r = –0.11).
However, a decline in the number of adjustments towards prior threshold realizations does not necessarily capture a decline in the magnitude of decision adjustments period-to-period. Within each Innovator setting, we hence run a fix-effects panel regression model in which the only difference with respect to (2.5) is the dependent variable | i t 1 – i t|, which captures participants’ tendency to reduce the absolute change in complexity levels between two consecutive rounds over time. Table 2.6
shows significant evidence of a decline in the magnitude of decision adjustments period-to-period in
CL only.
Whereas the number of adjustments towards prior threshold realizations tends to decline over time, the magnitude of the adjustments does not. Taken together, we observe poor evidence of learning to avoid the threshold chasing bias.
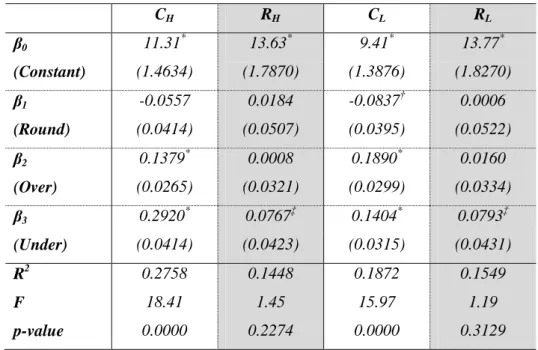
Table 2.6. Fixed-effects panel regression of learning to avoid the threshold chasing bias.a
CH RH CL RL β0 (Constant) 11.31* 13.63* 9.41* 13.77* (1.4634) (1.7870) (1.3876) (1.8270) β1 (Round) -0.0557 0.0184 -0.0837† 0.0006 (0.0414) (0.0507) (0.0395) (0.0522) β2 (Over) 0.1379* 0.0008 0.1890* 0.0160 (0.0265) (0.0321) (0.0299) (0.0334) β3 (Under) 0.2920* 0.0767‡ 0.1404* 0.0793‡ (0.0414) (0.0423) (0.0315) (0.0431) R2 0.2758 0.1448 0.1872 0.1549 F 18.41 1.45 15.97 1.19 p-value 0.0000 0.2274 0.0000 0.3129 a
Standard errors in parentheses. *
Highly significant, † Significant, ‡ Marginally significant.
2.6. DISCUSSION
We proposed a stylized analytical model to inform NPD decision making under innovation
uncertainty. Assuming a single stage-gate innovation pipeline under a single uncertainty source, the proposed Innovator model draws a close parallel with the Newsvendor model, a traditional Operations Management model for ordering inventory under stochastic demand. The study shows how decisions in our stylized Innovator model are analytically equivalent to decisions in the traditional Newsvendor model. The analogy allows applying insights from the Newsvendor model to NPD decision making
under innovation uncertainty. Hence, our research seeks to inform decision making under uncertainty in NPD settings.
By the same token, our research also suggests that NPD managers may be prone to the same decision making biases commonly observed in Newsvendor settings. Operationalizing the Innovator model under complexity and resource uncertainty separately, a lab experiment showed that decision making biases in NPD settings resemble those observed in Newsvendor experiments. In particular, we observed a pull-to-center effect. That is, for high-profit projects, individuals under react when
innovation costs and uncertainty require more ambitious scopes or resources. In contrast, for low-profit projects, they overreact when innovation costs and uncertainty require less ambitious scopes or resources. In addition, the effect is stronger in low-profit projects. That is, the overreaction is stronger than the under reaction.
Under the proposed operationalizations of the Innovator model, high-profit Innovator settings require setting high complexity levels (ambitious design goals) or allocating a large amount of resources (stretched resource allocations) in order to launch a successful product to the market place. In contrast, low-profit Innovator settings require setting low complexity levels or allocating a small amount or resources in order to launch a successful product to the market place. Pull-to-center effect results then suggest that NPD managers may underperform in demanding markets (high-profit Innovator settings), limiting their a priori likelihood of success, and over perform in less challenging markets (low-profit Innovator settings), a priory investing more effort than that required for success. In addition, the asymmetric pull-to-center effect in low-profit Innovator settings suggests that less
challenging markets may pose more survival threats to NPD managers and their organizations. Moreover, we observed no differences between Complexity and Resource Innovators in the same profit condition, suggesting that a poor understanding of the structure of the problem rather than a specific uncertainty type drives poor managerial decision making behavior under innovation uncertainty. That is, individuals seem to fail to find a balance between over and under development costs under innovation uncertainty in general. These results may hold also for NPD managers since purchasing managers exhibit a similar behavior in the analogous Newsvendor model (Bolton et al.,
2012). In addition, we also observed a threshold chasing bias. That is, individuals tend to chase uncertainty thresholds realized in previous innovation efforts. These results suggest that NPD
managers may be affected by a recency bias that makes individuals to place a higher weight on recent events to the detriment of an understanding of the structure of the task at hand. Taken together, these results suggest that NPD managers may poorly understand decision making under innovation
uncertainty and the influence of threshold cues may prevent them from engaging in understanding it in the first place. The mixed results regarding learning to avoid both the pull-to-center effect and the threshold chasing bias further reinforce the previous point.
Although Newsvendor research has shown that in some cases individuals recognize the structure of the problem, it has also shown that they may still fail to convert such information into good
Newsvendor decision making (Cui et al., 2013; Gavirneni and Isen, 2010). However, Bolton et al. (2012) showed that Newsvendor task training helps individuals convert such information into improved Newsvendor decision making. Hence, this suggests that training NPD managers in the Innovator model may help them mitigate biased behavior.
Overall, our research suggests that the Innovator model can be used as a building block to study NPD decision making under innovation uncertainty, bringing special attention to the study of managerial biases in NPD settings. However, we also acknowledge the novelty of the application of the Innovator model and the challenges that it imposes. For instance, we proposed a stylized analytical model by assuming a single stage-gate innovation pipeline under a single uncertainty source. These simplifying assumptions bring attention to external validity concerns typical of most experimental studies. Hence, future work could expand the Innovator model by incorporating more than one development stage, several uncertainty sources simultaneously, or relax both assumptions in a systematic manner to study the effect of increasing complexity levels of the innovation setting on decision making.
Also, managers in real situations may not decide as did our sample of both undergraduate and graduate students from management-related disciplines. Although there is not systematic evidence indicating that managers perform better than students in Newsvendor settings (Bolton et al., 2012), it
may be the case that NPD settings impose additional challenges to those typical of Newsvendor settings (e.g., potentially riskier environments), and thus managers may decide differently in an Innovator setting. Hence, future work could test the Innovator model with a sample of managers. In addition, monetary rewards were not used to incentivize participants. On the one hand, it could be argued that monetary rewards would improve results. On the other hand, the fact that behavior was fairly consistent with behavior observed in previous Newsvendor experiments may cast doubt on this observation. Nevertheless, future research could use monetary rewards for the sake of experimental rigor and analyze whether the use of incentives makes a significant difference.
Similarly, other contextual factors potentially important in NPD settings such as incentive systems and group decision process were not taken into consideration to avoid introducing confounding factors into the analysis and run a clean test of the Innovator model. Future work could explore how these and other contextual factors s influence Innovators’ behavior.
Notwithstanding these limitations, endeavors like this make the tradeoff inherent to experiments, i.e., the advantages of experiments for controlling confounding factors and establishing cause-and-effect relationships vs. the lack of external validity, both necessary and acceptable. The Innovator model is a first step to formally explore how NPD managers make decisions under different types of innovation uncertainty. We believe there are significant research opportunities ahead along this same line.
Appendix 2.1. Sample of written instructions (C
H)
INSTRUCTIONSThe purpose of this session is to study how people make decisions in product development (PD) efforts.
DESCRIPTION OF THE GAME
You are a senior PD manager deciding the complexity level of the projects that your company will launch. Your complexity decisions (e.g., the functionality of a software program) influence the likelihood that a project may pass (or not) the threshold established in the screening process set by the company’s vice president (VP).
For each project, your complexity decision must be made before you know for certain what the VP’s screen level is. Based on past projects, however, you know that the screen is uniformly distributed between 1% and 100%. That is, the screen level is equally likely to take any value from 1% to 100%. Moreover, projects are independent of each other. That is, complexity decisions made in one project do not carry over and do not affect other projects.
Projects that are launched generate on average more profits than projects that fail. Profits for projects that are launched are proportional to the screen level (the VP’s assessed market potential). Profits for projects that fail are proportional to the complexity level (the amount of work the company has devoted to the project). The reward for a project launched is 12 francs for each screen unit. The cost for a project is 3 francs for each complexity unit.
GOAL
Your goal is to maximize the profits you make over 50 projects (rounds of decisions).
PLAYING THE GAME
To access the game, follow the link [game link].
DECISIONS
[Decision table]
After completing all your decisions, send the electronic data by email by following the next steps:
- Right click on the table with your decisions (the table on the upper right of the screen) - Select Copy Data and Paste it in an e-mail
- Copy and Paste the link of the simulation (web address that appears in your Internet browser) - Send the e-mail to: [e-mail address]
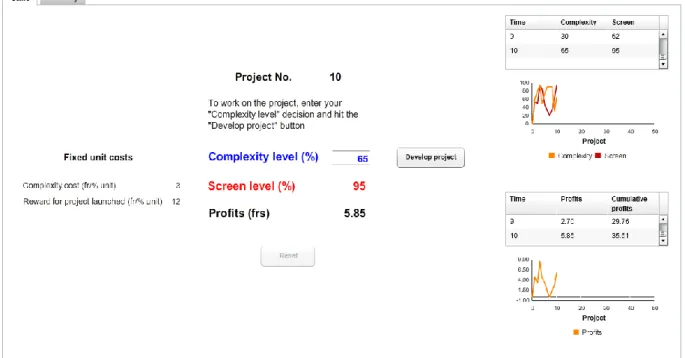
Appendix 2.2. Sample of game screen (C
H)
CHAPTER 3
IMPACT OF JOINT DECISIONS AND COGNITIVE
DISSONANCE ON PREPOSITIONING (NEWSVENDOR)
DECISIONS
(with Paulo Gonçalves)
ABSTRACT
Prepositioning of emergency supplies is a critical task for the success of humanitarian relief operations. However, little is known about how humanitarian practitioners actually make prepositioning decisions. In a laboratory (lab) experiment based on the Newsvendor model,
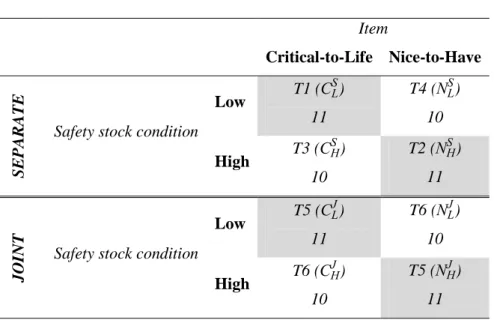
humanitarian practitioners prepositioned emergency supplies of different importance. When making single item decisions, practitioners’ prepositioning behavior shows the pull-to-center effect observed in traditional Newsvendor experiments. When making decisions for two items of different importance, practitioners either increase or reduce the pull-to-center effect. In particular, practitioners made joint prepositioning decisions in either a cognitive dissonant treatment, where a high-importance item in a low-safety stock condition was joined with a low-importance item in a high-safety stock condition; or a cognitive consonant treatment, where a high-importance item in a high-safety stock condition was joined with a low-importance item in a low-safety stock condition. Results show that the importance of emergency items in joint decisions influences prepositioning behavior, with dissonant
prepositioning decisions increasing the pull-to-center effect for high-importance items, and consonant prepositioning decisions reducing the pull-to-center effect for high-importance items. Neither
dissonance nor consonance influence prepositioning behavior for low-importance items. Our research suggests that cognitive dissonance can influence joint prepositioning decisions in Newsvendor settings.