Zuckerman's Revised Alternative Five-Factor Model: Validation of the
Zuckerman-Kuhlman-Aluja Personality Questionnaire in Four
French-Speaking Countries
Jérôme Rossier a, Michel Hansenne b, Nicolas Baudin c & Julien Morizot d
a Institute of Psychology, University of Lausanne, Switzerland b Faculty of Psychology, University of Liège, Belgium
c Faculty of Psychology, University of Paris Ouest Nanterre la Défense, France d School of Psychoeducation, University of Montreal, Canada
The aim of this study was to analyze the replicability of Zuckerman's revised Alternative Five-factor model in a French-speaking context by validating the Zuckerman-Kuhlman-Aluja Personality Questionnaire (ZKA-PQ) simultaneously in 4 French-speaking countries. The total sample was made up of 1,497 subjects from Belgium, Canada, France, and Switzerland. The internal consistencies for all countries were generally similar to those found for the normative U.S. and Spanish samples. A factor analysis confirmed that the normative structure replicated well and was stable within this French-speaking context. Moreover, multigroup confirmatory factor analyses have shown that the ZKA-PQ reaches scalar invariance across these 4 countries. Mean scores were slightly different for women and men, with women scoring higher on Neuroticism but lower on Sensation Seeking. Globally, mean score differences across countries were small. Overall, the ZKA-PQ seems an interesting alternative to assess both lower and higher order personality traits for applied or research purposes.
Most models of personality traits are hierarchical and consider that five independent dimensions allow for an economic and adequate description of these traits, the number of which depends on the model (Rossier, Meyer de Stadelhofen, & Berthoud, 2004). The best known and most commonly accepted model is certainly the Five-factor model (FFM), which considers five dimensions or higher order traits named Neuroticism, Extraversion, Openness to Experience, Agreeableness, and Conscientiousness, each dimension including six facets or lower order traits (Digman, 1990; McCrae & Costa, 1999). Zuckerman, Kuhlman, and Camac (1988) developed an Alternative Five-factor model (AFFM) considering five main dimensions named Impulsive Sensation Seeking, Neuroticism-Anxiety, Aggression-Hostility, Activity, and Sociability. Only a few studies investigated the traits of these dimensions (Zuckerman, 2002). Recently a revised version of the AFFM was proposed considering five slightly different main dimensions, each including four facets. The aim of this research was to evaluate the adequacy of this revised AFFM and the associated personality inventory in a French-speaking context and to assess the level of measurement invariance of this inventory across four French-speaking countries.
To develop the AFFM, Zuckerman and colleagues (1988) studied the structure underlying 46 scales selected from eight inventories used as measures of temperament or involved in psychobiological studies of personality, and identified five replicable dimensions (Zuckerman, Kuhlman, Thornquist, & Kiers, 1991). As expected, these five dimensions appeared to be partially heritable (Angleitner, Riemann, & Spinath, 2004). Subsequently, Zuckerman, Kuhlman, Joireman, Teta, and Kraft (1993) developed the Zuckerman-Kuhlman Personality Questionnaire (ZKPQ) to measure these five independent dimensions. Zuckerman (2002) also suggested that three dimensions might include two facet scales. Thus the Impulsive Sensation Seeking dimension included a sensation seeking and an impulsivity facet, the activity dimension contained a need for general activity and a need for work activity facet, and the Sociability dimension included a liking lively parties and friends and an intolerance of social isolation facet. Nevertheless, the small number of facet scales considered by the AFFM implies that the ZKPQ does not allow for obtaining a detailed personality profile. This lack of information at the facet level might be considered a weakness, especially for psychological assessment in a clinical or
organizational setting, where facet-level assessment is appreciated (Aluja, Kuhlman, & Zuckerman, 2010). Several researchers have compared the AFFM with other personality models and found good construct validity or convergence for four out of the five dimensions of this model (Aluja, Garcia, Cuevas, & Garcia, 2007; Aluja, Garcia, & Garcia, 2002).
The English version of the ZKPQ was translated into Chinese (Wu et al., 2000), French (Rossier, Verardi, Massoudi, & Aluja, 2008), German (Schmitz, 2004), Italian (De Pascalis & Russo, 2003), and Spanish (Aluja et al., 2002; Gomà-i-Freixanet, Valero, Punti, & Zuckerman, 2004). The AFFM personality structure replicated well at the domain and facet levels across all these languages (Rossier et al., 2007). The replicability across languages was even taken as a criterion to select the most appropriate items for creating a cross-cultural shortened form of the ZKPQ (Aluja et al., 2006). The replicability across cultures of personality models such as the AFFM, the FFM, or Eysenck's personality model, is well documented (Allik, 2005; Barrett, Petrides, Eysenck, Eysenck, 1998; Rossier, 2005) and suggests that the measurement instrument used reaches configural invariance. However, cross-cultural psychologists distinguish three levels of invariance. Configurai invariance is reached when the structure of a measurement instrument (i.e., number of factors, pattern of salient and nonsalient loadings) remains the same, metric invariance when the scale intervals remain the same (allowing comparing score differences across countries), and scalar invariance when the origin remains the same across cultures (Steenkamp & Baumgartner, 1998). Mean scores across cultures can be compared only if the measurement instrument used reaches these three levels of invariance simultaneously (Van de Vijver & Leung, 1997; Verardi et al., 2010). If most personality measurements reach configurai invariance they do not seem to reach metric or scalar invariance across cultures (Heine, Buchtel, & Norenzayan, 2008; Rossier, 2005). This implies that specific norms have to be created for each culture. Moreover, the same language is sometimes spoken in different countries characterized by different cultures (Rigozzi et al., 2009; Rossier, Rigozzi, & Personality Across Culture Research Group, 2008). In this context, the use of a multicentric cross-national approach might be advisable for test adaptation (Duarte & Rossier, 2008). If no scalar invariance is found, specific norms have to be developed for each country.
Recently Aluja et al. (2010) proposed a revision of the AFFM considering a hierarchical structure where each dimension includes four facets. They claimed that a hierarchical structure might be more robust, especially when adopting a top-down approach consisting of first defining the overall dimensions and then the facet scales (Rossier et al., 2004), and allows the development of a more precise measurement instrument with higher predictive power, especially in clinical and organizational settings. To design their hierarchical model and develop the Zuckerman-Kuhlman-Aluja Personality Questionnaire (ZKA-PQ), they identified, based on a comprehensive literature review, five potential facet scales per dimension of the AFFM. Twenty items were created for each facet scale in English and Spanish, resulting in 100 items for each dimension and 500 for the entire inventory. To these items, Aluja and colleagues added the 29 items of the Buss and Perry (1992) Questionnaire of Aggressiveness, and 37 items from three subscales of the negative Urgency, lack of Premeditation, lack of Perseverance, Sensation seeking, and Positive urgency (UPPS-P) Impulsive Behavior Scale (Lynam, Smith, Cyders, Fischer, & Whiteside, 2007). They used a 4-point Likert-type scale for the ZKA-PQ instead of the dichotomous response format used in the ZKZKA-PQ. To achieve their item selection, the first step was lowering the number of items per facet to 10, considering the factor structure for each dimension. In a second step they removed one facet scale per dimension with high secondary loadings. Finally, they optimized the reliability of some facet scales by replacing some items with others that were previously excluded. Following this procedure, they obtained a very stable structure, with four facets per dimension, low secondary loadings, and high internal consistencies. Indeed the total congruence coefficients obtained comparing the calibration and validation of Spanish samples with the American samples ranged from .98 to .99.
The five dimensions of the revised AFFM were named Aggressiveness (AG), Activity (AC), Extraversion (EX), Neuroticism (NE), and Sensation Seeking (SS), and correlated in a meaningful manner with the domains of the FFM. The Neuroticism and Extraversion dimensions of both inventories correlated at .71 and .61, respectively. The Aggressiveness dimension correlated negatively with the Agreeableness domain of the FFM (-.53), the Activity dimension correlated positively with the Conscientiousness domain of the FFM (.48), and the Sensation Seeking dimension correlated negatively with the Conscientiousness domain of the FFM (-.36). Aluja et al. (2010) also studied the impact of age, gender, and the country variable (Spain vs. United States) on the mean scores. They observed a significant but negligible (η2 < .01) negative association between age and AC and AG.
Women scored significantly higher on AC, NE, and EX, and men higher on SS and AG. However, these differences were again associated with negligible effect sizes. These results are not in line with those observed with the ZKPQ with, for example, quite large differences between women and men for the Neuroticism-Anxiety dimension. Finally, they observed some country differences, with Spaniards scoring higher on EX and
Americans scoring higher on AC and AG. Unfortunately, they did not report the effect sizes and did not assess the level of invariance of the dimensions of the ZKA-PQ. For this reason, it is impossible to state whether these differences might be attributed to an actual cultural variation or rather due to some bias, such as a translation bias (Duarte & Rossier, 2008).
observed in this context with the structure observed in the Spanish and American validation samples, and to describe the psychometric properties of the French version of the ZKA-PQ. This study was performed simultaneously in four countries where French is an official language and the mother tongue of part of the population, adopting a multicentric cross-national approach. Because the culture of these countries is potentially slightly different (Hofstede, 2001), the level of invariance across countries of each dimension of this revised AFFM was assessed to determine if mean scores might be compared and if country-specific norms need to be considered. Finally, age and gender differences are studied to analyze if the pattern of differences would be similar to the one observed by Aluja et al. (2010) in their validation samples or more similar to the differences usually observed using this type of personality measurement in large heterogeneous samples (Rossier et al., 2007). We also test if the pattern of differences is stable across the four French-speaking countries.
METHOD
Sample
The total sample consisted of participants from Belgium, Canada, France, and Switzerland. In all four countries, French is an official language and the common mother tongue of part of the population. The number of
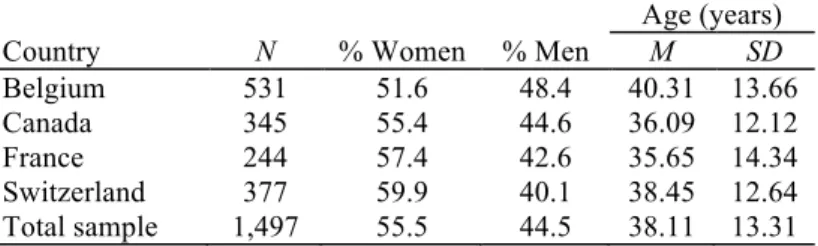
participants, percentage of women and men, mean age, and standard deviation for each country are reported in Table 1. In the total sample, ages ranged from 18 to 83. The mean age of women and men was similar, t(1485) = -.1.34, p > .05. Across countries, mean age differed significantly, F(3, 1483) = 10.56, p < .001, η2= .02, but the
associated effect size was small. The proportion of women and men was similar in each country, χ2(3, N = 1497) = 6.64, p > .05.
Measure
The ZKA-PQ (Aluja et al., 2010) is a recently developed personality questionnaire aimed at assessing the five main dimensions of the revised AFFM: AG, AC, EX, NE, and SS.
TABLE 1.-Characteristics of the samples.
Age (years)
Country N % Women % Men M SD
Belgium 531 51.6 48.4 40.31 13.66
Canada 345 55.4 44.6 36.09 12.12
France 244 57.4 42.6 35.65 14.34
Switzerland 377 59.9 40.1 38.45 12.64
Total sample 1,497 55.5 44.5 38.11 13.31
Each dimension includes four facet scales. AG is divided into physical aggression (AG1), verbal aggression (AG2), anger (AG3), and hostility (AG4). AC is divided into work compulsion (AC1), general activity (AC2), restlessness (AC3), and work energy (AC4). EX is divided into positive emotions (EX1), social warmth (EX2), exhibitionism (EX3), and sociability (EX4). NE is divided into anxiety (NE1), depression (NE2), dependency (NE3), and low self-esteem (NE4). Finally, SS is divided into thrill and adventure seeking (SS1), experience seeking (SS2), disinhibition (SS3), and boredom susceptibility/impulsivity (SS4). Each 20-facet scale includes 10 items and the response format is a 4-point Likert-type scale ranging from 1 (strongly disagree) to 4 (strongly agree). Globally about half of the items are negatively keyed (78/200), two to eight items per facet scale.
Translations
Translations followed established guidelines regarding the translation of self-report inventories (Geisinger, 1994). The 200 ZKA-PQ items were translated by a team of four experts in personality psychology and back-translated into English by an independent professional translator. The experts also assessed the suitability of this translation to the four different cultural settings considered, and after a few wording adjustments, achieved a French version suitable in all four countries. The authors of the ZKA-PQ then checked the back-translation of the personality questionnaire and amendments were made, translated, back-translated, and reviewed. This process continued until the authors agreed with the translation of all items of the ZKA-PQ.
Procedure
In each of the four countries, we planned to collect data from an equal number of women and men. To have a heterogeneous population in terms of age, four age groups were considered: 20 to 29, 30 to 39, 40 to 49, and 50 and older. The idea was to collect data from at least 32 women and 32 men for each age group. Note that 17 participants were slightly younger than 20: In Belgium, 1 participant was 19 years old; in Canada, 6 were 18 years old and 4 were 19 years old; and in France, 6 were 19 years old. Of the sample, 1.1% was younger than 20, 28.8% was between 20 and 29 (n = 431), 26.4% was between 30 and 39 (n = 395), 20.0% was between 40 and 49 (n = 300), and 23.0% was 50 or older (n = 344). Ten participants did not indicate their age. It was planned to have at least 256 participants per country with a total of 1,024 participants. In all countries, participants
completed the ZKA-PQ anonymously. This research complies with the ethical rules of the American
Psychological Association (ARA) and with the ethical rules in force in the universities of each country involved. RESULTS
Internal Consistency and Influence of Gender, Age, and Country
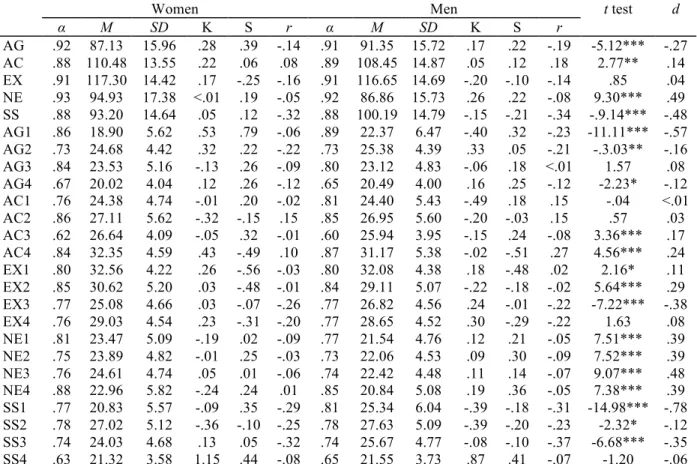
In the full French-speaking sample the internal consistencies, using Cronbach's alphas, were similar to those found in the Spanish and American samples. They were .92, .89, .91, .93, and .89 for AG, AC, EX, NE, and SS, respectively (Mdn = .91). For the 20-facet scales they ranged from .62 to .88 (Mdn = .78). The internal
consistencies for women and men were very similar (see Table 2). Both had a mean internal consistency of .90 for domains and .77 for facets. The internal consistencies were also very similar across countries, with a mean internal consistency ranging from .90 to .91 for the domains and from .76 to .79 for the facets. For the total sample, dimension kurtosis ranged from -.18 to .17 (Mdn = .10) and dimension skewness from -.18 to .30 (Mdn = .07). For the facet scales, kurtosis ranged from -.28 to .43 (Mdn = .13) and skewness from -.55 to 1.01 with only one value above 1 (Mdn = -.04). Thus kurtosis and skewness can be consistently considered as close to zero, indicating that values tend to be normally distributed. The kurtosis and skewness values were similar for women and men (see Table 2) and across the four French-speaking countries.
Concerning gender differences for the dimensions, men had nonnegligible higher scores on AG and SS, and women had higher scores on NE (d > .20). The gender difference on AG was essentially due to the difference on AG1 and the difference on SS essentially attributable to differences on SS1 and SS3. The gender difference on NE was due to differences on all facets of this dimension. Moreover, gender differences were similar across the four French-speaking countries studied. Globally, age seems to be negatively associated with AG (r = -.15), EX (r = -.15), and SS (r = -.31), and positively with AC (r = .13). The negative correlation observed for AG was due to AG1, AG2, and AG4; the negative correlation observed for EX was due to EX3 and EX4; and the negative correlation observed for SS was due to SS1, SS2, and SS3 (r ≤ -.12). The positive correlation observed for AC was due to AC2 and AC4 (r > .15). Correlations between age and the ZKA-PQ's dimensions were very similar across genders (ρ = .86) and countries (M ρ = .84). Correlations with age were significantly different across genders only for three facet scales, AG1, AC1, and AC4 (p < .001). To assess the differences for correlations with age across the four countries, we first resampled to define the distribution of the difference between the lowest and the highest Zk (Zk = ½ln [(1 + rk)/(1 - rk)] with k in {1, 2, 3,4}) with the null hypothesis claiming that
the theoretical correlation is the same in the four samples and taking into account the size of the four samples. From this distribution, we determined the smallest Z difference that was significant at the level of α = .05, in our case ∆Z = .20. Correlations with age can be considered as similar across countries for all dimensions with
significant differences on only three facet scales: AC4 (∆Z = .25, p = .006), EX1 (∆Z = .21, p = .03), and NE2
(∆Z = .27, p = .003).
Globally, the country variable, after correcting for age, had a small effect on the mean differences for the five personality dimensions, F(3, 1482) = 11.23, p < .001, η2 = .02. More precisely, these differences were associated
with a small effect for AG, F(3,1482) = 15.05, p < .001, η2 = .03; EX, F(3,1482) = 16.87, p < .001, η2 = .03; and
NE, F(3, 1482) = 15.02, p < .001, η2 = .03. Participants from Belgium had slightly higher scores on AG and
slightly lower scores on EX than the participants from the three other countries. Participants from Belgium and France had slightly higher scores on NE compared to the Canadian and the Swiss participants. Concerning facet scales, differences on AG1, AG2, AG4, AC3, AC4, EX2, EX3, NE1, NE3, NE4, SS1, SS2, and SS4 were associated with a small effect size (η2 < .06). Only the differences observed on EX1, F(3, 1482) = 31.26, p < .001, η2 = .06, were associated with medium effect size. Globally the country variable had only a very moderate
TABLE 2.-Internal consistencies, descriptives, kurtosis, skewness, correlations with age, and differences
between women and men.
Women Men t test d
α M SD K S r α M SD K S r AG .92 87.13 15.96 .28 .39 -.14 .91 91.35 15.72 .17 .22 -.19 -5.12*** -.27 AC .88 110.48 13.55 .22 .06 .08 .89 108.45 14.87 .05 .12 .18 2.77** .14 EX .91 117.30 14.42 .17 -.25 -.16 .91 116.65 14.69 -.20 -.10 -.14 .85 .04 NE .93 94.93 17.38 <.01 .19 -.05 .92 86.86 15.73 .26 .22 -.08 9.30*** .49 SS .88 93.20 14.64 .05 .12 -.32 .88 100.19 14.79 -.15 -.21 -.34 -.9.14*** -.48 AG1 .86 18.90 5.62 .53 .79 -.06 .89 22.37 6.47 -.40 .32 -.23 -11.11*** -.57 AG2 .73 24.68 4.42 .32 .22 -.22 .73 25.38 4.39 .33 .05 -.21 -.3.03** -.16 AG3 .84 23.53 5.16 -.13 .26 -.09 .80 23.12 4.83 -.06 .18 <.01 1.57 .08 AG4 .67 20.02 4.04 .12 .26 -.12 .65 20.49 4.00 .16 .25 -.12 -2.23* -.12 AC1 .76 24.38 4.74 -.01 .20 -.02 .81 24.40 5.43 -.49 .18 .15 -.04 <.01 AC2 .86 27.11 5.62 -.32 -.15 .15 .85 26.95 5.60 -.20 -.03 .15 .57 .03 AC3 .62 26.64 4.09 -.05 .32 -.01 .60 25.94 3.95 -.15 .24 -.08 3.36*** .17 AC4 .84 32.35 4.59 .43 -.49 .10 .87 31.17 5.38 -.02 -.51 .27 4.56*** .24 EX1 .80 32.56 4.22 .26 -.56 -.03 .80 32.08 4.38 .18 -.48 .02 2.16* .11 EX2 .85 30.62 5.20 .03 -.48 -.01 .84 29.11 5.07 -.22 -.18 -.02 5.64*** .29 EX3 .77 25.08 4.66 .03 -.07 -.26 .77 26.82 4.56 .24 -.01 -.22 -7.22*** -.38 EX4 .76 29.03 4.54 .23 -.31 -.20 .77 28.65 4.52 .30 -.29 -.22 1.63 .08 NE1 .81 23.47 5.09 -.19 .02 -.09 .77 21.54 4.76 .12 .21 -.05 7.51*** .39 NE2 .75 23.89 4.82 -.01 .25 -.03 .73 22.06 4.53 .09 .30 -.09 7.52*** .39 NE3 .76 24.61 4.74 .05 .01 -.06 .74 22.42 4.48 .11 .14 -.07 9.07*** .48 NE4 .88 22.96 5.82 -.24 .24 .01 .85 20.84 5.08 .19 .36 -.05 7.38*** .39 SS1 .77 20.83 5.57 -.09 .35 -.29 .81 25.34 6.04 -.39 -.18 -.31 -14.98*** -.78 SS2 .78 27.02 5.12 -.36 -.10 -.25 .78 27.63 5.09 -.39 -.20 -.23 -2.32* -.12 SS3 .74 24.03 4.68 .13 .05 -.32 .74 25.67 4.77 -.08 -.10 -.37 -6.68*** -.35 SS4 .63 21.32 3.58 1.15 .44 -.08 .65 21.55 3.73 .87 .41 -.07 -1.20 -.06
Note. For d values, a negative value indicates that men have higher scores and a positive value indicates that women have higher scores. AG
= Aggressiveness; AC = Activity; EX = Extraversion; NE = Neuroticism; SS = Sensation Seeking; AG1 = physical aggression; AG2 = verbal aggression; AG3 = anger; AG4 = hostility; AC1 = work compulsion; AC2 = general activity; AC3 = restlessness; AC4 = work energy; EX1 = positive emotions; EX2 = social warmth; EX3 = exhibitionism; EX4 = sociability; NE1 = anxiety; NE2 = depression; NE3 = dependency; NE4 = low self-esteem; SS1 = thrill and adventure seeking; SS2 = experience seeking; SS3 = disinhibition; SS4 = boredom
susceptibility/impulsivity. *p < .05. **p <.01.***p < .001.
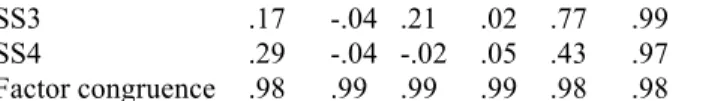
TABLE 3.-Factorial structure (principal axis) of the French version of the ZKA-PQ and congruence coefficients
obtained after comparison with the original version. Factor
ZKA-PQ AG AC EX NE SE Facet congruence
AGI .60 -.03 -.12 -.03 .27 .99 AG2 .76 .01 .10 .00 .17 .99 AG3 .84 .09 -.01 .21 .03 .99 AG4 .68 -.04 -.29 .35 .11 1.00 AC1 .02 .66 -.06 .06 <.01 .99 AC2 .01 .61 .08 -.03 .11 .99 AC3 .40 .49 .12 .24 .13 .94 AC4 -.13 .66 .21 -.21 -.23 .99 EX1 -.20 .22 .61 -.41 .02 .99 EX2 -.14 .03 .76 -.16 .00 .99 EX3 .24 .02 .46 -.19 .30 .97 EX4 <.01 .08 .77 -.09 .18 .99 NE1 .24 .10 -.11 .78 -.06 .94 NE2 .17 -.03 -.25 .72 -.02 1.00 NE3 .00 -.02 .00 .77 -.11 .99 NE4 -.01 -.04 -.32 .81 -.02 1.00 SS1 .12 .08 -.02 -.14 .68 .99 SS2 .01 .03 .15 -.07 .69 .98
SS3 .17 -.04 .21 .02 .77 .99
SS4 .29 -.04 -.02 .05 .43 .97
Factor congruence .98 .99 .99 .99 .98 .98
Note. The congruence coefficients were obtained by comparing the matrix of the French version of the ZKA-PQ with the Spanish calibration
sample, which was the larger sample of the original validation study. Loadings above .40 in absolute magnitude are shown in bold. ZKA-PQ = Zuckerman-Kuhlman-Aluja Personality Questionnaire; AG = Aggressiveness; AC = Activity; EX = Extraversion; NE = Neuroticism; SS = Sensation Seeking; AG1 = physical aggression; AG2 = verbal aggression; AG3 = anger; AG4 = hostility; AC1 = work compulsion; AC2 = general activity; AC3 = restlessness; AC4 = work energy; EX1 = positive emotions; EX2 = social warmth; EX3 = exhibitionism; EX4 = sociability; NE1 = anxiety; NE2 = depression; NE3 = dependency; NE4 = low self-esteem; SS1 = thrill and adventure seeking; SS2 = experience seeking; SS3 = disinhibition; SS4 = boredom susceptibility/impulsivity.
Replicability of the Factor Structure Across Countries
On the full sample, a principal axis (PA) factor analysis with varimax rotation on the 20 facets allowed extracting five factors using Cattell's criterion, Kaiser criterion, and Velicer's minimum average partial (MAP) test (O'Connor, 2000; Velicer, 1976). These factors explained 67.16% of the total variance. The initial six eigenvalues were4.65, 3.63, 2.18, 1.57, 1.41, and 0.86. A one-to-one association was observed between the five factors and the five main dimensions of the ZKA-PQ. Factor 1 correlated with NE (r = .98), Factor 2 with AG (r = .95), Factor 3 with EX (r = .94), Factor 4 with SS (r = .97), and Factor 5 with AC (r = .98).
The loading matrix of the French version of the ZKA-PQ (see Table 3) was compared with the three loading matrices of the original Spanish and English versions presented by the authors of this questionnaire (Aluja et al., 2010, p. 420). Comparison with these three matrices was achieved calculating congruence coefficients (CCs) ranging from -1 to +1 (Haven & ten Berge, 1977; Wrigley & Neuhaus, 1955). CCs higher than .90 indicated a high structural equivalence, CCs ranging from .81 to .90 indicated a borderline structural equivalence, and CCs equal to or below .80 indicated a poor structural equivalence. A CC was calculated for the complete matrix, giving an estimation of the global structural equivalence; for each column, giving an estimation of the structural equivalence for each dimension; and for each line, giving an estimation of the structural equivalence for each facet scale (e.g., Rossier, Rigozzi, Charvoz, & Bodenmann, 2006). Comparing the French matrix with the matrix of the Spanish calibration sample, we found a total CC of .98. The CCs for dimensions ranged from .98 to .99 (Mdn = .99). The CCs for facet scales ranged from .94 to 1.00 (Mdn = .99). Comparing the French matrix with the matrix of the Spanish validation sample, we found a total CC of .98. The CCs for dimensions ranged from .97 to .99 (Mdn = .98). The CCs for facet scales ranged from .91 to 1.00 (Mdn = .99). Comparing the French matrix with the American matrix, we found a total CC of .98. The CCs for dimensions ranged from .96 to .99 (Mdn = .99). The CCs for facet scales ranged from .95 to 1.00 (Mdn = .99). The factor structure of the ZKA-PQ seems to replicate very well across the three studied languages.
To assess the structural replicability of the ZKA-PQ across the four French-speaking countries, a principal axis factor analysis with varimax rotation on the 20 facets was conducted for each country. For Belgium, the five-factor solution explained 66.61 % of the total variance and the first six eigenvalues were 4.54, 3.54, 2.28, 1.63, 1.34, and 0.95. For Canada, the five-factor solution explained 69.41% of the total variance and the first six eigenvalues were 4.99, 3.76, 2.16, 1.61, 1.37, and 0.82. For France, the five-factor solution explained 68.70% of the total variance and the first six eigenvalues were 4.56, 3.83, 2.37, 1.51, 1.47, and 0.87. For Switzerland, the five-factor solution explained 67.39% of the total variance and the first six eigenvalues were 4.31, 3.73, 2.14, 1.78, 1.52, and 0.88. In each French-speaking country, Cattell's criterion, Kaiser criterion, and Velicer's MAP test indicated to consider five factors. A one-to-one association was observed between the five factors and ZKA-PQ's five main dimensions for each country. Considering all six possible comparisons among the four French-speaking countries, we found a mean total CC of .97. The mean CCs for dimensions ranged from .97 to .98 (Mdn = .97). The mean CCs for facet scales ranged from .86 to .99 (Mdn = .98). Only one facet scale, SS4, was associated with a mean CC below .90, indicating a borderline structural equivalence. Thus the structural replicability across the four French-speaking countries is globally very high.
TABLE 4.-Goodness-of-fit indexes for ZKA-PQ models and for the factorial structure of each domain.
ZKA-PQ χ2 df p GFI CFI TLI RMSEA
Oblique five-factor models
Simple structure 3994.50 160 <.001 .78 .72 .67 .13
Correlated error terms (MI > 50) 1332.92 135 <.001 .92 .91 .88 .08 Model for each of the five ZKA-PQ domains
Aggressiveness 33.72 2 <.001 .99 .99 .96 .10
Activity 182.70 2 <.001 .94 .83 .50 .25
Activity (eAC2 -eAC3) 7.01 1 .008 .99 .99 .97 .06
Extraversion 45.54 2 <.001 .98 .98 .93 .12
Neuroticism 81.96 2 <.001 .98 .97 .92 .16
Sensation 7.30 2 .03 .99 .99 .99 .04
Seeking
Note. ZKA-PQ = Zuckerman-Kuhlman-Aluja Personality Questionnaire; GFI = goodness-of-fit index; CFI = comparative fit index; TLI =
Tucker-Lewis Index; RMSEA = root mean square error of approximation; MI = modification index.
Construct Validity and Level of Invariance Across the Four French-Speaking Countries
Confirmatory factor analyses (CFAs) were performed using maximum likelihood estimation to assess the construct validity of the French version of the ZKA-PQ. The normality of the variables allows for the use of such an estimation method. These analyses were made using the AMOS statistical package (Arbuckle, 2006). To achieve model identification, regression coefficients of the error terms over the endogenous variables were fixed to 1. We used several criteria of model fit (see Bollen & Long, 1993), and more precisely the goodness-of-fit index (GFI), comparative fit index (CFI), Tucker-Lewis Index (TLI), and the root mean square error of approximation (RMSEA). A model is considered to have an acceptable fit if the GFI, CFI, and TLI values are about .90 or above. An RMSEA of about .05 or less would indicate a close fit and a value of about .08 or less would indicate a reasonable fit of the model.
Table 4 shows the results of three oblique models, which were successively tested, and the results for each of the five ZKA-PQ domains assessed separately. Concerning the three oblique models, the results are very similar to those observed for the original English and Spanish versions of the ZKA-PQ (Aluja et al., 2010). The simple structure model showed a very poor fit with GFI, CFI, and TLI well below .90, and an RMSEA above .08. Taking into account the secondary loadings above .20 allowed an almost acceptable fit, and including covariation between error terms associated with a modification index above 50 even allowed acceptable goodness-of-fit indexes. Considering the five dimensions separately, we again observed very similar results to those observed for the original versions of the ZKA-PQ. The goodness-of-fit indexes indicated a good fit for four out of the five dimensions. More precisely, the fit was very good for AG, EX, NE, and SS, but poor for AC. In fact, the poor fit observed for AC was due to a covariation between the error terms of general activity (AC2) and restlessness (AC3). When taking this covariation into consideration, the goodness-of-fit indexes indicated an acceptable fit.
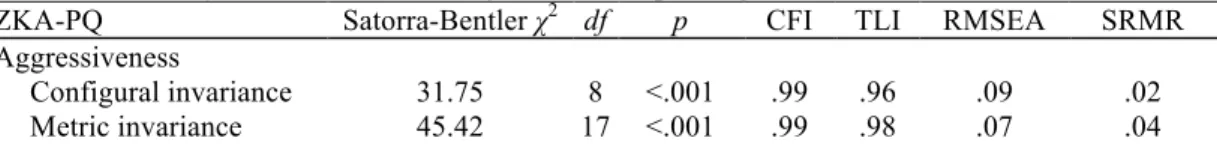
The French version of the ZKA-PQ might be used in several countries. To decide if it would be necessary to create country-specific norms, the level of invariance of the five ZKA-PQ dimensions was tested using
multigroup CFAs. To test the configural, metric, and scalar invariance across the four French-speaking countries, a sequential testing procedure method suggested by Steenkamp and Baumgartner (1998) was used. These analyses were performed using Mplus (Mùthen, & Mùthen, 2010) which does not compute GFI. For this reason we took into account the standardized root mean square residual (SRMR), which should be below .05 in case of acceptable fit. Note that for Activity, the alternative structure taking into account the covariation between AC2 and AC3 was considered. The results presented in Table 5 indicate that the five dimensions of the ZKA-PQ reached the three successively tested levels of invariance with goodness-of-fit indexes indicating a usually acceptable fit. More precisely, CFI and TLI were always above .90, whereas RMSEA and SRMR were
sometimes higher than .08 and .05, respectively. It is not uncommon to observe discrepancies between goodness-of-flt indexes, and globally these values can be considered as acceptable and similar to the results obtained with different psychological measurement tools (Spini, 2003).
TABLE 5.-Level of invariance across the four French-speaking countries.
ZKA-PQ Satorra-Bentler χ2 df p CFI TLI RMSEA SRMR
Aggressiveness
Configural invariance 31.75 8 <.001 .99 .96 .09 .02
Scalar invariance 91.68 26 <.001 .97 .97 .08 .05 Activity (eAC2 - eAC3)
Configural invariance 7.40 4 >.05 1.00 .98 .05 .01 Metric invariance 13.05 13 >.05 1.00 1.00 .01 .02 Scalar invariance 102.97 22 <.001 .92 .91 .10 .06 Extraversion Configural invariance 58.07 8 <.001 .97 .91 .13 .03 Metric invariance 69.77 17 <.001 .97 .95 .09 .05 Scalar invariance 168.30 26 <.001 .91 .92 .12 .07 Neuroticism Configural invariance 86.66 8 <.001 .97 .91 .16 .03 Metric invariance 97.07 17 <.001 .97 .96 .11 .03 Scalar invariance 185.94 26 <.001 .94 .95 .13 .05 Sensation Seeking Configural invariance 19.52 8 .01 .99 .98 .06 .02 Metric invariance 33.66 17 .009 .99 .98 .05 .04 Scalar invariance 143.44 26 <.001 .92 .92 .11 .07
Note. ZKA-PQ = Zuckerman-Kuhlman-Aluja Personality Questionnaire; CFI = comparative fit index; TLI = Tucker-Lewis Index; RMSEA =
root mean square error of approximation; SRMR = standardized root mean square residual.
DISCUSSION
This study confirms that the French version of the ZKA-PQ has similar psychometric properties as the original English and Spanish versions of this questionnaire. This suggests that the revised AFFM replicates well in the four French-speaking cultures considered. Indeed, reliability coefficients for this version were similar to those found for the original versions and a series of factor analyses confirmed that the normative structure replicated well and was stable within this French-speaking context. Moreover, multigroup CFAs have shown that the ZKA-PQ reaches scalar invariance across all four countries. Mean scores were slightly different for women and men, with women scoring higher on Neuroticism but lower on Impulsive Sensation Seeking. Globally, mean score differences across countries were small.
More precisely, internal consistencies for this French version and across countries were all similar to those found in the American and Spanish samples (Aluja et al., 2010), with coefficients above or close to .90 for the five main dimensions, and values close to .80 for facet scales. The internal consistency was below .70 only for two facet scales, hostility and restlessness, as also observed in the two normative samples. Moreover, the internal consistencies were very similar for women and men. Kurtosis and skewness indicated that the scores tend to be normally distributed for both women and men and in all four French-speaking countries. Comparing the values obtained with this ZKA-PQ with those obtained with the ZKPQ, the internal consistencies of the ZKA-PQ are higher and the kurtosis and skewness values similar (Rossier, Verardi, et al., 2008). Gomà-i-Freixanet and colleagues (2004) reported that the internal reliability for Agg-Host is usually lower for some language versions of the ZKPQ. This does not seem to be the case with this newly developed ZKA-PQ.
The main gender differences observed in this study—higher scores on Neuroticism for women and higher scores on Aggressiveness and Impulsive Sensation Seeking for men—were consistent across the four French-speaking countries and confirmed previous results about gender differences with the AFFM (Aluja et al., 2002; De Pascalis & Russo, 2003; Rossier, Verardi, et al., 2008; Zuckerman, 2002), and previous results obtained with the original versions of the ZKA-PQ (Aluja et al., 2010), except for Extraversion with no difference between women and men in our sample. At the facet level, the gender difference was even associated with a medium effect size for two facets, with men scoring higher on physical aggression and thrill and adventure seeking. The gender differences obtained using the French version of the ZKA-PQ are in line with those observed using the revised NEO Personality Inventory (Rossier, Dahourou, & McCrae, 2005).
Concerning adult trait development, a stable negative correlation was observed between age and Aggressiveness, Extraversion, and Sensation Seeking, and a positive correlation was observed between age and Activity, mainly due to work energy. This pattern of correlations was very similar to those observed by the authors of the ZKA-PQ in their Spanish and American samples. These results are again in line with those observed using the ZKZKA-PQ, with a negative correlation between age and Impulsive Sensation Seeking, Neuroticism-Anxiety, and Sociability (Rossier et al., 2007). In this study, correlations with age were also very stable across gender and countries,
confirming results obtained using the Revised NEO Personality Inventory (McCrae et al., 2002). More broadly, these present results converge with the meta-analytic findings of Roberts, Walton, and Viechtbauer (2006) about mean-level change in personality traits across adulthood.
The underlying structure of the French version of the ZKA-PQ obtained by applying a principal analysis with varimax rotation confirmed the theoretical structure suggested by the AFFM. Indeed, there was a one-to-one correspondence between factors and the main dimensions of the inventory with very high correlations (r > .94). Comparing the structure obtained using this French version with the matrices obtained in the Spanish and American samples, an almost perfect replication was observed with very high total congruence coefficients. In addition, replicability was almost perfect for the dimensions and facet scales (Mdn = .99). This confirms and demonstrates that the AFFM and its revision are replicable in a French-speaking cultural setting (Rossier et al., 2007; Rossier, Verardi, et al., 2008). This study included samples from four countries where French is an official language and a common mother tongue of a significant part of the population. We were thus able to assess the structural stability of the French version of the ZKA-PQ across these countries. Results clearly indicated that the structure is robust across these four French-speaking countries, with a very high mean total congruence
coefficient. The construct validity was assessed using CFAs. These analyses showed that an oblique model should be considered. As already observed in several studies (Aluja, Garcia, Garcia, & Seisdedos, 2005; Rossier, Verardi, et al., 2008) as well as with the original English and Spanish versions (Aluja et al., 2010), secondary loadings and covariation between some error terms have to be included in the model to obtain acceptable goodness-of-fit indexes. When considering the five dimensions separately and including a covariation between two facet scales for Activity, the goodness-of-fit indexes indicated a close fit as expected. Even though secondary loadings and particularly correlated residuals are less than optimal for a measurement model, this is expected with personality trait inventories measuring complex hierarchical models (Church & Burke, 1994). Several recent studies claimed that culture-level mean scores cannot be compared because personality inventories do not reach scalar invariance across cultures (Heine et al., 2008; Heine, Lehman, Peng, & Greenholtz, 2002; Oishi & Roth, 2009). This would, of course, imply that culture-specific norms have to be developed (Duarte & Rossier, 2008). In our study, one language version was used in four countries that might have similar cultures but also some cultural specificities. Indeed, according to Hofstede (2001, pp. 500-501) French-speaking Belgians, Canadians, Swiss, and French have quite similar scores on the power distance, individualism/ collectivism, and masculinity/femininity dimensions. Scores were more contrasted on the uncertainty avoidance dimension with higher scores in the French-speaking part of Belgium and in France and lower scores in the French-speaking parts of Canada and Switzerland. Scores for language regions were not reported for the long-/short-term orientation dimension. To assess if unique norms would be sufficient, we analyzed the level of invariance of the five main dimensions of the ZKA-PQ across our four samples. It should be noted that the evaluation of the level of invariance across cultures or subgroups of personality inventories is only rarely assessed (Marsh et al., 2010). The procedure suggested by Steenkamp and Baumgartner (1998) was used to evaluate the level of invariance of the five main dimensions of the ZKA-PQ across the four French-speaking countries. All five dimensions seemed to reach configural, metric, and scalar invariance according to the CFI and the TLI. Results were more contrasted considering the RMSEA and the SRMR. However,
discrepancies between goodness-of-fit indexes are not uncommon and the level of fit obtained in this study can be considered as acceptable according to the results obtained in similar studies (Spini, 2003).
This study has several limitations. Even though we tried to have an equivalent number of participants from different age groups within each country, mean age across countries differed slightly. Moreover, the sample size was different from one country to the other. However, this research clearly indicates that the revised AFFM replicated well in a French-speaking context and across the four studied countries. This replicability was not only at the dimension level, but also for the facet scales. These results confirm that the ZKA-PQ is certainly an interesting alternative to assess both lower and higher order personality traits for applied or research purposes. ACKNOWLEDGMENTS
We would like to thank Dr. Jean-Philippe Antonietti and Grégory Zecca for help with data analysis. REFERENCES
Allik, J. (2005). Personality dimension across cultures. Journal of Personality Disorders, 19, 212-232.
Aluja, A., Garcia, L. F., Cuevas, L., & Garcia, O. (2007). The MCMI-III personality disorders scores predicted by the NEO-FFI-R and the ZKPQ-50-CC: A comparative study. Journal of Personality Disorders, 21, 58-71.
Aluja, A., Garcia, O., & Garcia, L. F. (2002). A comparative study of Zuck-erman's three structural models for personality through the NEO-PI-R, ZKPQ-III, EPQ-RS and Goldberg's 50-bipolar adjectives. Personality and Individual Differences, 33, 713-725.
Aluja, A., Garcia, O., Garcia, L. F, & Seisdedos, N. (2005). Invariance of the "NEO-PI-R" factor structure across exploratory and confirmatory factor analyses. Personality and Individual Differences, 38, 1879-1889.
Aluja, A., Kuhlman, M., & Zuckerman, M. (2010). Development of the Zuckerman-Kuhlman-Aluja Personality Questionnaire (ZKA-PQ): A factor/facet version of the Zuckerman-Kuhlman Personality Questionnaire (ZKPQ). Journal of Personality Assessment, 92, 416-431.
Aluja, A., Rossier, J., Garcia, L. F, Angleitner, A., Kuhlman, M., & Zuckerman, M. (2006). A cross-cultural shortened form of the ZKPQ (ZKPQ-50-CC) adapted to English, French, German, and Spanish languages. Personality and Individual Differences, 41, 619-628. doi:10.1016/j.paid.2006.03.001
Angleitner, A., Riemann, R., & Spinath, F. M. (2004). Investigating the ZKPQ-III-R: Psychometric properties, relations to the Five-factor model, and genetic and environmental influences on its scales and facets. In R. M. Stelmack (Ed.), On the psychobiology of personality:
Essays in honor of Marvin Zuckerman (pp. 89-105). New York, NY: Elsevier Science.
Arbuckle, J. L. (2006). Amos (Version 7.0) [Computer program]. Chicago, IL: SPSS.
Barrett, P. T., Petrides, K. V., Eysenck, S. B. G., & Eysenck, H. J. (1998). The Eysenck Personality Questionnaire: An examination of the factorial similarity of P, E, N, and L across 34 countries. Personality and Individual Differences, 25, 805-819.
Bollen, K. A., & Long, J. S. (1993). Testing structural equation models. New York, NY: Sage.
Buss, A. H., & Perry, M. (1992). The Aggression Questionnaire. Journal of Personality and Social Psychology, 63, 452-459.
Church, A. T., & Burke, P. J. (1994). Exploratory and confirmatory tests of the Big Five and Tellegen's three- and four-dimensional models.
Journal of Personality and Social Psychology, 66, 93-114.
De Pascalis, V., & Russo, P. M. (2003). Zuckerman-Kuhlman Personalilty Questionnaire: Preliminary results of the Italian version.
Psychological Reports, 92, 965-974.
Digman, J. M. (1990). Personality structure: Emergence of the Five-factor model. Annual Review of Psychology, 41, 417-440.
Duarte, M. E., & Rossier, J. (2008). Testing and assessment in an international context: Cross- and multi-cultural issues. In J. Athanasou & R. Van Esbroeck (Eds.), International handbook of career guidance (pp. 489-510). New York, NY: Springer Science.
Geisinger, K. F. (1994). Cross-cultural normative assessment: Translation on adaptation issues influencing the normative interpretation of assessment instruments. Psychological Assessment, 6, 304-312.
Gomà-i-Freixanet, M., Valero, S., Punti, J., & Zuckerman, M. (2004). Psychometric properties of the Zuckerman-Kuhlman Personality Questionnaire in a Spanish sample. European Journal of Psychological Assessment, 20, 134-146.
Haven, S., & ten Berge, J. M. F. (1977). Tucker's coefficient of congruence as a measure of factorial invariance: An empirical study. Unpublished manuscript, University of Groningen, Groningen, The Netherlands.
Heine, S. J., Buchtel, E. E., & Norenzayan, A. (2008). What do cross-national comparisons of personality traits tell us? The case of conscientiousness. Psychological Science, 19, 309-313.
Heine, S. J., Lehman, D. R., Peng, K., & Greenholtz, J. (2002). What's wrong with crosscultural comparisons of subjective Likert scales?: The reference-group effect. Journal of Personality and Social Psychology, 82, 903-918.
Hofstede, G. (2001). Culture's consequence: Comparing values, behaviors, and organizations across nations (2nd ed.). Thousand Oaks, CA: Sage.
Lynam, D. R., Smith, G. T., Cyders, M. A., Fischer, S., & Whiteside, S. P. (2007). The UPPS-P questionnaire measure of five disposition to
rash action. Unpublished technical report, Purdue University, West Lafayette, IN.
Marsh, H. W., Ludtke, O., Muthen, B. O., Asparouhov, T., Morin, A. J. S., Trautwein, U., & Nagengast, B. (2010). A new look at the Big Five factor structure through exploratory structural equation modeling. Psychological Assessment, 22, 471-491.
McCrae, R. R., & Costa, P. T., Jr. (1999). A five-factor theory of personality. In L. A. Pervin & O. P. John (Eds.), Handbook of personality:
Theory and research (2nd ed., pp. 139-153). New York, NY: Guilford.
McCrae, R. R., Costa, P. T., Jr., Terracciano, A., Parker, W. D., Mills, C. J., De Fruyt, F, & Mervielde, I. (2002). Personality traits
development from age 12 to age 18: Longitudinal, cross-sectional, and cross-cultural analyses. Journal of Personality and Social Psychology,
83, 1456-1468.
O'Connor, B. P. (2000). SPSS and SAS programs for determining the number of components using parallel analysis and Velicer's MAP test.
Behavior Research Methods, Instrumentation, and Computers, 32, 396-402.
Oishi, S., & Roth, D. P. (2009). The role of self-reports in culture and personality research: It is too early to give up on self-reports. Journal
of Research in Personality, 43, 107-109.
Rigozzi, C., Rossier, J., Dahourou, D., Adjahouisso, M., Ah-Kion, J., Amoussou-Yeye, D., ... Verardi, S. (2009). A cross-cultural study of the higher-order structures underlying personality disorders in French-speaking Africa and Switzerland. Journal of Personality Disorders,
23, 175-186.
Roberts, B. W, Walton, K., & Viechtbauer, W (2006). Patterns of mean-level change in personality traits across the life course: A meta-analysis of longitudinal studies. Psychological Bulletin, 132, 1-25.
Rossier, J. (2005). A review of the cross-cultural equivalence of frequently used personality inventories. International Journal for
Educational and Vocational Guidance, 5, 175-188. doi:10.1007/sl0775-005-8798-x
Rossier, J., Aluja, A., Garcia, L. F, Angleitner, A., De Pascalis, V., Wang, W., ... Zuckerman, M. (2007). The cross-cultural generalizability of Zuckerman's Alternative Five-factor model of personality. Journal of Personality Assessment, 89, 188-196.
Rossier, J., Dahourou, D., & McCrae, R. R. (2005). Structural and mean level analyses of the Five-factor model and locus of control: Further evidence from Africa. Journal of Cross-Cultural Psychology, 36, 225-248. doi10.1177/0022022104272903
Rossier, J., Meyer de Stadelhofen, F, & Berthoud, S. (2004). A comparison of the hierarchical structures of the NEO-PI-R and of the 16PF5.
European Journal of Psychological Assessment, 20, 27-38. doi:10.1027//1015-5759.20.1.27
Rossier, J., Rigozzi, C, Charvoz, L., & Bodenmann, G. (2006). Marital satisfaction: Psychometric properties of the PFB and comparison with the DAS. Swiss Journal of Psychology, 65, 55-63. doi:10.1024/1421-0185.65.1.55
Rossier, J., Rigozzi, C., & Personality Across Culture Research Group. (2008). Personality disorders and the Five-factor model among French speakers in Africa and Europe. Canadian Journal of Psychiatry, 53, 534-544.
Rossier, J., Verardi, S., Massoudi, K., & Aluja, A. (2008). Validation of the Zuckerman-Kuhlman Personality Questionnaire (ZKPQ) at the domain and facet level in a French-speaking sample. International Journal of Clinical and Health Psychology, 8, 203-217.
Schmitz, P. G. (2004). On the alternative Five-factor model: Structure and correlates. In R. M. Stelmack (Ed.), On the psychobiology of
personality: Essays in honor of Marvin Zuckerman (pp. 65-87). New York, NY: Elsevier Science.
Spini, D. (2003). Measurement equivalence of 10 value types from the Schwartz value survey across 21 countries. Journal of Cross-Cultural
Psychology, 34, 3-23.
Steenkamp, J.-B. E. M., & Baumgartner, H. (1998). Assessing measurement invariance in cross-national consumer research. Journal of
Consumer Research, 25, 78-90.
Van de Vijver, F., & Leung, K. (1997). Methods and data analysis for cross-cultural research. Thousand Oaks, CA: Sage.
Velicer, W. F. (1976). Determining the number of components from the matrix of partial correlations. Psychometrika, 41, 321-327.
Verardi, S., Dahourou, D., Ah-Kion, U., Bhowon, U., Ng Tseung, C., Amoussou-Yeye, D., ... Rossier, J. (2010). Psychometric properties of the Marlowe-Crowne Social Desirability Scale in eight African countries and Switzerland. Journal of Cross-Cultural Psychology, 41, 19-34. doi10.1177/0022022109348918
Wrigley, C. C., & Neuhaus, J. O. (1955). The matching of two sets of factors. American Psychologist, 10, 418-419.
Wu, Y.-X., Wang, W., Du, W.-Y, Li, J., Jiang, X.-F, & Wang, Y.-H. (2000). Development of a Chinese version of the Zuckerman-Kuhlman Personality Questionnaire: Reliabilities and gender/age effects. Social Behaviour and Personality, 28, 241-250.
Zuckerman, M. (2002). Zuckerman-Kuhlman Personality Questionnaire (ZKPQ): An alternative five-factorial model. In B. de Raad & M. Perugini (Eds.), Big Five assessment (pp. 377-396). Göttingen, Germany: Hogrefe & Huber.
Zuckerman, M., Kuhlman, D. M., & Camac, C. (1988). What lies beyond E and N? Factor analyses of scales believed to measure basic dimensions of personality. Journal of Personality and Social Psychology, 54, 96-107.
Zuckerman, M., Kuhlman, D. M., Joireman, J., Teta, P., & Kraft, M. (1993). A comparison of three structural models for personality: The Big Three, the Big Five, and the Alternative Five. Journal of Personality and Social Psychology, 65, 757-768.
Zuckerman, M., Kuhlman, D. M., Thornquist, M., & Kiers, H. (1991). Five (or three) robust questionnaire scale factors of personality without culture. Personality and Individual Differences, 12, 929-941.