DEVELOPMENT OF NEW AFM BASED
METHODOLOGIES FOR THE QUANTITATIVE
MAGNETIC CHARACTERIZATION OF
NANOPARTICLES FOR BIOMEDICAL APPLICATIONS
Thèse en cotutelle
Doctorat en génie des matériaux et de la métallurgie
Livia Angeloni
Université Laval
Québec, Canada
Doctorat (Ph. D.)
et
Sapienza University
Rome, Italy
Doctorat (Ph. D.)
© Livia Angeloni, 2017
DEVELOPMENT OF NEW AFM BASED
METHODOLOGIES FOR THE QUANTITATIVE
MAGNETIC CHARACTERIZATION OF
NANOPARTICLES FOR BIOMEDICAL APPLICATIONS
Thèse en cotutelle
Doctorat en génie des matériaux et de la métallurgie
Livia Angeloni
Sous la direction de:
Diego Mantovani, directeur de recherche
Marco Rossi, directeur de cotutelle
iii
Resumé
L'objectif du projet de doctorat est le développement d'une procédure innovante de mesure et post-traitement des données pour obtenir des informations quantitatives sur les paramètres magnétiques de nanoparticules magnétiques individuelles par l'utilisation de la Microscopie à Force Magnétique (MFM).
Les nanoparticules magnétiques (MNP), grâce à leurs propriétés magnétiques particulières (monodomaine, superparamagnétisme, etc.) et leur taille nanométrique, conviennent à plusieurs applications biomédicales, telles que les systèmes d'administration de médicaments, les traitements de hyperthermie magnétique, l'étiquetage cellulaire, les agents de contraste pour l'imagerie a résonance magnétique (IRM). La conception de ces techniques requiert une connaissance détaillée des propriétés magnétiques des nanomatériaux utilisès, comme l'aimantation de saturation Ms, le champ magnétique de saturation Hs, la coercivité Hc. Les techniques standard,
comme les dispositifs supraconducteurs à interférence quantique (SQUID) ou la magnétomètrie à échantillon vibrant (VSM), permettent la détection des propriétés magnétiques globales des populations de nanoparticules. Mais la détection des propriétés magnétiques des particules isolées n'est pas possible et l'évaluation de ces propriétés en fonction de la taille des particules n'est pas explicite. Grâce à sa résolution latérale nanométrique et sa capacité à détecter des champs magnétiques faibles, MFM est un outil puissant pour la caractérisation de dimensions de nanoparticules isolées, ainsi que leurs propriétés magnétiques. Cependant, une méthodologie pour obtenir des informations quantitatives sur les caractéristiques magnétiques de nanoparticules isolées par MFM n'a pas été individualisée, principalement en raison de i) la complexité des interactions pointe-échantillon qui affectent les mesures MFM et qui produisent également des phénomènes non magnétiques (par exemple, des interactions électrostatiques), et ii) l’absence d'un modèle théorique décrivant les interactions magnétiques entre la pointe et une nanoparticule de manière cohérente avec les données expérimentales détectées. Pour exploiter toutes le potentialités de la technique MFM en tant qu'instrument de nanométrologie magnétique, la stratégie proposée et suivie dans ce projet est organisée en 4 phases:
1) a vérification théorique et expérimentale et la rationalisation des problemes ouvertes limitant l'applicabilité de la MFM à la caractérisation magnétique quantitative des NP individuels; Dans cette phase, la présence d'artefacts
iv
électrostatiques a été individualisée comme principale limite responsable de l'incohérence entre les données expérimentales et les modèles théoriques décrivant les interactions tip-NP.
2) le développement d'un appareil instrumental et d'une procédure de mesure pour évaluer et éliminer les contributions non magnétiques (électrostatiques) affectant quantitativement les données MFM;
3) l'individuation d'un modèle théorique décrivant l'interaction magnétique pointe-NP, cohérente avec les données expérimentales, et capable d'établir une relation précise entre les données mesurées et les paramètres physiques à déterminer (magnétisation dans le cas spécifique);
4) le développement d'une procédure pour mesurer quantitativement les propriétés magnétiques, et eventuellement d'autres paramètres, de nanoparticules isolées par MFM.
Les résultats obtenus avec les procédures et les méthodologies présentées dans cette thèse ont démontré la possibilité de réaliser des mesures magnétiques quantitatives sur des NP magnétiques individuelles par la plateforme technologique MFM.
v
Abstract
The objective of the PhD project is the development of a innovative measurement procedure and a data post-processing method to obtain quantitative information about the magnetic parameters of single magnetic nanoparticles through the use of the Magnetic Force Microscopy (MFM) technique.
Magnetic nanoparticles (MNPs), thanks to their particular magnetic properties (single domains, superparamagnetism, etc.) and their nanometric size, are thought to be suitable for several biomedical applications, such as drug delivery systems, magnetic hyperthermia treatments, cell labelling, contrast agents for Magnetic Resonance Imaging (MRI). The design of these techniques requires a detailed knowledge on the magnetic properties of the adopted nanomaterials, like the saturation magnetization Ms,
the saturation magnetic field Hs, the coercivity Hc. Standard techniques, like
Superconducting Quantum Interference Devices (SQUID) or Vibrating Sample Magnetometer (VSM), to allow the detection of global magnetic properties of nanoparticles populations. Nevertheless, the detection of magnetic properties of single particles is not possible and the evaluation of the particle size dependence is not explicit. Thanks to its nanometric lateral resolution and its capability to detect weak magnetic fields, MFM is a potential powerful tool for the characterization of single nanoparticles dimensions, together with their magnetic properties. However, a methodology to extract quantitative information about the magnetic characteristics of single nanoparticles through MFM has not been individuated, mainly because of the complexity of tip-sample interactions affecting MFM measurements, which produces also non magnetic phenomena (e.g. electrostatic interactions), and the lack of a theoretical model describing the magnetic tip-NP interactions consistently with the detected experimental data.
In order to exploit all the potential capabilities of MFM as a magnetic nanometrology tool, the strategy proposed and followed in this project is organized in the following four phases:
1) the theoretical and experimental verification and rationalization of the open issues and the problems limiting the applicability of MFM to the quantitative magnetic characterization of single NPs; in this phase the presence of electrostatic artifacts has been individuated as the main limitation responsible for the inconsistency
vi
between experimental data and theoretical models describing the tip-NP interactions.
2) the development of an instrumental apparatus and a measurement procedure to evaluate and eliminate the non-magnetic (electrostatic) contributions quantitatively affecting the MFM data;
3) the individuation of a theoretical model describing the magnetic tip-NP magnetic interaction, coherent with the experimental data, and able to establish a precise relationship between the measured data and the physical parameters desired to be determined (magnetization in the specific case);
4) the development of a procedure to quantitatively measure the magnetic properties, and eventually other parameters, of single nanoparticles by MFM.
The results obtained with the procedures and methodologies presented in this thesis demonstrated the possibility of performing quantitative magnetic measurements on single magnetic NPs by MFM technology platform.
vii
Riassunto
L'obiettivo del progetto di dottorato è lo sviluppo di una procedura di misura innovativa e di un metodo di elaborazione dei dati al fine di ottenere informazioni quantitative sui parametri magnetici di singole nanoparticelle magnetiche attraverso l'uso della Microscopia a Forza Magnetica MFM. Le nanoparticelle magnetiche (MNPS), grazie alle loro particolari proprietà magnetiche (singolo dominio, superparamagnetismo, etc.) e le loro dimensioni nanometriche, stanno recentemente trovando grande applicazione in diverse tecniche in campo biomedico, come i sistemi di somministrazione mirata di farmaci, trattamenti di tumori tramite ipertermia magnetica, l'etichettatura cellulare, gli agenti di contrasto per la risonanza magnetica nucleare (MRI). Il design e l’ottimizzazione di queste tecniche richiede una conoscenza dettagliata delle proprietà magnetiche dei nanomateriali adottati, come la magnetizzazione di saturazione Ms, il
campo magnetico di saturazione Hs, la coercitività Hc. Le tecniche standard, come i
Superconducting Quantum Interference Devices (SQUID) o i magnetometro a vibrazione del campione (VSM), consentono il rilevamento delle proprietà magnetiche globali di numerose popolazioni di nanoparticelle. Ma il rilevamento delle proprietà magnetiche di singole particelle non è possibile e la valutazione di queste proprietà in dipendenza della dimensione delle particelle non è esplicito. Grazie alla risoluzione laterale nanometrica e la sua capacità di rilevare i campi magnetici deboli, la tecnica MFM rappresenta uno strumento ad elevato potenziale per la caratterizzazione delle proprietà magnetiche di singole nanoparticelle, insieme alle loro dimensioni. Tuttavia, un metodo per estrarre informazioni quantitative sulle caratteristiche magnetiche di singole nanoparticelle attraverso la tecnica MFM non è stato individuato, soprattutto a causa della complessità delle interazioni punta-campione che interessano le misurazioni e che possono dare luogo anche a contributi non magnetici (ad esempio interazioni elettrostatiche), e alla mancanza di un modello teorico in grado di descrivere le interazioni magnetiche punta-NP in modo coerente con i dati sperimentali rilevati. Al fine di individuare e superare i limiti della tecnica MFM che ne limitano l’utilizzo come strumento nanometrologico magnetico, la strategia proposta e seguita in questo progetto di dottorato è organizzata nelle seguenti 4 fasi:
1) la verifica teorica e sperimentale e la razionalizzazione delle problematiche che limitano l'applicabilità della tecnica MFM alla caratterizzazione magnetica quantitativa di singole NP; in questa fase la presenza di artefatti elettrostatici è
viii
stato individuata come il principale limite responsabile per la riscontrata l'inconsistenza tra i dati sperimentali e modelli teorici che descrivono le interazioni tip-NP.
2) lo sviluppo di un apparato strumentale e una procedura miosura per la valutazione ed eliminazione dei contributi elettrostaticie non magnetici che influiscono quantitativamente sui dati MFM;
3) l'individuazione di un modello teorico che descrive l'interazione magnetica punta-NP coerentemente con i dati sperimentali, e in grado di stabilire una relazione precisa tra i dati misurati e i parametri fisici che si desiderano misurare (magnetizzazione nel caso specifico);
4) lo sviluppo di un procedimento per misurare quantitativamente le proprietà magnetiche, ed eventualmente altri parametri, di singole nanoparticelle tramite MFM.
I risultati ottenuti con le procedure e le metodologie presentate in questa tesi hanno dimostrato la possibilità di effettuare misure magnetiche quantitative su singole NP magnetiche facendo uso della piattaforma tecnologica MFM.
ix
TABLE OF CONTENTS
Resumé ... iii Abstract ... v Riassunto ... vii TABLE OF CONTENTS ... ixLIST OF FIGURES ... xiv
ACKNOWLEDGEMENTS ... xxiii
PREFACE ... xxv
1. BACKGROUND ... 1
1.1 MAGNETIC PROPERTIES ... 2
-1.1.1 - General properties of magnetic materials ... 2
-1.1.2 - Paramagnetism ... 3
1.1.2 Changes in magnetic properties with decreasing size ... 8
1.2 MAGNETIC NANOPARTICLES AND BIOMEDICAL APPLICATIONS 15 1.2.1 Drug delivery ... 15
1.2.2 Hyperthermia ... 16
-1.2.3 - Magnetic nanoparticles as contrast agents for Magnetic Resonance Imaging (MRI) ... 18
-1.2.4 - Cell labeling and magnetic separation ... 20
1.3 CHARACTERIZATION TECHNIQUES ... 22
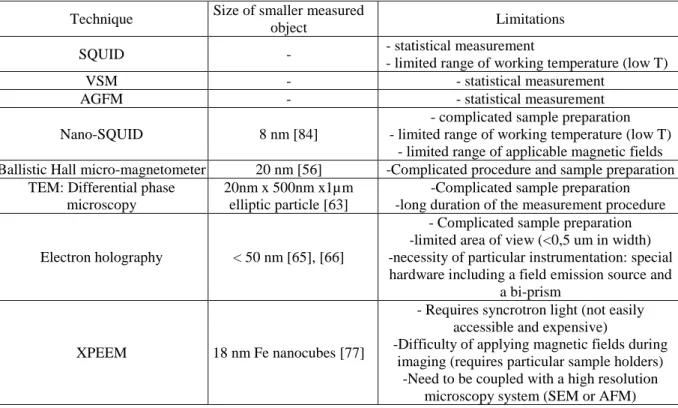
1.3.1 Conventional techniques: Statistical magnetic characterization ... 22
1.3.2 «Single nanoparticle» characterization techniques ... 24
1.3.3 Limits of "existing" characterization techniques ... 29
1.3.4 Magnetic Force Microscopy: A possible solution? ... 29
-2. STRUCTURE OF THE THESIS ... 31
-3. MAGNETIC FORCE MICROSCOPY ... 34
-x
3.1 INTRODUCTION ... 34
3.2 EXPERIMENTAL AND INSTRUMENTAL METHODOLOGY ... 36
3.2.1 Atomic Force Microscopy ... 36
3.2.2 Magnetic force microscopy ... 39
3.3 “STATE OF THE ART” ... 57
3.3.1 Overview of applications ... 57
3.3.2 MFM measurements with external magnetic fields ... 60
3.3.3 Statistical quantitative MFM measurements ... 61
3.3.4 Quantitative MFM measurements on single nanomaterials ... 65
3.4 FACTORS AFFECTING MFM MEASUREMENTS ... 68
3.4.1 Nonmagnetic tipsample interactions ... 68
3.4.2 Tipsample mutual magnetization ... 73
3.5 MFM PROBES ... 75
3.5.1 Probe calibration ... 75
3.5.2 Advanced probes ... 78
3.6 CONCLUSION AND FUTURE PERSPECTIVE ... 80
-4. OBJECTIVES AND STRATEGIES OF THE THESIS ... 81
-4.1 - MAGNETIC NANOPARTICLES AND MAGNETIC FORCE MICROSCOPY: OPEN ISSUES AND GENERAL OBJECTIVES OF THE PROJECT ... 81
-4.2 - OBJECTIVE 1: VERIFICATION AND RATIONALIZATION OF THE OPEN ISSUES ... 84
4.3. OBJECTIVE 2: REMOVAL OF ELECTROSTATIC CONTRIBUTION .. 86
4.4 OBJECTIVE 3: INDIVIDUATION OF THE MODEL ... 88
-4.5. - OBJECTIVE 4: MEASUREMENT OF MAGNETIZATION CURVES OF SINGLE NANOPARTICLES ... 90
-4.6 - OBJECTIVE 5: MEASUREMENT OF THE NONMAGNETIC COATING THICKNESS OF CORE-SHELL MAGNETIC NANOPARTICLES BY CONTROLLED MAGNETIZATION MAGNETIC FORCE MICROSCOPY .... 92
-xi
5. EXPERIMENTAL ISSUES IN MAGNETIC FORCE MICROSCOPY OF
NANOPARTICLES ... 95
Resumé ... 96
Abstract ... 97
5.1 INTRODUCTION ... 98
5.2 THEORY OF MAGNETIC FORCE MICROSCOPY ... 100
5.3 EXPERIMENTAL ... 103
5.4 RESULTS AND DISCUSSION ... 105
5.4.1 Effect of nonmagnetic coatings of nanoparticles ... 105
5.4.2 Tipsample interactions ... 106
5.4.3 Effects of an external magnetic field... 110
5.5 CONCLUSIONS ... 110
-6. REMOVAL OF ELECTROSTATIC ARTIFACTS IN MAGNETIC FORCE MICROSCOPY BY CONTROLLED MAGNETIZATION OF THE TIP: APPLICATION TO SUPERPARAMAGNETIC NANOPARTICLES ... 112
Resumé ... 113
Abstract ... 114
6.1 INTRODUCTION ... 115
6.2 MAGNETIC FORCE MICROSCOPY ... 117
6.3 CONTROLLED MAGNETIZATION MFM ... 118
6.3.1 Step I: Probe calibration ... 119
6.3.2 Step II: Determination of the magnetic signal ... 121
-6.4 - CASE STUDY: ANALYSIS OF SUPERPARAMAGNETIC NANOPARTICLES ... 126
6.5 CURRENT LIMITS AND FUTURE PERSPECTIVES ... 130
6.6 CONCLUSIONS ... 138
-7. SINGLE NANOPARTICLES MAGNETIZATION CURVES BY CONTROLLED TIP MAGNETIZATION MAGNETIC FORCE MICROSCOPY (CMMFM) ... 140
-xii
Resumè ... 141
Abstract ... 142
7.1 INTRODUCTION ... 143
7.2 MATERIALS AND METHODS ... 146
7.2.1 Controlled magnetization magnetic force microscopy ... 146
7.2.2 Materials and ancillary techniques ... 148
-7.3 - CM-MFM PROCEDURE FOR THE MEASUREMENT OF SINGLE NPS MAGNETIZATION CURVES ... 149
7.3.1 Calibration of the magnetic parameters of the tip ... 149
7.3.1 Magnetization curves measurement ... 151
7.4 RESULTS AND DISCUSSION ... 155
7.5 CONCLUSIONS ... 157
-8. MEASUREMENT OF THE NONMAGNETIC COATING THICKNESS OF CORE-SHELL MAGNETIC NANOPARTICLES BY CONTROLLED MAGNETIZATION MAGNETIC FORCE MICROSCOPY ... 159
Resumé ... 160
Abstract ... 160
8.1 INTRODUCTION ... 161
8.2 THE TECHNIQUE ... 163
8.2.1 Magnetic force microscopy ... 163
8.2.2 Controlled magnetization MFM ... 164
-8.2.3 - Measurement of the thickness of the non-magnetic coating of MNPs by CMMFM ... 165
8.3 MATERIALS AND METHODS ... 165
8.3.1 Instrumentation ... 165
8.3.2 Magnetic nanoparticles ... 165
8.4 RESULTS AND DISCUSSION ... 166
-xiii
8.4.2 CMMFM analysis ... 167
8.5 CONCLUSIONS ... 170
-9. CONCLUSIONS AND PERSPECTIVES ... 171
-10. LIMITS OF CMMFM ... 175
-11. FUTURE PERSPECTIVES ... 177
-xiv
LIST OF FIGURES
Figure 1 – Schema of a generic magnetic nanoparticle for biomedical applications [4]- 2
Figure 2 – MH curve for a diamagnetic material ... 3
Figure 3 – MH curve for a paramagnetic material ... 5
Figure 4 – Representation of magnetic domains in a ferromagnetic material ... 6
Figure 5 –MH curve for a ferromagnetic material ... 6
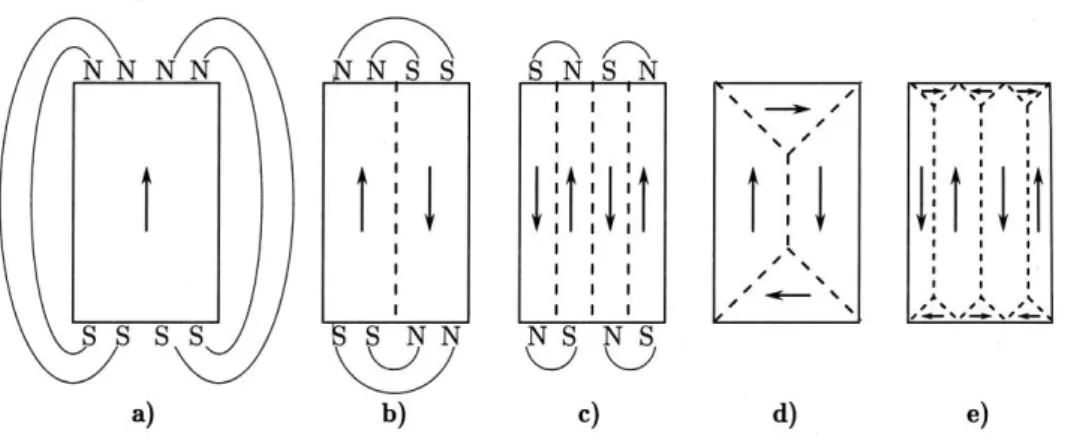
Figure 6 – Schematic representation of multi and singledomain configurations ... 11
Figure 7 – Herzer diagram: coercivity as a function of the particle size ... 13
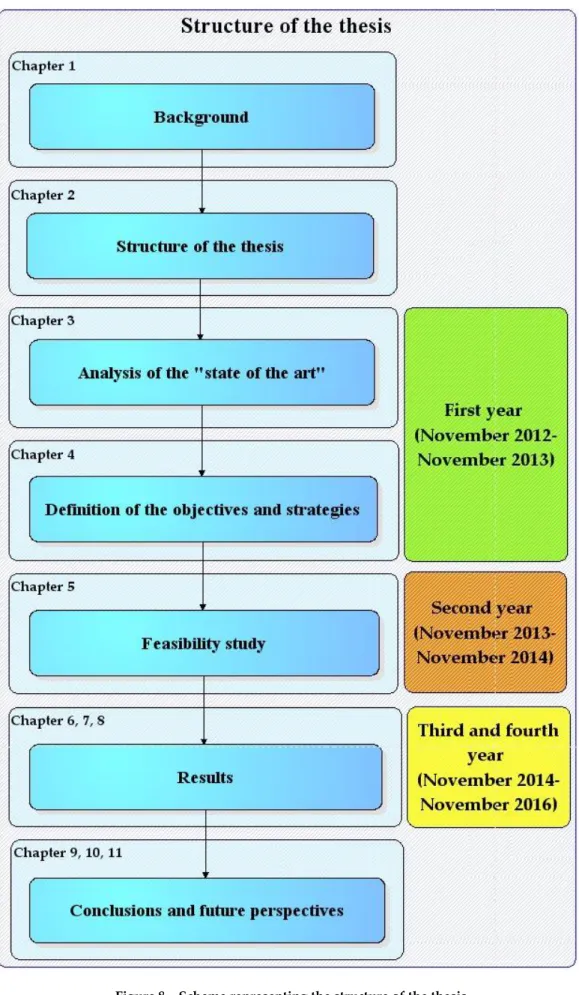
Figure 8 – Schema representing the structure of the thesis ... 33
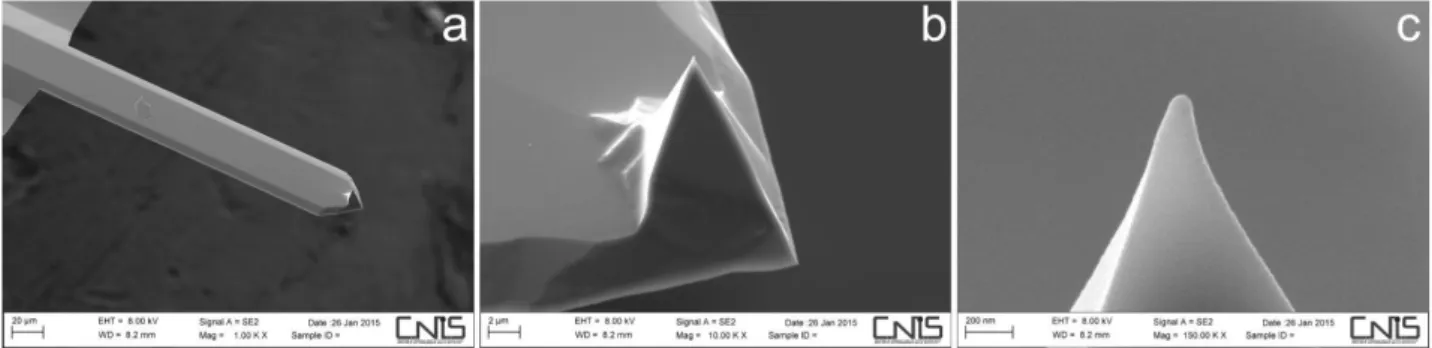
-Figure 9 - Example of scanning electron micrographs of an AFM/MFM cantilever (a) with details of the tip at different magnification (b and c, respectively). The cantilever (MESP-LC, Bruker Inc.) is coated with a magnetic Fe layer a few tens of nanometers thick. Images courtesy of Francesco Mura (CNIS - Research Center for Nanotechnology applied to Engineering of SAPIENZA University of Rome). ... 36
Figure 10 Sketch of contact (a) and semicontact (b) AFM operation modes. ... 37
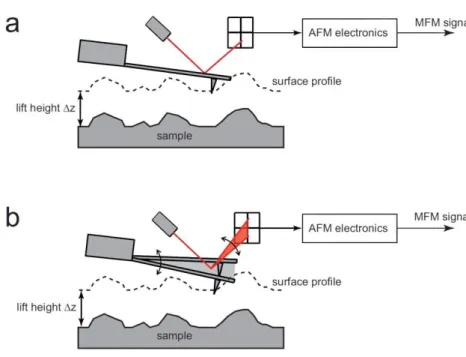
-Figure 11 - Sketch of working principle of the second pass of static (a) and dynamic (b) MFM. In both the modes, during the second pass the line is scanned by maintaining the cantilever at a constant distance from the surface, i.e., the lift height Δz. The magnetic signal is represented by the cantilever deflection in static MFM (a) or some oscillation parameters of the vibrating cantilever in dynamic MFM (b). ... 39
-Figure 12 - Sketch representing the forces acting on the cantilever. The position along the vertical axis of the undeflected and deflected cantilever are indicated with u(t) and z(t). The cantilever is subjected to the external force Fext (a generic external force which in MFM is ideally given by the sole tip-sample magnetic interaction force although actually also electrostatic interaction forces are generally present), the elastic force Fel, and the viscous force Fv, which are supposed to be applied to a punctiform mass mc, namely, the equivalent mass of the cantilever. ... 41
-xv
Figure 13 - Amplitude and phase of the cantilever oscillation as a function of the angular frequency ω of the bimorph excitation in the case of uniform external force (black solid line), i.e., zero gradient of the force F1, and in the two
exemplifying cases of gradient of the force F1 equal to +10% and -10% of the
cantilever spring constant kc (red and blue solid line, respectively). ... 43 -Figure 14 - Examples of topography (left column) and MFM phase image (right
column) acquired on different sample: floppy disk (a and b); recording tape (c and d); Co (e and f) and Fe (g and h) based thin films. Authors' unpublished data. ... 48 -Figure 15 - Sketch illustrating the simplest model for describing the the tip-sample
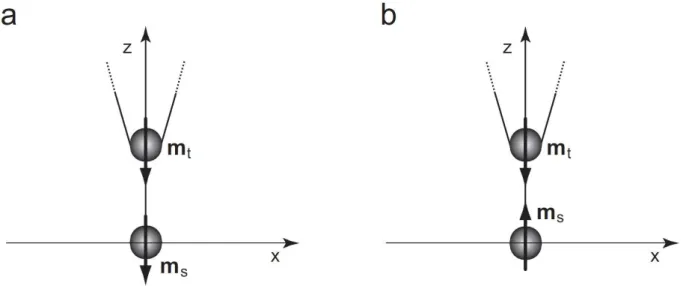
interaction. The tip and the sample are modeled as two punctiform magnetic dipoles on the z axis. The dipoles have moments mt and ms, respectively, with
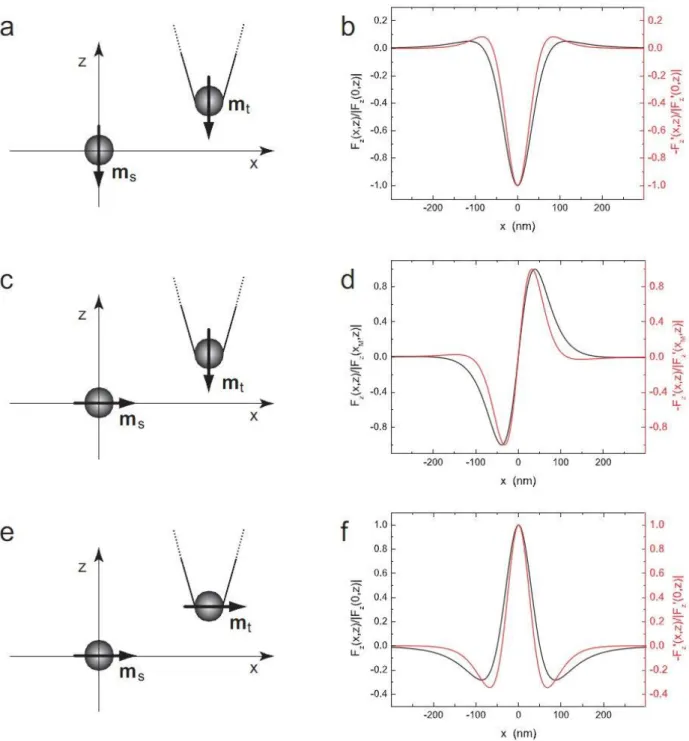
components only along the z and are assumed either parallel (a) or antiparallel (b). ... 50 -Figure 16 - Sketches of different configurations of tip and sample magnetic moments,
i.e, both vertical (a), tip vertical and sample horizontal (c), and both horizontal (e), with the corresponding simulated force along z axis Fz (black
curves) and gradient ΔF′z (red curves). The sign of F′z is changed so that the
curve is proportional to the profile of the magnetic images obtained in dynamic MFM. Curves have been normalized for the sake of readability.- 53
-Figure 17 - Sketch of the orientations of the magnetic domains in period recording media (e.g., standard floppy disks) with the indication of the lines of the magnetic field. Correspondingly, the profile of the dynamic MFM signal is simulated for the cases of vertically and horizontally magnetized tip as illustrated on the right of each profile. ... 55 -Figure 18 - Typical experimental MFM phase images acquired on a standard floppy
disk using a vertically (a) and horizontally (c) magnetized tip, together with two profiles extracted from the MFM maps - (b) and (d), respectively. The pattern of the magnetic domains as deduced from the curves is reported assuming the tip magnetized as in Fig. 16. Unpublished data. ... 55 -Figure 19 - MFM images of (a) Co55Fe45 and (b) Ni80Fe20 nanowire arrays (both the
xvi
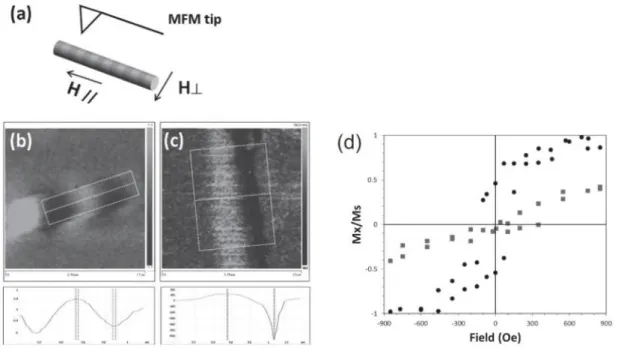
positive 2 kOe field and then in a variety of unsaturated remanent states obtained by changing each time the magnetic state of the nanowirearray from saturation to a given negative field and then to remanence by reducing the field to zero. (c) Hysteresis loop of the Ni80Fe20 nanowire array measured by AGFM (solid line) and MFM (symbols) with the applied field parallel to the wire axis. Reprinted with permission from [193]. ... 62 -Figure 20 - (a) Schematic drawing of MFM measurement on a multilayered nanowire
with parallel (460 Oe)/perpendicular fields (550 Oe). (b) and (c) MFM phase image of a multilayered nanowire under parallel/perpendicular fields and corresponding step analysis. (d) Hysteresis loops of a multilayered Fe-Ga/Cu nanowire measured by MFM under parallel (circles) and perpendicular fields (squares). Reprinted with permission from [198]. ... 64 -Figure 21 - Topography and in-remanence magnetic image of a single-domain Co
nanowire. (a) Topography and (b) MFM image in remanence of nanowire; (c)-(d) MFM-based mode images and (e)-(g) profiles corresponding to hysteresis loops. The frequency shift contrast for all the MFM images is 8:5 Hz. Reprinted from [149]. ... 64 -Figure 22 - MFM characterization of a nonmagnetic calibration reference sample: (a)
topography and (b) MFM phase image obtained with Vdc = 0V; (c) details of
MFM phase images obtained with Vdc = -1 V, -2 V, and -4 V; (d) plot of the
experimental contrast ΔθAB measured between the points A and B indicated in
(c) as a function of Vdc (symbols) together with the corresponding parabolic
fit according to Eq. (38) (solid line). Authors' unpublished data. ... 69 -Figure 23 - Topography of (a) Co nanowires and (e) L-shaped Co nanostructure. (b)
and (f) frequency shift images measured without KPFM acquired at a retrace distance of 30 nm and 25 nm respectively. (c) and (g) surface potential images obtained by the KPFM technique. (d) and (h) MFM images (frequency shift) of the Co nanostructures measured when the KPFM bias correction was switched on. Reprinted from [216]. ... 72 -Figure 24 - Sketch of the principle of SM-MFM. Both the scans are performed in
tapping mode, but the magnetic moment of the tip mt is reversed between them, as schematized in (a) and (b). The sum of the signals gives the atomic and the electric forces, while the difference of the signals gives the sole magnetic forces [217]... 72
-xvii
Figure 25 – General schema of the methodology for the magnetic characterization of MNPs by MFM ... 83 -Figure 26 – Schema of the strategies, the experimental measurements and the data
processing used in the first phase of the project ... 86 -Figure 27 - Schema of strategies and activities for the evaluation and elimination of the
electrostatic effects in MFM images ... 88 -Figure 28 - Schema of strategies and activities for the individuation of the theoretical
model describing the tipNP interaction ... 90 -Figure 29 - Schema of strategies and activities for the quantitative measurement of
magnetic parameters of MNPs by MFM ... 92 -Figure 30 - Schema of strategies and activities for the quantitative measurement of the
thickness of the nonmagnetic coating of coreshell NPs ... 94 -Figure 31 - Topography (a) and phase MFM images of Fe NPs detected at lift height Δz
of 30 nm (b), 40 nm (c), 60 nm (d), 80 nm (e); phase contrast Δφ as a function of Δz (f). ... 99 -Figure 32 - Topography (a) and phase MFM images of Fe-Cu NPs detected at lift height
Δz of 20 nm (b), 40 nm (c), 80 nm (d), 100 nm (e); phase contrast Δφ as a function of Δz (f). ... 101 -Figure 33 - Topography (a) and MFM phase image (b) of Cu-coated Fe NPs; phase
contrast Δφ as a function of the nanoparticles diameter d (c). ... 102 -Figure 34 - Topography (a) and MFM image (b) of a standard floppy disks acquired
with a not magnetized tip and topography (c) and MFM image (d) of the same sample acquired with a magnetized probe. ... 104 -Figure 35 - Topography (a) and phase MFM images of an agglomerate of Fe3O4 NP
with diameter d = 41 nm detected with a not magnetized probe at lift height Δz 20 nm (b), 50 nm (c), 200 nm (d); (e) MFM phase contrast Δφ between the NP and the substrate as a function of Δz; (f) sketch of the proposed mechanism leading to topography-induced artifacts: the additional distance is depicted in red. ... 106 -Figure 36 - Topography (a) and phase images of an agglomerate of Fe3O4 NP (d = 41
nm) detected with a standard magnetized probe at different Δz: 20 nm (b), 50 nm (c), 100 nm (d), 200 nm (e); (f) MFM phase contrast Δφ between the NP and the substrate as a function of Δz. ... 108
-xviii
Figure 37 - Topography (a) and phase images of an agglomerate of Fe3O4 NPs (d = 85 nm) detected with a standard magnetized probe applying an external magnetic field at different Δz: 20 nm (b), 50 nm (c), 100 nm (d), 200 nm (e); (f) MFM phase contrast Δφ between a NP and the substrate as a function of Δz. .. 109 -Figure 38 - Experimental characterization of the remanent magnetic properties of a
standard MFM tip. (a) Hysteresis curve of the MFM phase contrast (Δφcont) as
a function of the magnetic field H applied and subsequently switched off. (b) Examples of MFM images of the periodic magnetic domains of a standard floppy disk, from which the phase difference between two adjacent transition regions was measured in order to determine the points of the hysteresis curve. Points from A to F in panel (a) are obtained from images from A to F in panel (b). ... 120 -Figure 39 - Sketch of the tip-sample interactions in CM-MFM. The sample is assumed
constituted by magnetic domains with different orientation (red arrows) and by distributed electric charges which are responsible for a tip-sample electrostatic interaction not uniform on the surface. The three configurations of the tip are characterized by different magnetization of the tip: (a) tip with saturated "up" magnetization; (b) tip with saturated "down" magnetization; (c) demagnetized tip. ... 122 -Figure 40 - CM-MFM characterization of a standard floppy disk. (a) Topography of an
area where a particle (likely dust) is observable on the floppy surface and (b) corresponding standard MFM phase image acquired with the magnetized tip. (c) Phase image acquired with the demagnetized tip. (d) Magnetic phase image obtained by subtracting (c) from (b). ... 125 -Figure 41 - CM-MFM characterization of superparamagnetic NPs. (a) Topography of an
area where some NPs are visible and (b) corresponding standard MFM phase image acquired with the magnetized tip. (c) Phase image acquired with the demagnetized tip. (d) Magnetic phase image obtained by subtracting (c) from (b). ... 125 -Figure 42 - Analysis of images collected using CM-MFM technique in ZM mode. (a)
Standard MFM phase contrast (Δφ) as a function of the lift height (Δz) measured on a NP with diameter d = 30 nm using a magnetized probe, which is affected by both electrostatic and magnetic tip-sample interactions. (b) Phase contrast on the same NP as a function of the lift height acquired with
xix
the demagnetized tip, which is affected only by the electrostatic tip-sample interactions. (c) Magnetic phase contrast as a function of the lift height obtained by subtracting data in (b) from those in (a) with the corresponding fit using the simple model of two magnetic dipoles in Eq. (62). (d) Magnetic phase contrast as a function of the NP diameter obtained analyzing five NPs with the corresponding fit using the simple model of two magnetic dipoles in Eq. (62). ... 130 -Figure 43 - (a) Tip calibration on the floppy, from which the remanent saturation
magnetic field Hrs,tip and twovalues near the remanent coercive field are determined. (b) CM-MFM signal (ΔφCM−MFM) as a function of thelift height (Δz) measured on the floppy in two cases of nearly demagnetized tip, characterized by two values of the demagnetization factor ε. (c) Corrected magnetic signals (Δφmagn) as a function of the lift height (Δz), obtained using Eq. (69). ... 134 -Figure 44 - (a) CM-MFM signal (ΔφCM−MFM) as a function of the lift height (Δz)
measured on a NP with diameter d=25 nm in three cases of nearly demagnetized tip, characterized by three values of the demagnetization factor ε. (b) Corrected magnetic signals (Δφmagn) as a function of the lift height (Δz), obtained using Eq. (71). ... 136 Figura 45 Magnetization curve obtained on magnetite NPs by SQUID ... 149 -Figura 46 - Standard MFM images (a, d , g), electrostatic images (b, c, h) and CM-MFM images (c, f, i) at lift height Δz of 20 nm (a, b, c), 50 nm (d, e, f) and 80 nm (g, h, i) of a NP of 31 nm diameter. ... 150 -Figura 47 - (a) CM-MFM phase-distance curve (symbols) and theoretical fit (solid line);
(b) sketch of the equivalent two-dipole model describing the tip- NP interaction. ... 151 -Figura 48 - Topography (a), electrostatic image at Δz=100nm and Hext=0 (b), standard
MFM images (c, e, g) and corresponding CM-MFM images (d, f, h) at Hext=
+ 60Oe (c, d), Hext= + 19Oe (e, f) and Hext= -10Oe (g, h) of a NP of 31 nm
diameter. ... 153 -Figura 49 - (a) MFM phase versus applied magnetic field curve at Δz = 100 nm of a NP
of diameter of 31 nm; (b) corresponding CM-MFM phase versus applied magnetic field curve; (c) corresponding magnetization versus applied magnetic field curve. ... 155
-xx
Figura 50 - Histogram of the diameters distribution of Fe3O4 NPs (a) and Fe3O4@Cu
NPs (b) measured by AFM. ... 166 -Figura 51 - - Phase images of a Fe3O4 NP obtained with the demagnetized probe at ∆z
= 30 nm (a), ∆z = 50 nm (b) and ∆z = 80 nm (c); phase images obtained with the magnetized probe (standard MFM images) at ∆z = 30 nm (d), ∆z = 50 nm (e) and ∆z = 80 nm (f); phase images; phase images obtained by the subtraction of the images measured with the demagnetized probe to the images obtained with the magnetized probe at ∆z = 30 nm (g), ∆z = 50 nm (h) and ∆z = 80 nm (i). ... 168 -Figura 52 - Magnetic phase shift versus lift height for a uncoated (NP A) and a coated
xxii
xxiii
ACKNOWLEDGEMENTS
I wish to express my deepest gratitude to my supervisors, Prof. Marco Rossi and Prof. Diego Mantovani, that gave me the opportunity to work under their joint supervision, which has greatly enriched me from both a professional and a personal point of view. I thank them for having been for me a guide and a reference point in these four years, giving me the possibility to travel and live this doctoral experience in a dynamic and highly multicultural environment, to see and test different ways of working and doing research, different means, different approaches and methodologies. I had the possibility to collaborate and interact with many people, experts in different fields, having different cultures and coming from different parts of the world. This allowed me to acquire very diverse competences, to open my mind, to acquire autonomy and critical spirit, as well as to learn tolerance and respect for different ideas, beliefs and habits, qualities that I consider essential for a researcher.
My heartfelt thanks go to my "scientific father", Daniele Passeri. He was and still is for me a guide, a patient teacher and a true friend. I thank him for having welcomed me into his lab and always made me feel at home, for having conveyed his curiosity and passion for research to me, for having transferred his skills to me with generosity, for his never-ending patience, for having teached me to work seriously and honestly, but also with humor and critical spirit.
A special thanks goes to the professional researchers and post-doc researchers of LBB in Quèbec with whom I have had the luck and the honor to work for long or short periods: Pascale, Stephane, Carlo, Ranna, Vanessa. I wish to thank them for their patient teachings and for the skills and competences they shared with me every day, with generosity and professionalism, and for the enthusiasm and energy that they put every day in their work. Their example motivated me during the last four years and will be forever a model for me to be followed.
I wish to thank wholeheartedly all the people with whom, over the years, I shared the daily life, always in a peaceful and welcoming environment: the PhD students in Rome and Quèbec. I would like to thank Melania, because the laughs we had during our long days in front of the AFM will be one of the best memories of this experience. And I
xxiv
would like to thank all the students of LBB, which are too numerous to be listed, but to which I am deeply grateful for having welcomed, supported and tolerated me every day, for having taught me, for having given me the opportunity to open my eyes to different cultures and habits, for having made me feel at home when I was far from home.
I wish to thanks with all my heart my parents, to whom I dedicate this thesis. They have made this experience possible, supporting and encouraging me in every moment and in every possible way. Thank you for having been always present and for never showing sadness because of the distance, but always joy and pride. Thanks for having left the computer on continuously for 4 years and have always answered to my calls, in all circumstances and at any time. Thanks for teaching me the universal and fundamental rules of life, such as courtesy, discretion, and respect for the others, which allowed me to integrate myself and be accepted in any place in the world. Thank you for having accompanied me in these (many) years of study, for giving me the energy and the motivation to not give up, even when everything was difficult.
I wish to thank Arnaud, for having been with me in every moment of these wonderful four years, for having taken care of me, and having always encouraged and supported me. I'm sure that this doctorate is just the first of many successes we will achieve together.
xxv
PREFACE
The development and optimization of a novel material require, in general, the use of metrological tools for the measurement and tuning of its functional properties (e.g. mechanical, magnetic, electrical, thermal, etc.). In the case of nanomaterials (materials having one or more dimensions smaller than 100 nm), due to the small involved characteristic sizes, conventional measurement techniques at the macro- and microscopic scale are not effective. This is reason why the development of nanomaterials and the advancements in nanotechnology field are strictly related to the development of new, appropriate technologies and methodologies for the characterization at the nanoscale.
Since today, the remarkable outbreak of nanotechnologies has been allowed by the invention and the continuous improvement of different techniques and instrumentations for the imaging of materials and systems at the nanoscale, such as Scanning Electron Microscopy (SEM), Transmission Electron Microscopy (TEM) and Scanning Probe Microscopies (SPM). Nevertheless, the definition of standard and reliable techniques and methodologies for the quantitative measurement of physical parameters of nanomaterials is still an open issue.
Scanning Probe Microscopy, thanks to its working principle, which is based not on “seeing” the sample but on detecting the interaction forces between the probe and the scanned surface, is a technology platform potentially able to provide information about not only the morphology of a surface (through the detection of Van der Waals forces), which represents, currently, its main application, but also information about a wide number of functional properties, such as mechanical, electric, electromechanical, magnetic, thermal, chemical, of both articificial and biological materials, with high sensitivity and nanometric lateral resolution.
Nevertheless, despite the important advancements in the last decades and the continuous development of tools for the map and measurement of specific materials properties at the nanoscale, the use of Scanning Probe Microscopy techniques as a really quantitative metrological instrument is still limited. Only Atomic Force Microscopy, based on the detection of Van der Waals interactions between the probe and the sample, is considered as a reliable quantitative technique for the dimensional measurements at the nanoscale and it is known to provide accurate results. Contrariwise, other physical measuring and mapping modes, such as AFM based mechanical characterization techniques
(AFM-xxvi
nanoindentation, CR-AFM, and TH-AFM), magnetic characterization techniques (MFM), “biological-AFM” techniques, as well as electric, chemical and thermal modes, despite the great efforts of researchers to find appropriate methodologies and solutions, are still mainly used to produce only qualitative or semi-quantitative (differential maps) results, with no direct relation to absolute values.
This can be mainly ascribed to the complexity of the nanoscale tip-sample interactions, which can contain many different components and can be dependent on several factors, such as geometrical, chemical and physical properties of both the tip and the sample, making difficult the individuation of precise relationships between the measured data and the physical parameter which is desired to be measured.
In general, the main problems that still are limiting the use of SPM techniques for the measurement of quantitative parameters at the nanoscale can be summarized as:
1) Lack of standard methodologies (strategies for probes calibration and characterization, definition of appropriate reference samples, measurements procedures, etc.) to facilitate the correlation between measured data and quantitative values of the parameters of interest;
2) Lack of standard and appropriate models that will consider all the tip-sample interactions and define accurate relationships between measured data and absolute quantitative values of the parameters of interest.
In this context, the general objective of the PhD project is to bring a contribution to the development of AFM techniques, allowing their use as tools for the quantitative evaluation of relevant properties of nanomaterials, in particular introducing:
1) Methodologies for the probes characterization in order to quantify all the probe characteristics affecting the quantitative measurement (e.g. elastic constant, magnetic properties, etc.).
2) Measurement methodologies to be adopted to obtain accurate information about the parameters of interest, reducing artifacts and individuating all the tip-sample interactions forces affecting the measured data;
3) Methodologies for the data post-processing: study and individuation of appropriate mathematical models for the transformation of qualitative data into the values of quantitative data of interest.
In order to achieve this goal, the research activity has been organized in the following phases, which will be described in the different sections of this thesis:
xxvii
- Analysis of the state of the art regarding the existing MFM based technologies and their applications to the quantitative measurement of magnetic parameters at the nanoscale, which is described in Chapter 3. This study was published in January 2016 in the chapter: Passeri D, Angeloni L, Reggente M, Rossi M. “Magnetic Force Microscopy, in magnetic characterization techniques for nanomaterials”. C. Kumar (Ed.), Springer (accepted on the 20th of January
2015). L.A. is the second author of this chapter. L.A. performed all the reported MFM measurements (“unpublished data”), which were analysed by D.P. and L.A. D.P. and L.A. wrote the starting draft of the manuscript, which was revised by all the authors.
- The individuation of the open issues limiting the use of MFM as a nano-metrological tool and definition of the general strategies and methodologies of the project, which are described in Chapter 4.
- The experimental verification and rationalization of the open issues and limitations which emerged from the literature analysis. This phase of the project is described in Chapter 5 and has been published, in June 2015, as a conference paper: Angeloni L, Passeri D, Reggente M, Rossi M, Mantovani D, Lazzaro L, Nepi F, De Angelis F, Barteri M. “Experimental issues in Magnetic Force Microscopy of nanoparticles”. AIP Conf. Proc. 2015;1667:020010 (DOI: 10.1063/1.4922566). L.A. is the principal author of the paper. L.A. and D.P. with the supervision of M. Rossi and D.M. designed the experiments which were carried out in the laboratories led by M. Rossi Materials, spare parts, and instrumentation were supplied by D.M. and M. Rossi. L.A. performed the experiments. The analysed samples were prepared by L.L., F.N., F.DA., under the supervision of M.B.. L.A., D.P. and M. Reggente analyzed the results, which were discussed by all the Authors. L.A. and D.P. wrote the starting draft of the manuscript, which was revised by all the authors.
- The individuation and the development of an instrumental apparatus and a methodology to overcome the individuated open issues and definition of a precise relationship between the MFM measured data and the real physical parameters of interest. This phase of the project is described in Chapter 6 of this thesis and has been published, on the 19th May 2016, in a paper: Angeloni L, Passeri D, Reggente M, Mantovani D, Rossi M. “Removal of electrostatic artifacts in Magnetic Force Microscopy by controlled magnetization of the
xxviii
tip: application to superparamagnetic nanoparticles”. Sci. Rep., 2016;6:26293 (DOI: 10.1038/srep26293). L.A. is the principal author of the article. L.A. and D.P. with the supervision of M. Rossi and D.M. designed the experiments which were carried out in the laboratories led by M. Rossi Materials, spare parts, and instrumentation were supplied by D.M. and M. Rossi. L.A. performed the experiments. L.A., D.P. and M. Reggente analyzed the results, which were discussed by all the Authors. L.A. and D.P. wrote the starting draft of the manuscript, which was revised by all the authors.
- The application of the developed technique to the quantitative measurement of parameters of interest of magnetic nanoparticles. The obtained results are described in Chapter 7 and 8, and have been reported in a first article, Angeloni L, Passeri D, Peddis D, Mantovani D, Rossi M, Single nanoparticles magnetization curves by controlled tip magnetization magnetic force microscopy submitted to “Nanoscale” in August 2017, and in a conference paper, Angeloni L, Passeri D, Scaramuzzo F A, Di Iorio D, Barteri M, Mantovani D, Rossi M. “Measurement of the nonmagnetic coating thickness of core-shell magnetic nanoparticles by controlled magnetization magnetic force microscopy”. AIP Conf. Proc. 2016;1749:0200060 (DOI: 10.1063/1.4954489), published in June 2016. L.A. is the principal author of both of the papers. The first article has been submitted on Nano Letters. L.A. and D.P. with the supervision of M. Rossi and D.M. designed the experiments which were carried out in the laboratories led by M. Rossi. Materials, spare parts, and instrumentation were supplied by D.M. and M. Rossi. L.A. performed the MFM experiments. D.P. performed the SQUID experiments. L.A., D.P. and M. Reggente analyzed the MFM results, which were discussed by all the Authors. L.A. and D.P. wrote the starting draft of the manuscript, which was revised by all the authors. The second article has been published in June 2016. L.A. and D.P. with the supervision of M. Rossi and D.M. designed the experiments which were carried out in the laboratories led by M. Rossi Materials, spare parts, and instrumentation were supplied by D.M. and M. Rossi. L.A. performed the experiments. The analysed NPs were prepared by F.A.S. and D.D.I, under the supervision of M.B. L.A., D.P. and M. Reggente analyzed the results, which were discussed by all the Authors. L.A. and D.P. wrote the starting draft of the manuscript, which was revised by all the authors.
xxix
The doctoral project has been developed in collaboration between the Laboratory for Biomaterials and Bioengineering of the Université Laval in Québec City - Canada, and the Laboratory of Scanning Probe Microscopy of the Sapienza - University of Rome (Department of Fundamental and Applied Sciences for Engineering - SBAI), under the joint supervision of Prof. Diego Mantovani (Université Laval ) and Prof. Marco Rossi (Sapienza - University of Rome) .
The collaboration has been based on the complemental skills and technology platforms made available by the two laboratories:
- the Laboratory of Biomaterials and Bioengineering of the Université Laval in Québec City works specifically on the development and fabrication of advanced materials for biomedical applications.
- the Laboratory of Scanning Probe Microscopy of the Sapienza - University of Rome works on the development of advanced techniques for the characterization of nanomaterials, especially through the use of Scanning Probe Microscopy tools.
- 1 -
1.
BACKGROUND
The development of magnetic nanoparticles (MNPs) has recently attracted growing interest, due to the particular magnetic properties that occur in magnetic materials when their dimensions are reduced to the nanoscale. These properties, coupled with the nanometric size and with the possibility of opportunely coating and/or functionalizing the NPs, make these nanomaterials suitable for several biomedical applications, such as carriers for drug delivery applications, mediators for magnetic hyperthermia treatments, contrast agents for Magnetic Resonance Imaging (MRI) and markers for cell labeling. First of all, the NPs magnetic character (multi or single-domain ferromagnetic, superparamagnetic) and the intrinsic penetrability of magnetic fields into human tissues, allows the manipulation of injected MNPs within the body by external magnetic fields and the transport of them on a specific target, allowing, as an example, the localization of therapeutic treatments (e.g. chemotherapeutic drugs or hyperthermia) which could be detrimental for healthy tissue.
The second fundamental property of nanoparticles that make them suitable for biological and biomedical applications is the size. MNPs have, in general, controllable diameters in a range of few nm to a few tens of nm. These sizes are compatible with the dimensions of the cells (10-100 m), viruses (20-450 nm), proteins (5-50 m) and genes (2 nm wide, 10-100 nm length) and make the NPs able to interact with and penetrate into tissues and cells.
Furthermore, MNPs can be coated with biocompatible films in order to reduce their toxicity and functionalized with organic molecules, antibodies, ligands and other chemical compounds, in order to make them able to interact and create bonds with biological entities, such as cells, providing the possibility of their use in cell labeling applications, or with drugs, providing the possibility of their use in therapeutic applications (i.e. drug delivery).
MNPs have also a resonance response to an alternated magnetic field, allowing the energy transfer from an external magnetic field to the body. MNPs can therefore be used as carriers of thermal energy on tumor sites and used for the development of localized hyperthermia treatments.
In addition, superparamagnetic nanoparticles, when are subjected to an intense magnetic field, produce intense magnetic fields oriented parallel to the applied field, which locally increase the magnetic field, significantly increasing the Larmor frequency of the
- 2 -
involved protons and a consequent variation of their transverse relaxation time (T2).
These characteristic make these materials particularly suitable to be used as contrast agents for Magnetic Resonance Imaging (MRI).
Figure 1 – Schema of a generic magnetic nanoparticle for biomedical applications [4]
In the following paragraphs a brief description of the MNPs magnetic properties and some applications is presented, in order to highlight the reason why the design of these techniques requires a detailed knowledge, so a detailed characterization, of the magnetic and structural properties of the adopted nanomaterials.
1.1 - MAGNETIC PROPERTIES
The different existing magnetic materials and their main properties are briefly summarized below in order to highlight, in the successive paragraphs, the changes which occurs when the characteristic dimensions of a material are reduced to the nanoscale.
1.1.1 - General properties of magnetic materials
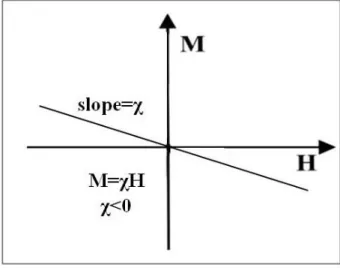
Magnetic materials are, in general, classified into diamagnetic, paramagnetic and ferromagnetic. The diamagnetic materials have a negative and very small (order of 10-6 -10-5) magnetic susceptibility ; paramagnetic materials are characterized by a positive susceptibility of the order of 10-2-10-4. On the contrary a small number of substances, the ferromagnetic materials, present very high values, of the order of tens of thousands.
- 3 -
For the sake of completeness, in the following paragraphs, the main physical phenomena giving rise to the different magnetic properties of materials are briefly described.
1.1.1.1 - Diamagnetism
The diamagnetism is caused by the changes in the orbital motion of electrons when a magnetic field is applied; these changes give rise to an induced magnetic field directed antiparallel to the applied magnetic field, according to the phenomenon known as
“Larmor precession”.
All materials have a diamagnetic behavior, since all atoms have external electrons that shield the effect of an external magnetic field. The diamagnetic behavior is, however, detectable only in those materials in which such an effect, quantitatively very low, is not masked by other overriding possible effects; specifically, this occurs for those materials where the particles (atoms or molecules) do not possess any intrinsic magnetic moment. The magnetic susceptibility of such a type of materials (diamagnetic susceptibility) is therefore negative ( <0), low (χ = 10-6-10-5) and independent of temperature.
Figure 2 – M-H curve for a diamagnetic material
1.1.2 - Paramagnetism
Paramagnetism exists in materials in which the atoms, molecules or ions have a magnetic moment, due to unpaired electrons in partially filled orbitals. In the absence of any external magnetic field, the magnetic moments of the individual atoms (or molecules or ions) are randomly directed in all possible directions, due to the thermal agitation, and, consequently, the material possesses no net magnetization. When an external magnetic field is applied, the magnetic moments rotate in the direction of the
- 4 -
applied field. Paramagnetic materials are therefore characterized by a positive susceptibility. This phenomenon is opposed by thermal agitation which promote the restoration of the random orientation. Such behavior is summarized by the experimental Curie law:
T C
1)where T is the temperature and C is a parameter called “Curie constant” which, according to the classic theory of Langevin for a gas of molecules having magnetic moment m, in presence of low fields and at not too low temperatures, is :
B k Nm C 3 2 0 2)
where N is the number of atoms for volume unit, kB the Boltzmann constant, μ0 the
magnetic permeability of vacuum.
The Langevin theory is in agreement with the quantum theory from which we have:
B B k g J NJ C 3 ) 1 ( 2 2 0 3)
where the value of the magnetic moment associated with the total quantum number of moment J is: ) 1 ( g J J m B 4)
where μB is the Bohr magneton and g the gyromagnetic ratio.
Therefore, the magnetization of a paramagnetic material, in correspondence of low fields and not very low temperatures, grows proportionally with the applied field. For very intense field values and for low temperatures, the magnetization tends to a constant value. Indeed, when all the elementary magnetic moments are aligned with the external field, the magnetization intensity reaches its saturation value and cannot further increase.
The magnetic susceptibility of paramagnetic media is therefore positive (> 0), temperature dependent and can reach values of the order of 10-2-10-4.
- 5 -
Figure 3 – M-H curve for a paramagnetic material
1.1.1.3 - Ferromagnetism
The "not magnetized" state
A macroscopic sample of a ferromagnetic material (monocrystalline or polycrystalline) is typically composed by several regions, called “magnetic domains” or “Weiss domains”, which are spontaneously magnetized in a certain direction, as schematically represented in Figure 4
Indeed, magnetic ordered materials are characterized by a magnetocrystalline anisotropy, which is due to the spin-orbit coupling, for which the alignment of the dipoles along specific crystallographic directions, defined as "preferential magnetization axes", is energetically promoted compared to other possible directions of orientation. This property is an intrinsic characteristic of the material. In a multi-domain material, in the absence of an external magnetic field, each domain is oriented along its direction of "easy magnetization".
Therefore, in a macroscopic not magnetized material, the magnetizations of the individual domains are randomly oriented in all the possible directions (which correspond to their own directions of "easy magnetization"), giving rise to an overall nul magnetization.
These domains are separated by transition regions, called Bloch walls, which are characterized by a finite thickness where a gradual variation of the spins (magnetization) orientation occurs.
- 6 -
Figure 4 – Representation of magnetic domains in a ferromagnetic material
Magnetization curve and hysteresis loop
Differently from the diamagnetic and paramagnetic materials, the M-H curve of ferromagnetic materials encloses a hysteresis area. This hysteresis is due to the occurrence, during the magnetization and demagnetization process of the material, of irreversible energy dissipation phenomena.
More specifically, the magnetization curve of a ferromagnetic material can be considered as the result of two processes:
1) The Bloch walls movement, which produces an increase of the volume of the domains oriented in the direction of easy magnetization closer to the direction of the applied field;
2) The rotation of the domains magnetization in the direction of the applied field.
Figure 5 –M-H curve for a ferromagnetic material
In Figure 5, an example of first magnetization curve and the corresponding hysteresis loop for a ferromagnetic polycrystalline sample are shown. Each region of the curve is
- 7 -
characterized by a different process responsible for the increase of the magnetization intensity and the energy losses, the total contribution of which gives rise to the hysteresis.
In the first section of the curve (corresponding to low intensities of applied field) the magnetization increase is due to the movement of the Bloch walls. Such movements have irreversible character, due to the fact that the wall, moving, meets impurities of the material, such as foreign atoms, cavities, structural defects, e.g. vacancies or dislocations, or regions in which there are elastic stresses. All these "discontinuities" represent, for the Bloch walls movements, "high-energy barriers", in correspondence of which dissipation phenomena occur.
In correspondence of high values of the applied magnetic field, the energy required by the wall to overtake the high energy barriers is provided by the magnetic field also via a local orientation of the dipoles in a direction parallel to the the direction of the applied magnetic field. In this case, once the "obstacle" is overcome, the energy associated to the local rotation of the dipoles is largely dissipated, mainly because of two processes: i) the rapid variation of the magnetization causes a change of the induction field inside the crystal and, thus, produces induced leakage currents; ii) the elastic deformation effects due to the magnetization variation produce shock waves that are then absorbed.
The Bloch walls movement stops when the domain, oriented in the direction of easy magnetization closest to the applied field, coincides with the grain; over this dimension it can not grow anymore as the presence of the grain boundary prevent further displacement of the walls.
Starting from this moment, the increase of magnetization, is only due to the dipoles rotation towards the direction of the applied magnetic field. The spent energy is, in this case, the energy required to overcome the magnetocrystalline energy barrier. This process is not characterized by significant dissipation phenomena; therefore, it can be considered as a reversible phenomenon.
The maximum magnetization reached by the material is called "saturation magnetization" Ms.
With the decrease of the applied field strength a loss of magnetization occurs due to, at first, the reorientation of the dipoles within the domains along the direction of easy magnetization and, then, the Bloch walls movement.
Because of all the dissipation processes described above, in correspondence of H = 0 a residual magnetization is present. With the increase of H in the opposite direction, the
- 8 -
motion of the Bloch walls continues until the magnetization reach the zero value in correspondence of a certain intensity of applied magnetic field Hc, which is called
"coercive field" (or coercivity). In correspondence of a further increase of the applied magnetic field, Bloch walls movement continues until the domains correspond to the grains. Then, rotation processes occur and saturation magnetization in the opposite direction is reached. Reversing the intensities of the applied field H, the described processes occur again in the opposite direction and the hysteresis loop closes.
The area enclosed by the magnetization curve (M-H curve) is, thus, proportional to the energy losses due to irreversible phenomena related to the variation of magnetization.
1.1.2 - Changes in magnetic properties with decreasing size
Hereinafter, the main phenomena occurring in a magnetic material when its characteristic size decreases under certain critical dimensions and the main magnetic properties which occur at the nanoscale are briefly described.
1.1.2.1 - The steady-state: from the multi-domain configuration to the single domain configurationIt is well known that the equilibrium state of a thermodynamic system under conditions in which the temperature (T) and the extensive variables, except the entropy, are constant, corresponds to the minimum of free energy, which can be described by:
A = U-TS 5)
where A is the free energy, U the internal energy, T the temperature and S the entropy of the system.
If the temperature of a ferromagnetic system is constant and enough lower than the Curie temperature (Tc), the system is characterized by a high level of macroscopic
order. Consequently, the entropies of all the possible configurations are not significantly different. Therefore, it is possible to assume that the free energy differences between all the possible configurations of the system mainly depend on the differences in the internal energy (U). From a purely qualitative point of view, it is thus possible to define the steady state of a ferromagnetic structure as the state of minimum internal energy.
- 9 -
In order to qualitatively explain the phenomena occurring in ferromagnetic materials when their characteristic dimensions are reduced, let consider a single crystal of a ferromagnetic material, where the energy contributions affecting the state of minimum internal energy can be summarized as:
1) The anisotropy energy; 2) The magnetostatic energy; 3) The domain walls energy; 4) The elastic energy.
The anisotropy energy is due to the existence, in ferromagnetic crystals, of a magnetocrystalline anisotropy, which is an intrinsic characterist, due to the spin-orbit coupling. Such anisotropy energetically promotes the alignment of the magnetic dipoles along a specific direction which is defined as the "preferential magnetization axis". This means that, from the point of view of the sole anisotropy energy, the steady state (minimum energy) of the system should be the state determined by the alignment of all magnetic dipoles along the preferential axis of magnetisation.
However, in addition to the anisotropy, other energy phenomena occur. In particular, if we consider a single domain single crystal (as that one represented in Figure 6), it is possible to observe that, at the far ends of it, there are two opposite polarities, which produce a magnetic field extending in the surrounding space. The associated magnetostatic energy, which is the potential energy generated when a magnetic body is in a magnetic field, decreases with the decrease of the volume occupied by the field. Therefore, taking into account also the magnetostatic contribution, a multi-domain configuration which minimizes the magnetostatic effects results to be energetically favorable.
It is worth noting, however, that the presence of contiguous domains oriented in different directions, are associated to the presence of transition regions, the Bloch walls, in which a gradual variation of the orientation of the spins occurs. These regions are therefore characterized by a finite thickness, minimum energy state of which depends on the sum of two opposite energy contributions: on the one part i) the energy required to overcome the exchange interactions that promote the parallel orientation of all the dipoles, the effect of which would result in very large wall thicknesses ; on the other part ii) the effect due to the fact that the spins inside the Bloch wall are not oriented along one of the easy magnetization directions (those along which the spins inside
- 10 -
domains are oriented) and therefore an anisotropy energy is associated to them, the minimization of which leads to a reduction of the wall thickness.
Therefore, the domains formation is associated to an increase of the internal energy due to i) the increase of the anisotropy energy for the formation of domains that can be oriented in a different direction with respect to the axis of preferential magnetization, ii) the increase of the elastic energy due to magnetostriction phenomena that occur in the presence of differently magnetized domains, and, moreover, iii) the increase of the energy contribution due to the formation of Bloch walls, called “wall energy”, which is proportional to the surface.
Considering that the magnetostatic energy increases with the volume of the space occupied by the magnetic field, and thus with the volume of the single crystal, if considered as a single domain crystal, it is easy to understand that a multi-domain configuration is energetically favored when the dimensions of the crystal are greater than a certain critical dimension. This is due to the low surface-to-volume ratio, and thus to the fact that the reduction of magnetostatic energy is predominant in respect of the increase of the wall energy. On the contrary, below a certain critical size of the crystal, the increase of the energy associated to the presence of the Bloch walls is no longer compensated by the decrease of magnetostatic energy (because of the increased surface / volume ratio) and the single domain configuration becomes the energetically favored state.
The foregoing can be explained by considering that the magnetostatic energy, for a single crystal domain, can be expressed as:
V NM Ems 0 s2 2 1 6)
where Ms is the value of the spontaneous magnetization along the preferential axis of
magnetisation of the crystal, N is a demagnetization factor, V is the crystal volume. If we consider, for example, a crystal in which there are two domains magnetized in opposite directions along the same axis of easy magnetization, the corresponding magnetostatic energy will be reduced by approximately 50%. Indicating with γ the sum of the terms that contribute to the increase of the internal energy due to the formation of the Bloch wall, the energy variation of the system between the single domain configuration and the configuration with two domains can be expressed as:
![Figure 1 – Schema of a generic magnetic nanoparticle for biomedical applications [4]](https://thumb-eu.123doks.com/thumbv2/123doknet/5533125.132269/31.892.160.829.242.565/figure-schema-generic-magnetic-nanoparticle-biomedical-applications.webp)