Water Quality Assessment that helps
stakeholders implementing the WFD
European Geosciences Union General Assembly 2011
Vienna, Austria, 03-08 April 2011
JF Deliège, A Grard, E Everbecq : Aquapôle, University of Liège, Belgium
P Weingertner, C Conan, JL Salleron : French Water Agency Rhin-Meuse O Coulon, O de Guibert : French Water Agency Loire-Bretagne
• The P
EGASEModel
o
Working Scheme
• A
PPLICATIONSF
ROMS
TAKEHOLDERSo
French Water Agency : AERM
o
French Water Agency : AELB
• C
ONCLUSIONS
Integrated water analysis & manag
t sustainable development :
o
Manag
ttools improv
t ecological, economic and social stakes
o
Predictive models (e.g. P
EGASEmodel)
o
Support public and private operators in implementation of WFD
Treatment and management of sewage effluents
Analytic measurements of water quality
Cooperation with Southern countries (the “
South Latitudes
” Cell)
Knowledge of aquatic ecosystems & impacts related to pollution
Public Admin. Industry
R&D centre
Expertise in water domain
Introduction
Biology
CART (Water analysis)
CEBEDEAU
(Measurements & purification)
Climatology Ecotoxicology
Geomatic Geomorphology
Hydraulic
Hydrology & Agronomy Hydrogeology
Hydrography Oceanology Topoclimatology
Toxicology
Water & Environment Unit Other Aquapôle Members
P
EGASE
Model
P
lanification
E
t
G
estion de l’
AS
sainissement des
E
aux
Planning and Management of Water Purification
Developed for 25 years By 3 universities
1) Simulation of surface water quality
Relation Watershed / Rivers ( extending “river” models) Taking into account all Pollutants loads and Discharges
data structuration
Representation of the Aquatic Ecosystem and the Water Quality (O2, C, N, P, …) Deterministic model and physically based
2) Operational Decision Making Tool for
Purification and Depollution
Management of aquatic environment quality / WFD / Management plans …
Continuous interaction with users
• Better understand the mechanisms of the hydro-system
• Quantify “pressure-impact” relationships and ease decision making • Structure knowledge (including “Input Data”)
Objectives
Usage
EGU, Vienna, Austria, 03-08 April 2011
Main Partners Public Authorities in charge of surface water management
EGU, Vienna, Austria, 03-08 April 2011
Main applications over Europe
Ministry of Environment, Luxembourg Agence de l’eau Loire-Bretagne, France Agence de l’eau Adour-Garonne, France
Agence de l’eau Rhin-Meuse, France
Vlaams Milieu Maatschappij, Flemmish Region, Belgium Ministry of Environnement, walloon Region, Belgium
Cross Border (Scheldt, Meuse, Mosel)
Other Applications: Upper Wisla (Poland), Itajai (Brasil), Nicolet (Canada), Iskar (Bulgaria), Medjerda (Tunisia)
Transnational Application : DHI of the Meuse (F, B, Lux, D, NL)
P
EGASE
Working Scheme
Ruissel Apports Biomasses
39 0 Lessivage Directs Importations
Ass. autonome 0 0 des sols Bovins Amont
31 8 0 0
non raccordé Raccordé Raccordé Non raccordé Agri
3 Non collecté 0 0 Non collecté 0 165 Non connecté Non connecté
8 5 Bypass 0 0 Bypass 0 0
Tx fuite 0 0 Tx fuite
26 0 0 0
Apports dispersés Sortie stations Sortie stations Apports dispersés
1 0
Dégr. Pts Rus Dégr. Pts Rus
253 10 2 Total apports au réseau hydrographique décrit : 295
Flux amont Flux aval
Azote 0 293 Azote
Phytoplancton 0 0 Azote dans les rivières décrites 295 1 Phytoplancton Bactéries 0 Stockage en rivière : 0 1 Bactéries
295
Total disparitions du réseau hydrographique décrit : 0 0 Dénitrification planctonique
Prélèvements 0 Dénitrification benthique
Immobilisation
Distance source (km) 0 Total dénitrifié macrophytes 14.79 Distance source (km) Débit (m³/s) 0 0.8 Débit (m³/s) Bassin versant total (km²) 0 33 Bassin versant total (km²)
PEGASE : Bilan de l'azote (kg N/jour) Rejets urbains Rejets industriels
Export/Import 0 0 0 0 Stations d'épuration 0 30 0 PEGASE model DTM data River tree Activities /impacts Meteo data Measurements (flow, t°, …) Water Quality and fluxes Hydrologic results Polluting loads Biomass evolution Validating Simulation : Nitrates concentrations, Nitrogen and ammonium
(Meuse, 1996)
EGU, Vienna, Austria, 03-08 April 2011 Validating Simulation
Urban Releases
Equivalent-inhabitant
Consideration of abatements in treatment plants (measures or estimates)
Industrial releases
Inventory of discharges (fees, …)
Cattle
“Accidental” direct discharge of Livestock (tanks, …)
Diffuse Loads
Semi-statistical functions, region specific = run-off x leaching concentrations possibility of coupling with soils models
Loads and Discharges
Estimates of loads and discharges (C, N, P)
P
EGASE
Model
Additional Features
• Integrated model for rivers & watershed
• Accurate Simulations for a few km² several 100 000 km²
• “Refined” Description of river tree
(>> Thousands rivers)• Complete Description of ecosystems
(phytoplankton, bacteria...)• “Coherent and complete” modelling of loads and discharges
• Stationary and/or unstationary Simulations
(several CPU hours)• Globalisation of results per river, water bodies, basin, …
• Calculation of statistics for comparison
(p90, mean, median, …)
Complementary Modules WFD (cost/efficiency, balance, ...) User-friendly interface Linked to GIS Numerous IO Format Coupled to hydrogeological/ hydrological/meteorological/… Modules if necessary Open MI Compliant EGU, Vienna, Austria, 03-08 April 2011Processes
• primary production
• mortality, biomasses respiration • degradation organic matter
• nitrification, de-nitrification • re-aeration
Variables
• flows, velocities, transfer time in the hydrographical network • temperature
• concentrations : OM, DOC, POC, COD, BOD, NH4, NO2, NO3, NKj, Ptot, PO4, dissolved O2 (hourly)
biomasses
Results
• longitudinal results, temporal evolutions, maps & charts:
calculation of statistics (p90, …), quality indices SEQ-Eau (French index)
• globalisation of results per river, per water body, per basin, … :
flux, balances
The Water Quality Model
EGU, Vienna, Austria, 03-08 April 2011 Quality Map of Hydrological
Network :
SEQ-Eau index organic matter (Loire Basin)
Total length of river
water bodies = 13 200 km
50 km
N
95 % of the river network
EGU, Vienna, Austria, 03-08 April 2011 Application from Stakeholder AERM
(French Water Agency : Agence de l’Eau Rhin-Meuse)
PEGASE Modeling
Length of simulated river water bodies = 12 600 km
PEGASE : a homogeneous and consistent tool throughout the basin
PATRICK WEINGERTNER, CÉLINE CONAN
-Channels (info not available) + Transnational basins
(French Water Agency : Agence de l’Eau Rhin-Meuse)
EGU, Vienna, Austria, 03-08 April 2011
The diagnostic is consistent with results of the monitoring networks
Comparing model diagnostic Average of 90 percentiles
monitoring network results by water body The worst 90 percentile if several points
86 % of the 202 water bodies have diagnostic validated by both methodologies
PEGASE Implementation
Application from Stakeholder AERM
(French Water Agency : Agence de l’Eau Rhin-Meuse)
EGU, Vienna, Austria, 03-08 April 2011
Estimating the impact of local measures on the aquatic environment
combination of PEGASE results and the expertise of the stakeholder
Setting up the programs of WFD measures
impact of the measures taken to reduce emissions of classical
pollutants (organic matter, nitrogen or phosphorus) from domestic and industrial waste water
Simulations of prospective quality considering different hypothesis : • population trend of the 3300 municipalities
• improvement of the individual purification for 600 municipalities • 650 new sewage connections
• 300 new wastewater treatment plants (in addition to the 650 existing)
• 100 measures on industrial releases (on 360 releases) PEGASE = tool for assessing the physico-chemical quality of surface water bodies
Thanks to the validation processes
(French Water Agency : Agence de l’Eau Rhin-Meuse)
EGU, Vienna, Austria, 03-08 April 2011
Selection of the most effective local measures
analysis « cost-efficiency »
combination of the most economical measures among the combinations of possible measures to achieve environmental objectives (particular care for measures related to the
communities purification [which are the more expensive])
Achieving annual saving of 60.106 €
(8% of the cost of good status)
Setting up the programs of WFD measures
PEGASE = tool for assessing the physico-chemical quality of surface water bodies
Thanks to the validation processes
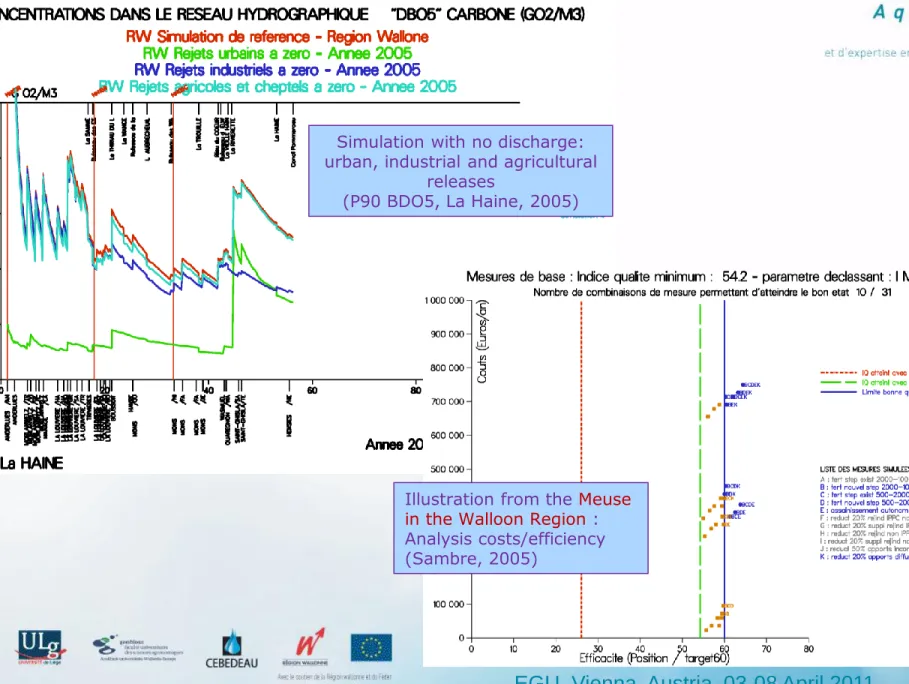
Type of Results
Simulation with no discharge: urban, industrial and agricultural
releases
(P90 BDO5, La Haine, 2005)
EGU, Vienna, Austria, 03-08 April 2011 Illustration from the Meuse
in the Walloon Region : Analysis costs/efficiency (Sambre, 2005)
(French Water Agency : Agence de l’Eau Rhin-Meuse)
EGU, Vienna, Austria, 03-08 April 2011
Impact of the releases on the status of the surface water bodies
estimation of the expected status of the water bodies (physico-chemical quality added by the biological quality)
Helps to establish the priorities of intervention programs of the Agency
(selectivity of operations)
Indication of the water flows at the point of the releases
in order to assign a priority level
Supports the development of the state of the art in the
International basin Mosel-Saar (France, Luxemburg, Germany)
PEGASE = tool for assessing the physico-chemical quality of surface water bodies
Thanks to the validation processes
Application from Stakeholder AELB
(French Water Agency : Agence de l’Eau Loire-Bretagne)
EGU, Vienna, Austria, 03-08 April 2011
In the framework of the SDAGE (schéma directeur d'aménagement et de gestion des eaux), reducing the phytoplankton concentration in the river
Two solutions to achieve this objective:
• Dephosphatation in WWTP (< 2 000 EH)
• Remove the barriers (which contribute to eutrophication)
mg chla/m³
O. COULON, O. DE GUIBERT
WFD implementation (SDAGE elaboration) Reduce the phytoplankton
(French Water Agency : Agence de l’Eau Loire-Bretagne)
EGU, Vienna, Austria, 03-08 April 2011
WFD implementation (SDAGE elaboration) Reduce the phytoplankton
Application from Stakeholder AELB
(French Water Agency : Agence de l’Eau Loire-Bretagne)
EGU, Vienna, Austria, 03-08 April 2011 Conclusions:
• Simulations indicate that barriers removal may be effective
• No change imposed to the WWTP
• Open debate to choose the best solution regarding the local complete
characteristics of the river system
mg chla/m³
WFD implementation (SDAGE elaboration) Reduce the phytoplankton
Conclusions
EGU, Vienna, Austria, 03-08 April 2011
Contribution to the implementation of the Water Frame Directive
(2000/60/CE)
• Diagnostic of river and channel water bodies before and after
considering various scenarios of measures
• Extrapolation of locally sampled data to the whole set of water bodies
• Analysis cost/efficiency of various combinations of possible measures
• Support to programmes of measures elaboration
Contribution of balances and diagnostics to interventions and
specific valuations
• Establishment of intervention priorities (e.g. In the field of purification)
• Technical support to administrations for local actions
• Impact studies of treatment plant, industrial or urban releases
• Geographical modulation of subventions and fees
• Support to definition of actions at international level (cross-border
EGU, Vienna, Austria, 03-08 April 2011
P
EGASE= tool for assessing the physicochemical quality of surface
water bodies through the validation processes
The model implementation allows
• Technical support for agencies
credibility, optimization of choices and funding provided
• Setting up of intervention priorities
• Choice of required measures to
achieve the objectives of good status over water bodies
• Better use of public funds
Economy for communities or industries to carry out work
Application from Stakeholder AERM
(French Water Agency : Agence de l’Eau Rhin-Meuse) Own Conclusions