THE DISSOCIATIVE IONIZATION IN OXYGEN
R. LOCHT AND J. SCHOPMAN
Département de Chimie Générale et Chimie Physique, Sart Tilman par B-4000 Liège 1 (Belgium)
Abstract
Dissociative ionization in O2 has been examined by means of a retarding potential lens combined with a
quadrupole mass spectrometer. This particular arrangement made possible detailed analysis of the O+ ions kinetic energy distribution and the measurement of threshold energies of O+ ions with known kinetic energy. These two types of informations bring new experimental evidence, besides direct dissociative ionization of O2,
for predissociation of the B2Σg- state, the 2Пu state and the c4Σu- state of O2+. A new predissociation of the
O2 +
(2∆g) state has been found. At low ion-energy the predissociation of the 2
Φu state or an autoionizing
predissociation is observed. Introduction
The present and succeeding papers of this series will deal with the study of the dissociative ionization of molecular gases by means of kinetic energy distribution analysis of the ionized fragments.
In order to characterize completely a dissociative ionization process, (i) the identity of the fragments, (ii) their kinetic energy distribution and (iii) the onset energy for these fragments with known kinetic energy, are needed. Except for homonuclear diatomic molecules, a kinetic energy analysing system combined with a mass spectrometer has to be used to perform such an experiment.
In the past, essentially two ion-energy analysing techniques have been used in combination with electron impact mass spectrometry, i.e. the retarding potential method [1-3] and the more commonly used deflection of the ion beam by an electric field [4-10]. When the measured full width at half maximum (FWHM) of a molecular ion is used as a definition of the energy resolution, it was about 1 eV in the former method and lies between 0.2 eV and 0.3 eVin the latter technique.
During the last few years interest has been renewed in dissociative ionization in diatomic gases, either by electron impact or photon impact. The most commonly used kinetic energy analysing techniques are the 90° or 127° cylindrical energy analyser [6, 9, 10] and the time-of-flight method [11-13]. In the present work the kinetic energy measurements are performed by using an improved retarding potential technique before mass analysis. The experimental arrangement will be discussed below.
The dissociative ionization in oxygen has been the subject of several papers. Hagstrum [2] published a retarding potential curve of O+ from O2 as observed by means of a retarding field applied to the O
+
ion beam, following mass analysis. In this curve some structures are observed. Ehrhardt and Kresling [7], using the deflection technique combined with a mass spectrometer, were the first to make an extensive study of the dissociative ionization in O2 under two aspects, i.e. the kinetic energy distribution of the fragments and the
threshold energy of ions with known kinetic energy. Four dissociation limits are determined by this way. Doolittle [3] examined the ion-energy distribution curve of O+ formed by photoionization. Freund [11] studied the kinetic energy distribution of metastable and of highly excited Rydberg oxygen atoms. The signals due to these species are also followed as a function of the energy of the impinging electrons. Recently Stockdale [12] published the O+ energy distribution curve obtained by electron impact on O2.
The purpose of the present work was twofold. First, the study of the kinetic energy distribution of the O+ fragment ion by means of a retarding potential system characterized by an improved resolution, so that detailed analysis is possible. Second, to measure the threshold energy of the O+ ions carrying known minimum kinetic energy, thus allowing the identification of the processes and the interpretation of the features observed in the O+ ion-energy spectrum.
DISSOCIATIVE IONIZATION PROCESSES
Although the following considerations have been discussed many times [2, 4, 7], we believe however, that it will be helpful to review briefly and to emphasize some aspects of the dissociative ionization occurring under the impact of low energy electrons on an isolated diatomic molecule.
When an electron of sufficient energy impinges on a diatomic molecule, two types of dissociative ionizations are possible: (i) the dissociation into either a negative ion or a positive ion and a neutral fragment by processes (1) and (2) respectively
AB+e-→A- + B (1) AB+e-→ A+ + B+2e- (2) and (ii) the dissociation into both negative and positive ions by process (3)
AB+e-→A+ + B- + e- (3)
Processes (1) and (3) have been discussed in detail in earlier papers [14, 15]. We will discuss in more detail process (2) in which we distinguish three cases illustrated in Fig. 1, i.e. (a) the dissociation through a transition to the repulsive part of a stable state, (b) the predissociation of a stable molecular ion state and (c) the dissociation through a transition to an unstable state of the molecular ion. Many subcases, described elsewhere [16, 17], will not be considered in this paper.
Under the impact of electrons with increased energy, the molecule is excited to ionic states as well as to excited neutral states which can autoionize to a lower energy ionic state. Both cases have to be considered in dissociative ionization [11, 18].
Fig. 1. Schematic potential energy diagram of a diatomic molecule AB showing the three dissociative ionization processes considered in the present paper.
Let us consider a molecule AB in its vibronic ground state. Electrons ofincreasing energy impinging on the molecule can induce a dissociation following process (2). During this Franck-Condon vibronic transition the system can reach (i) the repulsive wall of a stable ionic state at or close to the dissociation limit or (ii) a repulsive state of the molecular ion (see Fig. 1). In both cases a continuous distribution in the ion-energy is observed. It has been pointed out [14, 15] that (i) the relative position of the potential energy curves of the initial (neutral) state and the final (ionic) state of the molecule, and (ii) the shape of the potential energy curve of the final state of the molecule determine the shape of the kinetic energy distribution function and the minimum kinetic energy carried away by the fragment ion. In a first approximation, the shape of the kinetic energy distribution of the fragment ion could be obtained by the reflection method. In this method the square of the ground state vibrational eigenfunction is reflected in the repulsive part of the upper state onto the energy axis (see Fig. 1). The amount of total kinetic energy involved in the dissociative ionization process is related to the slope of the potential energy curve within the Franck-Condon region. After dissociation, the total kinetic energy involved is spread over the two fragments according to the law of momentum conservation. The kinetic energy t carried away by A+ is given by
(I)
where T is the total kinetic energy involved in the process, mA and mB the masses of A and B respectively.
Further, it is well known that the threshold energy (AP) for the appearance of A+ is given by AP(A+) = D(A-B)+I(A) + Eexc + T (II)
where Eexc is the internal energy of the ionized and neutral species. If AP0 is defined by the following expression:
AP0(A +
) = D(A-B)+I(A) + Eexc (III)
the combination of eqns. (II) and (III)
(IV)
yields a linear relation between the measured threshold energy of the fragment ion A+ and the kinetic energy
carried away by the same ion.
A neutral or ionized molecule can choose another channel to dissociate, i.e. by radiationless transition to a repulsive curve which crosses a stable state.This process is called an electronic predissociation [16], the only one considered in this paper. By the interaction between the bound state and the lower lying continuum, if the predissociation life-time is longer than a vibration period, the total excess energy with respect to the lower-lying dissociation limit is converted into kinetic energy carried away by the fragment for each vibrational level. Consequently, the ion-energy distribution reflects the vibrational structure of the predissociated state (see Fig. 1).
The transitions from the stable state to the continuum are governed by Kronig's selection rules [16] and predissociation life-times are spread over the 10-12-10-6 s range depending upon the nature of the molecular ion states involved. These rules have recently been revised in cases where spin-orbit coupling has to be considered [21]. Predissociations of diatomic molecular ions with life-times of the order of 10-6 s have been observed in sectorfield mass spectrometers as "metastable" peaks characterized by their shape, width and position at fractional mass numbers [19-21].
EXPERIMENTAL Apparatus
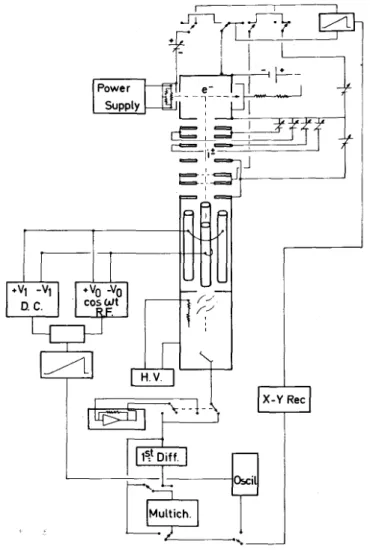
The measurements to be described in the following sections of this paper were made with the apparatus schematically shown in Fig. 2.
The ion source is a conventional Nier-type. The ion beam, after being focussed on the source exit slit, passes through a retarding lens, and is accelerated at the entrance slit of a quadrupole mass spectrometer. The ion current corresponding to the desired mass ratio m/e is collected on a 14-stage electron multiplier. The ion current
can be continuously scanned either with respect to the retarding potential at fixed electron energy or with respect to the electron energy at fixed retarding potential. Both signals can be electronically first differentiated. The scan rate has to be adapted to the response time of the differentiation device. Both retarding curves and ionization efficiency curves are stored in a thousand channel multichannel analyser and/or can be plotted on an X-Y recorder.
It has also to be pointed out that, contrary to experiments performed with sectorfield mass spectrometers, in the present apparatus no dissociation life-time discrimination takes place. Consequently, dissociations and/or predissociations of 10-12-10-6 s are detected.
Ion source and retarding lens
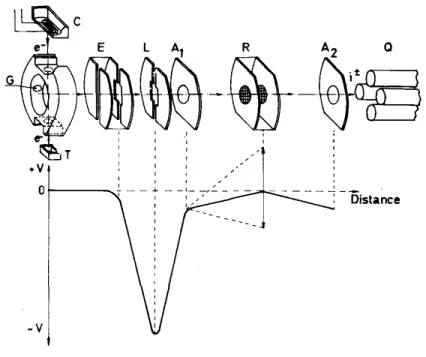
A more detailed drawing of the ionization and retarding region is given in Fig. 3. The ionizing electron beam is focussed by means of permanent magnets. The strength of the magnetic field in the ionization region is of the order of 30 G. The full width at half maximum (FWHM) of the electron energy distribution is 0.4 eV. The ions formed in the ion chamber are allowed to drift to the extraction lens E maintained at the same potential as the ion chamber, to avoid as much as possible penetrating fields in both the electron beam and in the interaction region. The lens L, typically at 60-80 V, focuses the ion beam on the source exit slit A1. At these potentials a
maximum of 5 mV penetrating field is present in the centre of the electron beam. The ion-accelerating voltage applied to A1 and A2 is maintained at a potential difference of 1.0-10 V in normal operating conditions. The ion
source exit slit A1 and the mass spectrometer entrance slit A2 are at the same potential. As found in a previous
mass spectrometric work [14, 15], the kinetic energy discrimination in the ion source used in this work is low. This has been independently confirmed by Köllmann [9].
Fig. 3. Detail of the ion source and retarding lens: (C) cathode; (G) gas inlet; (T) electron trap; (E) extraction lens; (L) focussing lens; (R) retarding lens; (A1, A2) ion accelerating lenses; (Q) quadrupole mass spectrometer.
The lower diagram gives the potential applied to the plates along the ion beam path.
The ion retarding potential is applied to a system formed by two grids R. Calculations as well as the experiment showed that with a single retarding slit the electric field is inhomogeneous. Moreover the field strength along the optical axis, in the plane of the retarding plate, is strongly dependent upon the electric fields applied to the other lenses. This introduces an energy shift in the measured kinetic energy distribution which depends upon the potentials applied to the retarding slit. This effect, as well as the lack of homogeneity of the electric field, can considerably be reduced by the use of a grid. More efficient, however, is the use of a parallel grid-pair system. At the central plane of this system, the electric field is small and homogeneous. By the increase of the distance between the two grids, these effects could be improved. However, the longer the distance, the smaller the field gradient, and therefore the space charge will increase. Calculating the different conditions, a system of two grids separated by 0.47 mm was chosen. This reduces however the transmission of the lens system, and the probability that fragments lose some energy by scattering on the grids is higher. The linearity of the retarding potential energy scale is about 10 mV over a range of 10 V. Compared to a conventional retarding system, the resolution has been considerably improved. Using the FWHM of the first differentiated retarding curve of a rare gas ion or a molecular ion, the characteristics of the retarding lens have been analysed as a function of the instrumental parameters. The FWHM is practically independent of the fields applied to the focusing lenses. The extraction field is maintained at zero throughout, with respect to the ion chamber. The electron accelerating potential is without any effect on the FWHM. Comparing retarding potential curves at fixed electron energy and under defined ion-optical conditions, the experiment shows that the FWHM of the first differentiated retarding curves depends upon the ion-accelerating voltage and the ion source temperature, and decreases when the value of these parameters decrease. Below 2µA electron trap current, the FWHM remains unchanged.
Operating conditions
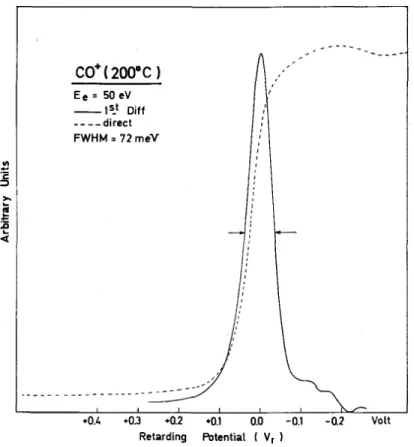
Kinetic energy measurements. In the operating mode for kinetic energy measurements, the ion source is kept at 200 °C for optimal operation, even when the FWHM is better at lower temperature. The reason is that at lower temperatures slow and relatively important potential drifts are observed when long term stability is required. In order to have a long term stability of the order of no more than 10 mV drift in the retarding potential, it is necessary to work at constant temperature, ca. 180-200°C, and relatively constant gas pressure. The ion-accelerating voltage is maintained at 1.0-2.0 V to get a FWHM of 80 mV maximum. A typical molecular ion retarding curve obtained in these conditions is shown in Fig. 4. The first differentiated retarding curves obtained
in this work, at high electron energies, were stored in a multichannel analyser for two hours. A storage time of up to 72 h is required for differentiated retarding curves close to the threshold of the fragment ion. The origin of the kinetic energy scale is taken at the position of the maximum of the molecular ion differentiated retarding curve. The energy values of the maxima positions observed in the differentiated retarding potential curve are the averaged values over more than 30 independent experiments. The figure given after each maxima position is the standard deviation σ.
Fig. 4. Typical thermal ion-energy distribution obtained for a molecular ion; (---): direct retarding curve; (———): electronically differentiated retarding curve.
Appearance potential measurements. In order to have higher intensities, only the ion accelerating voltage is increased - to 10 V. During operation, a fixed retarding potential is applied (enabling kinetic energies to be measured) with respect to the maximum of the molecular ion differentiated retarding curve used as internal standard for the kinetic energy scale calibration. The electron energy scale is calibrated with respect to the molecular ion first ionization potential taken twice a day. Each ionization efficiency curve at a fixed retarding potential value is repeated five times. The quoted error given after each threshold energy, unless otherwise stated, is the reproducibility of the measurements.
The threshold energy of the fragment ion, being derived from the first differentiated ionization efficiency curves, is taken at the point of intercept of the linear extrapolation of the first differential ionization efficiency curves with the electron energy axis [14, 15].
To ensure no instrumental artefact is present in the ionization efficiency curves, the first differentiated ionization efficiency curve of the helium ion has been recorded, and no structure has been found in the electron energy range between threshold and 40 eV. From the second differentiated ionization efficiency curve, the electron energy distribution function is obtained and used for the deconvolution of the ionzation efficiency curves [14, 15]. This technique has not been applied to the present data.
In the particular case of oxygen, the gas is obtained by the introduction of dried air flowing through a liquid nitrogen trap. This procedure allows the partial pressure of O2 to drop in the ion chamber, avoiding a too
quick burn-out of the emitting filament. In such a way it was possible to keep the ion source working continuously during three to four weeks and to obtain minimum potential drifts. However this procedure has the
disadvantage that low O+ ion currents are measured. The total pressure in the vacuum chamber is 6 x 10⁻⁷ torr. For the electron energy scale calibration both the ionization potential of O2, at 12.074 eV [22] as well as the
appearance potential of the first ion-pair process in O2, at 17.25 eV [15], have been measured.
Fig. 5. O+ ion energy distribution obtained at 60 eV [1] and at 35 eV [2] electron energy.
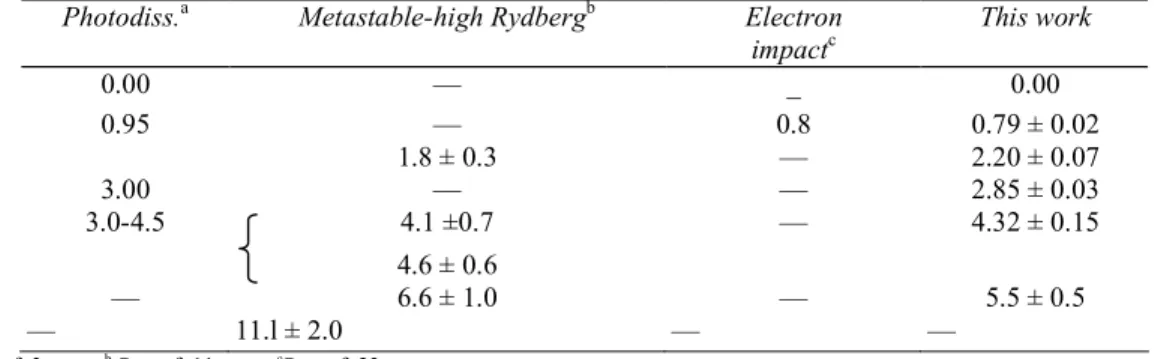
Table 1- POSITION OF THE MAXIMA OBSERVED IN THE O+ ION-ENERGY (eV) DISTRIBUTION FORMED
BY 60 eV AND 35 eV ELECTRON IMPACT ON O2
Photodiss.a Metastable-high Rydbergb Electron
impactc This work 0.00 — _ 0.00 0.95 — 0.8 0.79 ± 0.02 1.8 ± 0.3 — 2.20 ± 0.07 3.00 — — 2.85 ± 0.03 3.0-4.5 4.1 ±0.7 — 4.32 ± 0.15 4.6 ± 0.6 — 6.6 ± 1.0 — 5.5 ± 0.5 — 11.l ± 2.0 — — a See ref. 3. b See ref. 11. c See ref. 23.
Figure 5 shows an example of the kinetic energy distribution of O+ formed by the impact of 60 eV and 35 eV electrons. It should be pointed out that all the structures observed at 60 eV, are still present in the first differential retarding curve at 35 eV electron energy. In Table 1, the kinetic energies corresponding to the maxima observed in the distribution of O+ from O2, are listed and compared with previously published values. At
low energy, the agreement of both the shape of the kinetic energy distribution and the position of the maxima is satisfactory. At higher energies, there is a large discrepancy not only between the positions of the maxima, but also in the relative intensities. Comparing the kinetic energy distributions, at electron energies of 35 eV and 60 eV, with those measured by detection of metastable and high Rydberg oxygen atoms [11], it is evident that the relative contribution due to the latter is much larger, at high electron energy, than in the present electron impact experiment. No peak is found at 11.1 eV. An explanation for these discrepancies could be a major contribution from double ionization and/or double excitation processes as follows:
O2+e - → O2 2+ + 3e- → O2+ + O* + 3e- (1) O2 + e- → O2** + e- → O* + O* + e- (2)
Process (1) could only occur for electron energies higher than 53 eV. It is likely that very high Rydberg states of O2 will be responsible for the apparent discrepancy in the kinetic energy distributions of O
+
from O2.
Our results are in satisfactory agreement with the photodissociation work of Doolittle [3] over the range 0.0-4.5 eV.
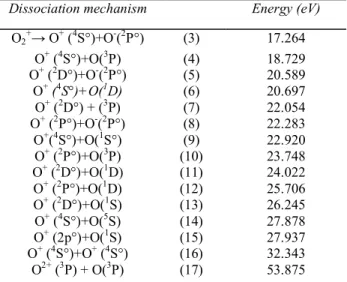
Table 2-CALCULATED ENERGIES FOR SEVERAL PROCESSES OF FORMATION OF O+ +O FROM MOLECULAR OXYGEN
Dissociation mechanism Energy (eV)
O2 + → O+ (4S°)+O-(2P°) (3) 17.264 O+ (4S°)+O(3P) (4) 18.729 O+ (2D°)+O-(2P°) (5) 20.589 O+ (4S°)+O(1D) (6) 20.697 O+ (2D°) + (3P) (7) 22.054 O+ (2P°)+O-(2P°) (8) 22.283 O+(4S°)+O(1S°) (9) 22.920 O+ (2P°)+O(3P) (10) 23.748 O+ (2D°)+O(1D) (11) 24.022 O+ (2P°)+O(1D) (12) 25.706 O+ (2D°)+O(1S) (13) 26.245 O+ (4S°)+O(5S) (14) 27.878 O+ (2p°)+O(1S) (15) 27.937 O+ (4S°)+O+ (4S°) (16) 32.343 O2+ (3P) + O(3P) (17) 53.875
D°o(O2) = 5.115 eV (16), IP(OI) = 13.614 eV, IP(OII) = 35.146 eV and energy levels of O + and O from: C. E. Moore, Atomic Energy Levels,
Circ. NBS 467, Vol. I, 1949.
The results of threshold energy measurements as a function of increasing retarding potential has been summarized in Fig. 6.
It is clearly seen that four dissociation limits, the first four ones in Fig. 6, are measured at zero volt retarding potential. Two other limits are found by linear extrapolation of the straight lines obtained by plotting the kinetic energy of O+ versus the electron energy. The threshold at 17.25 eV, due to the first ion-pair process, has been discussed elsewhere [15]. Only the five other limits will be discussed in this section. The error bars on each point give the reproducibility of the threshold energy measurements.
For convenience, in the next discussion, the dissociation limits and the corresponding energies are tabulated in Table 2. The threshold energy for ion-pair processes are listed also. Only the first process is observed. Because of the low intensity of the O+ ion current due to these processes at higher electron energy, they are not observed in the present experiment [15].
Dissociation processes to (18.69±0.04) eV
Threshold energies of O+ ions have been measured up to 3.5 eV kinetic energy, and the straight line drawn with the proper slope of 0.5 extrapolates to 18.69 eV. This is in good agreement with the results obtained by Ehrhardt [7]. A particular feature, showing up as a deviation from linearity, is found at (19.8 ± 0.2) eV. The low kinetic energy tail of this straight line corresponds partially to the second peak observed in the kinetic energy distribution at (0.79 ± 0.02) eV measured for 60 eV and 35 eV electrons. The existence of this vertical tail seems to be supported by the results published earlier by Ehrhardt [7]. In the same energy range, the appearance potential measurements show a larger scattering (see Fig. 3 of ref. 7).
The peak at 0.79 eV kinetic energy has been analysed under higher resolution and fine structure was observed [24]. This peak which slightly shifts to lower energy when the electron energy decreases, (i.e. to 0.62 eV kinetic energy for 25 eV electrons), has commonly been ascribed to the predissociation of the B2Σg-state of
O2 +
only. We have shown that in this kinetic energy range at least two predissociations occur to the 18.69 eV dissociation limit by process (4), i.e. by predissociation of the 2∆g state and the B
2 Σg state of O2 + . This interpretation is supported by two facts: (i) the agreement between the vibrational spacings observed in this electron impact experiment [24] and by photoelectron spectroscopy [25] and (ii) the observation of the particular feature at (19.8+0.2) eV, which is in good agreement with the adiabatic ionization potential of 19.79 eV obtained for the 2∆g state of O2
+
by photoelectron spectroscopy [25]. It has to be concluded that the O2 +
(2∆g) state is
predissociated from its v' = 0 level [24]. In the same way, and in agreement with the results obtained by Eland [13] through photoelectron-photoion coincidence, the predissociation of the B2Σg
from v' = 0 to v' = 6 is observed. It has been proposed [24] that both the 2∆g state and the B2Σg- state of O2+ are predissociated by the
Furthermore, on the low energy side of the same peak at (0.79 ± 0.02) eV, the observed structure agrees satisfactorily with the vibrational spacing in the 2Φu state [25] measured by photoelectron spectroscopy. If this
interpretation is correct, it implies the predissociation of the O2 +
(2Φu) state from its v'= 1 level in spite of the
simultaneous violation of the ∆Λ = 0, ±1, the parity and/or spin conservation rules. The repulsive or quasi-repulsive states 2Σg+, 4Σg+, 2Σu+ and 4Σg+ could be considered for this predissociation [24]. From Gilmore's
potential energy curves [26], the 2Σg +
or 4Σg +
could be considered with a slightly modified shape. Autoionizing predissociation of a Rydberg state of O2, i.e. the predissociation of a superexcited state of O2 through an unstable
molecular ion state of O2 +
, cannot be ruled out. A Rydberg state of O2 characterized by a Σ or П symmetry and
converging to the 2Φu state of O2+ could be predissociated by a 2Σ or 4Σ state of O2+.
Fig. 7. Drawing of potential energy curves of O2 +
. The data (———) used for the 2∆g state and 2
Φu state are
from ref. 26 and c4Σu
state, the B2Σg
state and the b4Σg
state are from ref. 27; (---): present work.
The threshold energies observed for higher kinetic energies, up to 3.5 eV, are probably due to direct transitions to one or more molecular ion states of O2
+
and converging to the limit at 18.69 eV, giving rise to process (4). A transition from the X3Σg
of O2 to the 2 Σu + state or the 4Σu + state of O2 +
[26] could be considered. As a result of this discussion, tentative potential energy curves can be drawn, as shown in Fig. 7.
Dissociation processes to (20.52 ± 0.05) eV
This appearance potential is in good agreement with the calculated value of 20.697 eV for process (6). The straight line converging to this limit extends to 5.5 eV kinetic energy with a slope of 0.5.
A continuous straight line portion is observed from 0.0 eV to 0.5 eV kinetic energy which could be interpreted by a direct vibronic transition to the dissociation limit of a stable state of O2+ converging to the limit
at 20.52 eV where the ion dissociates by process (6). Combining a 1D and a 4S° term, only 4Σ-, 4П and 4∆ even and odd states are obtained [16]. The molecular ion state concerned in this kinetic energy range could be a 4Пg
state or a 4Пu state. The ion-energy distribution corresponding to this process contributes to the underlying
At higher kinetic energies, process (6) presumably arises by means of transitions to the repulsive wall of stable molecular ion states or to repulsive potential energy curves of O2
+
converging to the dissociation limit at 20.52 eV.
Dissociation processes to (22.09 ± 0.1) eV
This threshold energy is in fairly good agreement with the calculated value of 22.054 eV for the dissociative ionization process (7). The straight line converging to this limit is observed up to 6.0 eV kinetic energy of the O+ fragment. As Fig. 6 shows, different phenomena are observed in the electron energy range, starting at 22.09 eV and related with the dissociation limit at 22.09 eV. From the 0 eV to 0.5 eV kinetic energy range, the measured threshold energies fit fairly well the straight line passing through 22.09 eV. This dissociative ionization process contributes to the continuum observed in the 0.79 eV peak measured in the O+ ion-energy distribution.
Two particular features are observed at about 23.4 eV and at (24.36 ± 0.14) eV. In the 0.79 eV peak of the O+ ion-energy distribution, two submaxima were observed and ascribed to the predissociation of the v' = 0 and v' = 1 levels of the c4Σu- state of O2+ [24]. Two arguments favour this interpretation: (i) the good agreement
between the position of the submaxima found in the peak at 0.79 eV [24] and the vibrational spacing observed in the photoelectron spectrum [22] and (ii) the existence of a vertical line in the plot of the ion-energy as a function of the threshold energy at (24.36 ± 0.14) eV which is in good agreement with the adiabatic ionization potential of O2+ measured at 24.577 eV by photoelectron spectroscopy [22].
A second, but more uncertain vertical line is observed around 23.4 eV. It has been tried to fit a straight line through the experimental threshold energies with the proper slope and extrapolated to the calculated dissociation limit at 22.92 eV. Only two points fitted this line. Furthermore, no experimental threshold energies are found lying on a straight line which extrapolates to the 23.748 eV dissociation limit. The three points fit fairly well a vertical line reaching the straight line extrapolated to (22.09 ± 0.1) eV. On the other hand the energy of 23.4 eV lies between the minimum ionization potential of (22.8 ± 0.1) eV measured by photoelectron spectroscopy [27] and the vertical ionization energy at 24.0 eV measured by Edqvist [22] for the 2Пu state of O2
+
. The photoelectron spectrum of this state gives a diffuse and structureless band which may indicate the excistence of a predissociation. This interpretation could find a confirmation in the present electron impact experiment.
Freund [11] correlated his A2, R2, A3 and R3 peaks, characterized by a threshold energy in the range 22-26 eV, to the predissociation of the c4Σu
and the 2Пu states. However, these peaks have their maxima at 2.9
eV, 4.1 eV, around 4.0 eV and at 6.6 eV respectively. The predissociation should take place through a repulsive curve converging to O(1D) + O+(4S°) at 20.697 eV. From our data it is unambiguously shown that the predissociation of both the 2Пu and the c
4
Σu
take place to the dissociation limit at 22.09 eV where O2 +
→ O+ (2D°) + O(3P). Furthermore, the kinetic energy carried away by 0+ through the predissociation of both the c4Σu
-state and the 2Пu state is at least 1.3 eV and 0.7 eV respectively.
The low energy portion of the straight line extrapolated to 22.09 eV presumably reflects the dissociation of an unknown stable state of O2
+
.
Dissociation processes to 24.05 eV and 25.70 eV
For these processes, threshold energies have been measured up to 6 eV kinetic energy. No signal corresponding to fragments formed without kinetic energy is detected in the 24-26 eV energy range. From Fig. 5, it can be seen that all the dissociative ionization processes observed in this electron impact experiment have to take place at or below 35 eV electron energy. Clearly, a contribution of O+ ions formed by process (16) from dissociative ionization of O2
+
can even be excluded (see Fig. 6).
Because of the scarcity of the literature data available, it is impossible to correlate our observations in this energy range with O2
+
electronic states observed by optical spectroscopy. However it is possible to conclude unambiguously that all the ions observed, carrying up to 6 eV kinetic energy have to be correlated with highly excited vibronic states of O2
+
or high Rydberg states of O2. The mechanism invoked by Freund [11] for his A4
and R4 peaks at 11.1 eV is also excluded in the present experiment.
CONCLUSIONS
impact of electrons with variable energy, a detailed analysis of the ion-energy distribution has been possible. The fine structure observed in this distribution combined with the measurements of the threshold energy of O+ ions with known kinetic energy makes possible the interpretation of the energy spectrum by the existence of both electronic predissociation of O2+ states and direct dissociative ionization.
Acknowledgements
The authors are grateful to Professor H. Boerboom for helpful discussions concerning the ion optics and particularly the retarding lens. Professor J. Momigny and Dr. P. Natalis are thanked for useful suggestions. We thank Mr. J. Heinesch and Mr. A. Dumont for setting up the electronic part of the instrument described in this paper. We are indebted to the Belgian Fonds de la Recherche Fondamentale Collective for financial support and one of us (J.S.) acknowledges the Patrimoine de l'Université de Liège for a grant.
References
1 W. W. Lozier, Phys. Rev., 36 (1930) 1285. 2 H. D. Hagstrum, Rev. Mod. Phys., 23 (1951) 185.
3 P. H. Doolittle, R. I. Schoen and K. E. Schubert, J. Chem. Phys., 49 (1968) 5108. 4 R. Taubert, Z. Naturforsch. A, 19 (1964) 484.
5 J. Appell, J. Durup and F. Heitz, Advan. Mass Spectrom., 3 (1964) 547. 6 H. E. Monahan and J. E. Stanton,J. Chem. Phys., 41 (1964) 3694. 7 H. Ehrhardt and A. Kresling, Z. Naturforsch. A, 22 (1967) 2036. 8 P. J. Chantry, Phys. Rev., 172 (1968) 125.
9 K. Köllmann, Doctoral Thesis, Hamburg University, 1974. 10 A. Crowe and J. W. McConkey, J. Phys. B, 6 (1973) 2088 . 11 R. S. Freund, J. Chem. Phys., 54 (1971) 3125.
12 J. A. D. Stockdale and L. Deleanu, Chem. Phys. Lett., 22 (1973) 204. 13 C. J. Danby and J. H. D. Eland, Int. J. Mass Spectrom. Ion Phys., 8 (1972) 153. 14 R. Locht and J. Momigny, Int. J. Mass Spectrom. Ion Phys., 2 (1969) 425; 4 (1970) 379. 15 R. Locht and J. Momigny, Int. J. Mass Spectrom. Ion Phys., 7 (1971) 121.
16 G. Herzberg, Spectra of Diatomic Molecules, Van Nostrand, Princeton, 1950, p. 387. 17 R. S. Mulliken, J. Chem. Phys., 33 (1960) 247.
18 V. Čermák and J. Šrámek, J. Electr. Spectrosc, 2 (1973) 97.
19 H. Wankenne and J. Momigny, Int. J. Mass Spectrom. Ion Phys., 7 (1971) 227.
20 G. Mathieu, H. Wankenne and J. Momigny, Chem. Phys. Lett., 17 (1972) 260; 21 (1973) 606. 21 A. J. Lorquet, J. C. Lorquet, H. Wankenne and J. Momigny, J. Chem. Phys., 55 (1971) 4053. 22 Ö. Edqvist, E. Lindholm, L. E. Selin and L. Åsbrink, Physica Scripta, 1 (1970) 25.
23 L. J. Kieffer, G. M. Lawrence and J. M. Slater, VIIICPEAC, North Holland Publ. Co., Amsterdam, 1971. 24 J. Schopman and R. Locht, Chem. Phys. Lett., 26 (1974) 596.
25 N. Jonathan, A. Morris, M. Okuda, K. J. Ross and D. J. Smith, XI Intern. Symp. on Free Radicals, Berchtesgaden, Königssee, Sept. 1973. 26 F. R. Gilmore, J. Quant. Spectrosc. Radiat. Transfer, 5 (1965) 369.