A photoelectron spectroscopic investigation of vinyl fluoride (C
2H
3F): the
HeI, threshold and CIS photoelectron spectroscopy
R Locht1, B Leyh1, D Dehareng2, K Hottmann3 and H Baumgartel3
1
Laboratoire de Dynamique Moléculaire, Département de Chimie, Institut de Chimie, Bât.B6c, Université de Liège, Sart-Tilman par B-4000 Liège 1, Belgium
2
Centre d'Ingéniérie des Protéines, Institut de Chimie, Bât.B6a, Université de Liège, Sart-Tilman par B-4000 Liège 1, Belgium
3
Institut für Physikalische und Theoretische Chemie, Freie Universität Berlin, Takustraβe 3, D-14195 Berlin, Germany
Abstract
The threshold photoelectron spectrum (TPES) and the constant ion state (CIS) spectra of the individual ionic states of C2H3F have been recorded using synchrotron radiation. For comparison a well-resolved HeI photoelectron spectrum (HeI-PES) has also been measured and analysed in detail. The TPES has been measured between 9.5 eV and 35 eV photon energy. Numerous vibrational structures, reported for the first time, observed in the ground state and the six excited states of the cation are analysed. Quantum chemical calculations have been performed and provide strong support to the assignments. State-selected CIS spectra highlighted the major importance of autoionization for the production of almost all ionized states of C2H3F observed in this work. (Some figures in this article are in colour only in the electronic version)
1. INTRODUCTION
The only photoelectron spectroscopic (PES) technique that has been applied to vinyl fluoride (C2H3F) is the fixed wavelength Hel-PES at 54.8 nm. The earliest well-resolved Hel-PES of this molecular system has been reported by Lake and Thompson [1]. The vibrational structure observed in the first band has been analysed and assignments have been proposed. The structureless photoelectron bands observed at higher binding energies have been neither analysed nor assigned.
Reinke et al [2] shortly presented a well-resolved Hel-PES for comparison purposes with their
photoionization mass spectrometric work on C2H3F [3]. These authors performed a vibrational analysis of the first photoelectron band and proposed an interpretation of the higher energy bands observed in the spectrum.
The photoelectron spectroscopic work has been considerably extended in energy by the use of the HeII resonance line at 30.4 nm. This provided information on the binding energy of the inner-valence shell orbitals of the molecules. This technique was extensively applied by Bieri et al [4, 5], e.g. to fluoro-compounds. These authors presented the first HeII-PES of C2H3F and analysed their experimental results based on quantum mechanical calculations.
Sze et al [6] reported the investigation of the monohaloethylenes (C2H3X, X = F, Cl, Br, I) by using Hel-and Hell-PES and electron energy loss spectroscopy. These authors measured the ionization energies corresponding to the different photoelectron bands and analysed the observed vibrational fine structure. The electron energy loss spectra were related to the vacuum UV photoabsorption spectra of the same molecular systems. The photoabsorption spectroscopic data related to C2H3Cl [7], C2H3Br [8] and C2H3F [9] have been analysed in great detail and reported in earlier publications.
Several theoretical studies were devoted to the description of ethylene and its halogenated derivatives.
Ab initio SCF calculations have first been reported by Meza and Wahlgren [10] describing C2H4 and C2H3F. Ionization energies of the corresponding molecules were calculated.
Heaton and El-Talbi [11] reported ab initio molecular orbital calculations at the SCF level for the complete series of fluorinated ethylenes. Vertical ionization energies have been calculated and assignments of the experimental observations have been proposed.
Bieri et al [4, 5] and Potts et al [12] extended their calculations to interpret the HeII-PES which also
involves ionization from the inner-valence shell orbitals. Semi-empirical, HAM/3 and many-body Green's function calculations were used. Recently, Pradie and Linnert [13] performed new calculations of the first ionization energies (adiabatic and vertical values) for fluorinated, chlorinated and chlorofluorinated ethylenes at the Hartree-Fock (HF) level using GTlarge and 6-311+G(3df,2p) basis sets. A critical review of the results was presented.
Takeshita [14] also proposed ab initio calculations on halogenated ethylenes. To the best of our
knowledge, it is the only theoretical study investigating the molecular structures and the vibrational levels of the ground electronic state of the cation. This author compared the calculated results with the experimental intensities and wavenumbers.
We recently published a detailed investigation of the photoabsorption spectrum of C2H3F between 6 eV and 25 eV photon energy using synchrotron radiation [9]. To extend the study of this molecular system to its cationic states, their photoelectron spectra have been investigated and are described in the present paper. The fixed wavelength HeI-PES has been remeasured and has been completed by variable wavelength TPES (threshold photoelectron) and vibrationally resolved CIS (constant ion state) spectroscopy. These techniques are expected to highlight autoionizing contributions as well as dissociative ionization pathways of C2H3F
2. EXPERIMENTAL DETAILS 2.1. Experimental setup
The experimental setup used in this work has already been described in detail elsewhere [15]. Only the most important features of the three experimental techniques used in the present experiments will be reminded in this section.
Except for the HeI-PES measurements, in all experiments reported here we used the vacuum UV light from the synchrotron radiation provided by the electron storage ring BESSY (Berlin, Germany). This light is dispersed by a vacuum UV 3 m normal incidence (3 m NIM beam line) monochromator [16] equipped with a 2400 line mm-1 Pt-grating. The entrance and exit slit widths were set at 50-200 µm depending on the signal intensity.
The light beam is focussed into an ion chamber, in the focussing plane of a tandem electron spectrometer consisting of two 180° electrostatic deflectors. This electron energy analyser works at constant pass energy E0, leading to a constant energy resolution. The resolution defined as the full width at half-maximum (FWHM) is given by ∆E/E0 = ω/104 where ω is the slit width expressed in millimetres. In the present experiments ω = 0.5 mm or 1.0 mm and E0 is set at values between 0.4 V and 10.0 V depending on the type of experiment and on the signal intensity.
In addition to the synchrotron storage ring beamcurrent, the photoelectron signal of a gold diode, inserted in the ion chamber at the opposite of the 3 m NIM monochromator exit slit, is measured in order to normalize the photoelectron signals in the TPES and CIS spectra.
The first and most obvious operating mode of this experimental setup is the measurement of 'fixed-wavelength' photoelectron spectra. The HeI resonance line at 58.4 nm is produced in a microwave discharge and guided into the ionization region through a quartz capillary. Optimal conditions for resolution and intensity are obtained for a pass energy E0 = 0.4 V providing a nominal resolution of 16 meV as measured on the Xe+ (2P3/2) peak.
The second operating mode is the measurement of 'constant photoelectron energy' spectra. These are recorded by tuning the photon energy hv and keeping constant the energy Eekin of the electrons transmitted through the tandem electron energy analyser system. To transmit only 'zero kinetic energy' or 'threshold' (TPE) photoelectrons, the electron accelerating voltage Vacc is kept equal to E0 as close as possible. This equality is optimized to obtain the highest TPE signal intensity. The TPE of the sample gas has been normalized to the photon transmission function of the monochromator by measuring simultaneously the photoelectron current intensity of the gold diode.
The third kind of experiment performed with this instrument is the 'constant ion state' (CIS) spectroscopy of vibrational and/or electronic states of molecular ions. The aim of this experiment is to measure
the relative partial ionization cross-sections as a function of the photon energy for well-defined vibronic states of the molecular ion. Autoionization is well known to strongly perturb photoionization and dissociative photoionization cross-sections by inducing dramatic variations in the distributions of the final ionic states. Recording a CIS spectrum requires to keep IE = hv -Ee
kin constant, i.e. the ionization energy corresponding to the considered ionic state. The photon energy hv and the photoelectron kinetic energy Eekin must therefore be scanned in parallel. The details about the experimental procedure have been described earlier [15].
The commercially available C2H3F, purchased from Fluochem Ltd and of 99.5% purity, was used without further purification.
2.2. Data handling and error estimation
To improve the experimental resolution of the Hel-PES, the original spectrum has been deconvoluted. A repeated iterative procedure [17] has been used, improving the effective resolution down to about 8 meV, as measured on the PES of C2H3F.
As will be discussed in the next sections, weak structures and diffuse peaks are often superimposed on a strong continuum. To make the characterization of these features easier a 'continuum subtraction' procedure has been applied. This method has already been used successfully in previous spectral analyses [18]. For this purpose, the experimental curve is severely smoothed to simulate the underlying continuum which is then subtracted from the original photoabsorption spectrum. The smoothing procedure consists in filtering the experimental curve by fast Fourier transform (FFT). The weak features emerge from a strongly attenuated remaining background. The resulting diagram will be called ∆-plot in the forthcoming sections.
In the HeI-PES, the photoelectron energy scale has been calibrated by recording the PES of a rare gases X-C2H3F mixture (X = Ar, Kr and Xe). The rare gas ionization energies corresponding to the 2P3/2 and 2P1/2 ionic states are used to carry out a linear regression giving ±2 meV precision of the energy scale. Under high-resolution conditions, the spectrum has been scanned with 1 meV increments.
The photon energy scale of the 3 m NIM monochromator has been calibrated with rare gas photoabsorption and/or threshold photoelectron spectra. An accuracy of better than 2-3 meV is achieved. For this purpose Ar and/or Xe were used. To obtain the relative partial photoionization cross-sections, the CIS spectra have to be normalized to the transmission functions of the monochromator and of the electron energy analyser. The former is recorded simultaneously with the CIS spectrum. The latter is obtained by recording the CIS curve of a rare gas, e.g. Xe+ (2P3/2) exhibiting no structure over the same photon energy range as for the investigated molecular ion.
The error on the energy position of a feature is estimated to be 6 meV when the spectrum is recorded with energy increments of 4 meV, i.e. in the TPES and Hel-PES over large energy ranges. For the broad bands observed in these spectra, the positions of the maxima (vertical ionization energies) are estimated with an accuracy of 10 meV. In the photoelectron spectra recorded with 1 meV increments over narrow energy ranges, the accuracy is estimated to be of about 4 meV including the energy scale precision. For the CIS spectra recorded with 10 meV increments, the positions of the features are measured with an error estimated to be 15 meV.
3. EXPERIMENTAL RESULTS
For the easiness of the discussion the HeI, TPES and CIS spectra will be discussed separately.
3.1. The HeI and threshold photoelectron spectra
The TPE spectrum of C2H3F has been recorded over a wide photon energy range, i.e. 8-35 eV. The upper limit was defined by the grating transmission function.
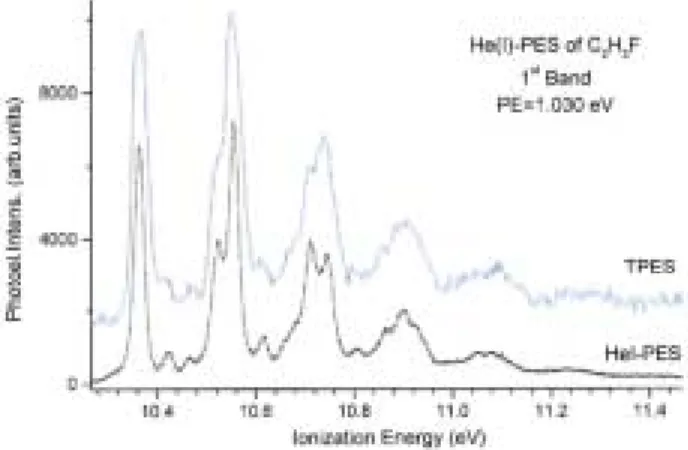
The photon monochromator and the electron spectrometer have been tuned for medium resolution conditions, i.e. 200-200 µm slit widths and 5 eV pass energy respectively leading to an overall resolution of about 25 meV. The restricting effect on the overall resolution of the present photon monochromator settings is clearly illustrated in figure 1: the first PE band is recorded using the same electron spectrometer conditions for both the PES and the TPES spectra. Figure 2(a) shows the TPE spectrum extending up to 30 eV photon energy and recorded with 4 meV energy increments.
Figure 1. Comparison of the Hel-PES and the TPES recorded with the same electron energy analyzer, under the
same conditions showing the resolution reducing effect of the photon monochromator settings used in the present experiments.
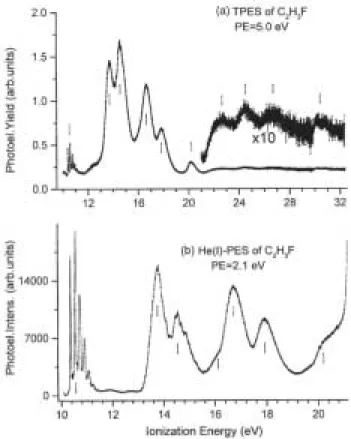
Nine well-defined bands are observed at vertical ionization energies of 10.570 ± 0.006 eV, 13.76 ± 0.01 eV, 14.56 ± 0.01 eV, 16.64 ± 0.01 eV, 17.84 ± 0.01 eV, 20.18 ± 0.01 eV and at about 22.7 eV, 24.5 eV and 26.7 eV. Emerging slightly from the noise level, a very weak band could be observed near 30.1 eV. A fairly strong feature is noteworthy to mention at about 12.6 eV as a shoulder of the very strong band at 13.76 eV.
For comparison the HeI-PES of C2H3F has been recorded over the whole ionization energy region available with the HeI resonance line and at medium resolution, i.e. with a pass energy E0 = 2.1 eV. The typical result is shown in figure 2(b) where the energy increment is 7 meV. In this spectrum the vertical ionization energies are measured at 10.554 ± 0.006 eV, 13.79 ± 0.01 eV, 14.53 ± 0.01 eV, 16.71 ± 0.01 eV, 17.91 ± 0.01 eV and 20.20 ± 0.01 eV. Shoulders are observed at about 16.16 eV and 19.67 eV.
In table 1, the HeI- and HeII-PES results reported in earlier papers [1,2,4-6] are compared with the HeI and with the TPES results of the present work.
Two remarkable differences have to be noted between the Hel-PES and the TPES. Several features, such as the shoulders at about 16.16 eV and less clearly at about 19.67 eV, are present in the Hel-PES but neither is observed in the TPES spectrum. A relatively strong shoulder at 12.6 eV is clearly observed in the TPES and not observed in the Hel-PES. The second important difference between the two spectra is the dramatic differences of ionization cross-sections of the different ionic states. The Hel-PES is dominated by the ground state whereas in the TPES the first four excited states dominate the spectrum.
3.2. The CIS photoelectron spectra
The CIS spectra were recorded over an energy range of 10 eV, i.e. from the threshold up to 24 eV photon energy.
Owing to the weakness of the signal, these time-consuming measurements were restricted to the strongest features in the TPES. For the ionic ground state the CIS spectra were measured for the first four v4 vibrational levels. No noteworthy differences between these curves have been observed and figure 3(a) shows a typical CIS spectrum for the υ = 1 level of v4 in the C2H3F+ ground ionic state.
The same figure shows the CIS measurements for the successive electronic ionic states observed in the TPES up to 20 eV. Remarkably, the shapes of the spectra corresponding to the 13.76-14.56 eV and to the 16.6-17.84 eV pairs of states are very similar. In all these curves only broad structures are observed. For the easiness in the interpretation and discussion, the photoabsorption spectrum of C2H3F measured in the same energy range [9] has been added to figure (figure 3(b)).
3.2. The CIS photoelectron spectra
energy.
Figure 2. (a) Threshold photoelectron spectrum (TPES) of C2H3F between 10 eV and 32 eV photon energy, (b)
HeI photoelectron spectrum (PES) of C2H3F at medium resolution. Vertical bars locate the vertical ionization
energies.
Owing to the weakness of the signal, these time-consuming measurements were restricted to the strongest features in the TPES. For the ionic ground state the CIS spectra were measured for the first four
v4 vibrational levels. No noteworthy differences between these curves have been observed and figure 3(a) shows a typical CIS spectrum for the υ = 1 level of v4 in the C2H3F
+
ground ionic state.
The same figure shows the CIS measurements for the successive electronic ionic states observed in the TPES up to 20 eV. Remarkably, the shapes of the spectra corresponding to the 13.76-14.56 eV and to the 16.6-17.84 eV pairs of states are very similar. In all these curves only broad structures are observed. For the easiness in the interpretation and discussion, the photoabsorption spectrum of C2H3F measured in the same energy range [9] has been added to figure (figure 3(b)).
4. AB INITIO CALCULATIONS: METHODS AND RESUTS 4.1. Computational tools
The basis set used is cc-pVTZ [19, 20], i.e. a valence triple ζ-basis set with polarization functions. The geometry optimizations of the neutral and the two lowest electronic states of the cation as well as the wavenumber calculations of their corresponding vibrational normal modes were performed at the B3LYP level [21, 22]. Some excited state geometries were optimized at the CIS (configuration interaction with single excitation) level [23] and at the CASSCF (complete active space self consistent field) level [24-26]. Most of the CASSCF calculations involve 8 active orbitals and 11 electrons [CAS(11,8)]. Some calculations were also performed in CASSCF with seven active orbitals and seven electrons [CASSCF(7,7)].
For the CASSCF calculations, the geometry optimizations were performed with or without state average option which means that the molecular orbitals were optimized by taking into account (or not) all the states involved in the calculation. The wavenumber calculations were performed without this option. An avoided
crossing between the Ã2A' and the 2A' states and a conical intersection between the 2A' and the 2A" states were searched out.
Figure 3. (a) Threshold photoelectron spectrum (TPES) of C2H3F and constant ion state (CIS) spectra at 10.55
eV, 13.79 eV, 14.54 eV, 16.71 eV, 17.91 eV and 20.21 eV successively. (b) The photoabsorption spectrum (PAS) of C2H3F as measured in the same photon energy range [9]. Shaded areas indicate energy ranges of excited
valence and Rydberg states.
Table 1. Comparison between the vertical ionization energies (eV) of C2H3F as obtained by HeI (54.8 nm or
21.22 eV), HeII (30.4 nm or 40.8 eV) and threshold photoelectron spectroscopy. For the assignments to molecular orbitals, see [4, 5]. MET = multiple electron transition.
HeI/HeII Ionization Orbital [4,5] [1] [2] [4, 5] [6] This work TPES This work 10.58 10.57 10.63 10.57 10.55 10.57 13.79 13.80 13.8 13.80 13.79 13.76 14.51 14.56 14.5 14.60 14.53 14.56 - - - 16.00 16.16 5a'-1 - 16.76 16.7 16.70 16.71 16.64 17.97 17.97 17.9 17.90 17.91 17.84 - - - - 19.67 - - 20.27 20.2 20.10 20.20 20.18 - 21.94 - - - 22.7 - - 24.5 - - 24.5 - - - - - 26.7 30.1 1a'/MET
All calculations were carried out with the GAUSSIAN 03 programme [27].
Table 2. Optimized geometries of the neutral ground state of C2H3F and the first two ionic states of C2H3F+
calculated at the B3LYP//cc-pVTZ level. Optimized geometries of the first two excited states à 2A' and 2A' of C2H3F
+
at the CIS//cc-pVTZ level are also included. The internuclear distances R in Å and angles ∠in degrees. For the atomic numbering refer to the figure below. Comparison is made with the results reported in ref. [14] for the neutral and ionic ground states.
State R(C1-C2) R(C1-F3) R(C1-H4) R(C2-H5) R(C2-H6) 1 A' 1.3168 1.3469 1.0809 1.0796 1.0785 Ref. [14] 1.312 1.325 1.081 1.082 1.081 2 A'' 1.4058 1.2699 1.0875 1.0845 1.0829 Ref. [14] 1.402 1.249 1.087 1.085 1.083 Ã 2A'-B3LYP 1.3007 1.2644 1.1900 1.1319 1.0828 Ã 2A'-CIS 1.3141 1.2384 1.1471 1.1317 1.0690 2 A'-CIS 1.3074 1.2671 1.0827 1.1522 1.1340 State
∠
(F3-C1-C2)∠
(H4-C1-C2)∠
(H5-C2-C1)∠
(H6-C2-C1) 1 A' 122.21 126.02 121.72 119.29 Ref. [14] 122.51 125.29 121.31 119.51 2A" 119.11 125.43 120.14 119.40 Ref. [14] 119.65 124.53 119.77 119.43 Ã 2A'-B3LYP 143.18 104.39 111.08 131.04 Ã 2A'-CIS 139.42 99.67 101.07 135.32 2 A'-CIS 124.37 118.92 141.01 143.764.2. Results of the calculations
The parameters of the optimized geometry as calculated for the ground state and the first two ionic states at the B3LYP//cc-pVTZ level are listed in table 2.
The calculated vertical (adiabatic) ionization energies obtained for the ground ionic state 2A" and the first excited ionic state à 2A' are equal to 10.49 (10.17) eV and 13.51 (12.91) eV respectively.
The optimized geometries at the CAS(12,8) or CAS(11,8) level for the neutral molecule and the molecular ion respectively, with or without the state average option, are summarized in table 3.
The results of the B3LYP calculations of the wavenumbers characterizing the 12 vibrational normal modes represented in figure 4 are listed in table 4 for the 1A' neutral ground state and the 2A" ionic ground state. For the ionic excited states of C2H3F, the wavenumbers were calculated at the CAS(11,8) level and the results are listed in table 5. A comparison between the results obtained at both the B3LYP and CAS(11,8) levels for the 2A' ionic state is shown in the same table.
encountered on the way to its optimal configuration. This state is a dissociative state leading to C2H3+ (1A') and F (2P) and is degenerate with the à 2A' state at the dissociation asymptote. During the CIS optimization of the 2A' state, a crossing with the à 2A' state occurred and this second excited state becomes therefore the first excited state. Therefore, the geometry of the lowest energy point for the avoided crossing between the two states has been searched out. Similarly, the optimization of the 2A" pointed out to the existence of a conical intersection between the 2A' and the 2A" states: the geometry at this intersection has also been optimized. The optimization of the state also revealed several intersections but it was not possible to obtain a converged geometry, i.e. a geometry for which the energy gradient was numerically equal to zero. However, on the optimization pathway, some geometries corresponding to very small energy differences (0.0001 au) were found though they were characterized by a large gradient and thus did not correspond to the lowest energy points. The calculated parameters are listed in table 6.
Table 3. Optimized geometries at the CAS(12,8) (neutral) or CAS(11,8) (cation) level with (stav) or without
(nostav) the state average option for the neutral ground state and the first four ionic states of C2H3F +
: internuclear distances R in Å and angles ∠in degrees. For the atomic numbering refer to the figure inserted in table 2. State R(C1-C2) R(C1-F3) R(C1-H4) R(C2-H5) R(C2-H6) 1 A' 1.3401 1.3245 1.0705 1.0719 1.0709 2 A" 1.3992 1.2658 1.0764 1.0742 1.0727 Ã 2A'-stav 1.3292 1.2417 1.1698 1.1394 1.0678 -nostav 1.3229 1.2363 1.2368 1.1090 1.0718 2 A'-stav 1.3198 1.2747 1.0758 1.1673 1.1542 -nostav 1.3301 1.2756 1.0804 1.1678 1.1437 2 A"-stav 1.3343 1.8028 1.0711 1.0744 1.0804 -nostav 1.3308 1.8318 1.0707 1.0745 1.0813 State
∠
(F3-C1-C2)∠
(H4-C1-C2)∠
(H5-C2-C1)∠
(H6-C2-C1) 1 A' 121.73 125.68 121.41 119.25 2 A" 119.73 125.04 120.08 119.16 Ã 2A'-stav 139.05 100.49 104.38 133.63 -nostav 144.83 100.95 109.62 129.67 2 A'-stav 122.53 120.36 143.87 142.17 -nostav 123.26 119.21 142.05 141.96 2 A"-stav 113.83 145.64 123.61 116.17 -nostav 113.70 146.19 123.90 116.025. DISCUSSION OF THE EXPERIMENTAL DATA 5.1. The HeI photoelectron spectrum
In terms of molecular orbitals, restricted to the outer-valence and inner-valence shell orbitals, the electronic structure of C2H3F in its ground electronic state 1A' in the Cs symmetry group is represented by [9]
(1a' )2 (2a')2 (3a' )2 (4a' )2 (5a' )2 (1a" )2 × (6a' )2 (7a' )2 (2a" )2: A'. The inner-shell atomic-like orbitals are F(1s)2, C
1(1s)2 and C2(1s)2. The occupied a" orbitals have a π character: the 2a" is a C=C bonding orbital whereas the 1a" is a C-F bonding orbital. All the na' orbitals have a σ character.
The medium resolution HeI-PES shown in figure 2(b) is in good agreement with previous observations [1, 2, 6]. As already mentioned, this spectrum is dominated by the first band observed at 10.56 eV and made of sharp and strong structures. At medium resolution the second, and the fourth to sixth bands look structureless. Presumably, in the last band at about 20.2 eV, a weak structure is visible. All these features are characterized by their vertical ionization energy listed in table 1. Fairly good agreement is found with previously reported data [1,2, 4-6]. However, two additional structures or unresolved bands are clearly observed as shoulders at about 16.2 eV and 19.7 eV successively. These structures have never been mentioned in earlier publications.
Figure 4. Graphical representation and description of the 12 vibrational normal modes of C2H3F+ in the Cs
symmetry for which the associated wavenumbers have been calculated.
The Hel-PES has also been measured under higher resolution conditions by reducing the pass energy E0 of the electron energy analyser to E0 = 0.39 eV. The result on the first PES band is shown in figure 5 which can be directly compared with the result shown in figure 1: the resolution increase is obvious. To improve the experimental resolution the deconvolution method has been applied (see section 2.2). The result is also shown in figure 5 and an effective resolution of 8 meV is obtained. The energy positions of the structures observed in the first band have been listed in table 7.
This band is assigned to the ionization of the highest occupied 2a" orbital with a predominant C=C π orbital character giving rise to the ground state of the C2H3F+ cation. The experimental adiabatic and
vertical ionization energies (IE) are = (10.363 ± 0.004) eV and =
(10.558 ± 0.004) eV respectively.
The literature data on the adiabatic IE as measured directly by photoelectron spectroscopy are very scarce. The value of 10.37 eV is reported by Lake and Thompson [1] and Reinke et al [2] without any uncertainty indication. Theoretical calculations predicted this quantity to be at 10.27 eV [10], 10.37 eV [13] and 8.83-9.60 eV [14] depending upon the calculation level. The experimental vertical ionization energy values are in good agreement, except for the values determined by HeII-PES [4, 5] showing a systematic higher value compared to that obtained by HeI-PES.
The vibrational structure observed in the -band of C2H3F+ has been assigned to progressions essentially involving four vibrational normal modes: ω4 = 1565 ± 16 cm-1 (194 ± 2 meV), ω7 = 1274 ± 12 cm-1 (158 ± 1.5 meV), ω9 = 500 ± 32 cm
-1
(62 ± 4 meV) and two alternatives for the value of ω8, i.e. 839 ±40 cm -1 (104 ± 5 meV) or 968 ± 30 cm-1 (120 ± 4 meV). In this band overtones and combinations are observed. Table 7
Table 4. Ab initio (B3LYP) calculated wavenumbers (cm-1) associated with the 12 vibrational normal modes (VibrNM) (represented in figure 4 for the C2H3F+ state) related to the neutral ground state of C2H3F and
the ionic ground state of C2H3F+ respectively. For the atomic numbering in C2H3F refer to the figure in table 2.
Comparison is made with previous calculations [14].
This work Ref. [14]
VibrNM a' symmetry
Wavenumber (cm-1) Wavenumber (cm-1) Vibrational normal mode description
v1 3256 3434 CH stretch v2 3197 3395 CH stretch v3 3163 3333 CH stretch v4 1708 1879 C=C stretch F-CC & H-CC bend v5 1417 1518 H-CC bend v6 1336 1428 H-CC bend
v7 1166 1273 C-F stretch CH2 in-plane rock
v8 938 1023 CH2 in-plane rock C-F stretch
v9 489 519 CH2 in-plane rock F-CC bend
a" symmetry v10 967 - H out-of-plane deformation v11 899 - H out-of-plane deformation v12 732 - H out-of-plane deformation v1 3252 3450 CH2 stretch v2 3166 3380 CH4 & CH5 stretch v3 3131 3314 CH2 & CH4 stretch v4 1567 1737 H-CC bend C=C & C-F stretch v5 1453 1554 H-CC's bend v6 1327 1413 H4-C-F bend C-F stretch v7 1246 1337 C=C stretch F-CC & H-CC bend
v8 984 1059 CH2 in-plane rock C-F stretch
v9 489 521 CH2 in-plane rock F-CC bend
a" symmetry
v10 1025 - H out-of-plane deformation
v11 873 - H out-of-plane deformation
v12 390 - H out-of-plane deformation
displays the assignments proposed for almost all structures observed in the first PES band. Several assignments are indicated in bold corresponding to (i) an alternative and very reproducible value of ω = 104 ± 5 meV (with overtones and combinations of it) and (ii) more complex combinations, i.e. of three normal modes. In both cases, the corresponding expected energy position is calculated by using the theoretical values of the wavenumbers obtained in this work and is indicated in brackets. These experimental results and the theoretical values of the wavenumbers are summarized in table 8 including the available literature data. For the wavenumber associated with v4 two distinct values are measured, i.e. 1530 cm-1 [1, 6] and 1570 cm-1 [2] or 1565 ± 16 cm-1 (present work). Considering the accuracy on the present value, good agreement is found with the experimental determination in [2] only and with our calculated theoretical value of 1567 cm-1. The same consideration is valid for the wavenumber characterizing v7 for which 1330 cm-1 [1, 2] and 1270 cm-1 [6] or 1274 ± 12 cm-1 (present
Table 5. Ab initio (B3LYP and/or CAS(11,8)) calculated wavenumbers (cm-1) associated with the 12 vibrational motions (VibrNM) (represented in figure 4 for the C2H3F+ state) related to the Ã2A', 2A' and 2A" states
successively. For the atomic numbering in C2H3F refer to the figure in table 2.
B3LYP CAS(11,8) VibrNM a' symmetry Wavenumber (cm-1) Wavenumber (cm-1)
Vibrational normal mode description
C2H3F+ - 2A'
v1 3177 3356 C2-H6 stretch
v2 2643 2909 C2-H5 stretch
v3 2125 1845 Cl-H4 stretch (& C=C & C-F stretch & H4-Cl-F bending)
v4 1745 1607 C=C & C-F stretch or H4-Cl stretch & H4-CC bending
v5 1176 1299 H-CC or CH2 bending
v6 1074 1156 CH2 bend & C-F stretch or stretch C=C, C-F & Cl-H4 & bend H5-C2-F
v7 873 920 H4-CC bend CH2 in-plane rock
v8 854 701 H4-CC bend CH2 in-plane rock
v9 428 286 CH2 in-plane rock F-CC bend
a" symmetry v10 1425 1817 H out-of-plane deformation v11 776 803 H out-of-plane deformation vl2 534 452 H out-of-plane deformation C2H3F+- 2A' v1 - 3258 Stretch C1-H4 v2 - 2842 Stretch C2-H symmetry v3 - 2148 Stretch C2-H antisymmetry
v4 - 1701 Stretch C=C & stretch C-F & stretch H5-C2 & bending H4-CC
v5 - 1359 Bendings H-CC
v6 - 1316 Bending H5, H6-CCH & stretch C-F
v7 - 1094 Bending H-CC
v8 - 529 CH2 rock in-plane & bendings
v9 - 326 CH2 rock in-plane A" symmetry v10 - 1680 H out-of-plane deformation v11 - 876 H out-of-plane deformation vl2 - 387 H out-of-plane deformation B3LYP CAS(11,8)TS in Cs symmetry group VibrNM a' symmetry Wavenumber (cm-1) Wavenumber (cm-1)
Vibrational normal mode description
C2H3F+ 2 A"
v1 - 3409 Stretch C1-H4
v2 - 3371 Stretch C2-H antisymmetry
v3 - 3241 Stretch C2-H symmetry
v4 - 1793 Stretch C=C & bendings H-CC
v5 - 1474 Bendings H-CC
v6 - 1276 Bending H-C-H
v7 - 892 Bending H4-CC & CH2 rock in-plane
v8 - 500 Stretch C-F & CH2 rock in-plane
v9 - 313 CH2 rock in-plane & bending F-CC
a" symmetry
v10 - 1003 H out-of-plane deformation
v11 - 566 H out-of-plane deformation
work) were determined. In this case, very good agreement is noted with the measurement of [6] only, and with the present theoretical prediction at 1246 cm-1. The discrepancy of about 50 cm-1 with the determinations of Lake and Thompson [1] and Reinke et al [2] is fairly large and outside the uncertainty limits. The different works agree for v9 for which ω9 = 500 cm-1 is measured.
Table 6. Optimized geometries of the Ã2A'/ 2A' states avoided crossing (AC) and of the 2A'/ 2A" and 2A"/ 2A' states conical intersections (CI). Internuclear distances R in Åand angles in degrees. For the atomic numbering refer to the figure in table 2.
Calculation State R(C1-C2) R(C1-F3) R(C1-H4) R(C2-H5) R(C2-H6) CIS Ã 2A' 1.3141 1.2384 1.1471 1.1317 1.0690 2 A' 1.3074 1.2671 1.0827 1.1522 1.1340 CAS(7,7) AC 1.3681 1.2499 1.1056 1.1131 1.1792 CAS(11,8) AC 1.3841 1.2531 1.1021 1.0921 1.1453 CI 1.3304 1.8474 1.0738 1.0774 1.0798 CI 1.2906 2.0373 1.0765 1.0772 1.0824 Calculation State
∠
(F3-C1-C2)∠
(H4-C1-C2)∠
(H5-C2-C1)∠
(H6-C2-C1) CIS Ã 2A' 139.42 99.67 101.07 135.32 2 A' 124.37 118.92 141.01 143.76 CAS(7,7) AC 119.52 119.59 127.22 110.51 CAS(11,8) AC 119.66 120.91 128.84 113.08 CI 111.39 149.00 122.54 117.35 CI 116.24 129.76 121.75 116.28Figure 5. First photoelectronic band of C2H3F as observed between 10.25 eV and 11.45 eV and recorded at E0 =
0.39 eV of the electron energy analyser (exp), the result of its deconvolution (dcv) and its vibrational analysis (vertical bars).
However, if the latter assignment, i.e. ω9 = 500 ± 32 cm -1
, is unambiguous, its second and higher overtones and combinations are not (see bold in table 7). The reason is that the predicted values (see table 4) for 2ω9 = 2 × 489 cm-1 and ω8 = 984 cm-1 are very close: these two values are indistinguishable in the present experiment.
The second questionable assignment is ω = 839 ± 40 cm-1 which is observed with overtones and combinations. This wavenumber has also been detected unambiguously in the Rydberg series converging to the C2H3F+ ( X
assigned it to CH2 deformation (see table 1 in [6]). The assignment to v8 would imply a fairly large discrepancy with the predicted value of 984 cm-1 (see table 4) and the observed low wavenumber would require a C-F bond weakening. This is in contradiction with the predicted C-F bond shortening resulting from the 2a" ionization. The best alternative assignment based on the present calculations would be the v11(a") vibrational motion (involving H out-of-plane deformations) for which ω11 = 873 cm-1 has been calculated (see table 4). Such a forbidden transition would only be allowed by a vibronic coupling. The weakness of the transition could support this interpretation.
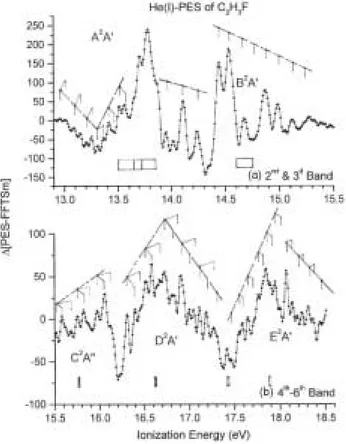
The deconvoluted Hel-PES of C2H3F above 13 eV is displayed in figure 6(a) where clearly six vibronic bands are observed. The most intense band maxima are measured at 13.79 ± 0.01 eV, 14.53 ± 0.01 eV, 16.71 ± 0.01 eV, 17.91 ± 0.01 eV and 20.20 ± 0.01 eV successively. A shoulder located at 16.1 eV is observed in the 16.71 band. Likely a weak band is partially hidden at around 19.7 eV in the 20.2 band. In spite of the resolution obtained in the present measuring conditions (about 12 meV) most of these bands exhibit only very partially resolved structures. The resolution is likely to be limited by the natural linewidth of the vibrational states which is related to their lifetime.
In a recent analysis of the vacuum UV photoabsorption spectrum of C2H3F [9], several structured broad bands were observed near and above 11 eV, i.e. at 10.94 eV, 11.3 eV, 12.5 eV and 12.9 eV. These were possibly assigned to 3s, 3p and 3d Rydberg series converging to the 13.79 eV ionization limit. Diffuse features were mentioned but neither classified nor assigned. The present data could provide more detail on these structures.
Applying the continuum subtraction method to the PES, the resulting ∆-plot is shown in figure 6(b) revealing more clearly the fine structure present in these bands. The energy positions of these features are listed in table 9.
For the PE-band with its maximum at 13.79 eV, an adiabatic ionization energy (IEad) could be measured at IEad = 12.953 ± 0.010 eV. From most of the literature data [1, 2, 4, 6] (see table 1), only the vertical ionization energy (IEvert) is available as lying at Evert = 13.8 eV, in very good agreement with the present measurements. Only Reinke et al [2] obtained an Ead =13.27 eV by using an extrapolation method. By quantum mechanical calculations [4, 5], Evert = 13.8 eV is obtained and assigned to the (7a')
-1
ionization leading to the Ã2A' first excited ionic state. In the present work, the calculations provide Ead = 12.91 eV and IEVert = 13.51 eV.
Table 7. Energy position (eV), tentative assignments and predicted level (eV) for the structures observed in the
first photoelectronic band corresponding to the C2H3F +
state: (0,0) means vibrationless level. Comparison is made with the TPES measured in this work.
HeI-PES TPES Assignment
10.363 10.367 (0,0) 10.424 10.419 v9 (10.424) 10.466 10.475 ν8 10.485 - 2v9 (10.485) or v8 (10.485) 10.523 10.523 v7 (10.517) 10.558 10.551 v4 (10.557) (or 3v9 (10.546)) 10.570 - 2v8 10.586 - v7 + v9 (10.578) 10.610 10.607 4v9 (10.603) or 2v8 (10.607) 10.619 - v4 +v9 (10.618) 10.641 - v7 + v8(10.639) 10.655 10.655 v4 + v8 10.674 - 3v8 10.679 10.679 v4 + 2v9 or v4 + v8 (10.679) 10.714 10.711 v4 + v7 10.740 10.739 v4 + 3v9 10.749 - 2v4 (10.751) 10.767 10.759 v4 + 2v8 10.779 - v4 + v7 + v8 (10.762) 10.801 10.803 v4 + 4v9 or v4 + 2v8 (10.801) 10.810 - 2v4 + v9 10.830 - v4 + v7 + v8(10.833)
10.842 - 2v4 + v8 10.866 10.860 2v4 + 2v9 10.897 - na 10.907 10.904 2v4 + v7 10.927 10.928 2v4 + 3v9 10.944 10.948 3v4 (10.945) 10.954 - 2v4 + 2v8 10.970 - na 10.992 - 2v4 + 2v8 (10.995) 11.003 - 3v4 + v8 11.019 ~11.01 2v4 + v7 + v8 (11.027) 11.045 - 3v4 + v8 11.059 ~11.05 3v4 + 2v9 11.075 - 3v4 + 2v8 (11.067) 11.096 ~11.09 3v4 + v7 11.114 - 3v4 + v8+ v9 (11.110) 11.137 ~11.14 4v4 (11.139) 11.151 - 3v4 + 2v8 11.167 - 3v4 + v7 + v9 (11.160) 11.183 - 3v4 + 2v8 (11.189) 11.197 - 4v4 + v9 11.216 - 3v4 + v7 + v8(11.221) 11.232 - 4v4 + v8 11.254 - 3v4 + 3v8 11.264 ~11.26 4v4 + 2v9 11.279 - na 11.295 - 4v4 + v7 11.321 - 4v4 + 3v9 11.333 - 5v4 (11.333) 11.352 - na 11.372 - na 11.392 - 5v4 + v9 11.409 - 4v4 + v7 + v8(11.415) 11.423 - na 11.443 - 5v4 + v8 11.459 - 5v4 + 2v9 or 5v4 + v8 (11.455) 11.470 - na 11.492 - 5v4 + v7 11.508 - 5v4 + 3v9 (11.516) 11.526 - 5v4 + 3v9 11.545 - 5v4 + 2v8 11.565 - 5v4+2v8 (11.577)
The ∆-plot related to this band is shown in figure 7(a) on an expanded ionization energy scale. A classification of most of the features observed between 12.9 eV and 14.3 eV has been attempted and has been assigned to a vibrational progression. Very likely the 13.8 eV-band is made of two parts: (i) the low-energy 12.9-13.6 eV part showing a regular structure made of progressions with two average wavenumbers ωA = 110 ± 10 meV (887 ± 80 cm-1) and ωB = 54 ± 6 meV (435 ± 48 cm-1) and (ii) the 13.9-14.2 eV part showing a short progression with ω = 140 ± 10 meV (1129 ± 80 cm-1). The broad and strong structures do not fit in these regularities.
As mentioned above, the wavenumber ωA = 110 ± 10 meV is an average value. It is possibly affected by a strong anharmonicity. Using the data listed in table 9 (for the first five vA values, a Birge-Sponer plot (with 0.92 correlation coefficient) provides ωA = 129 ± 4 meV (1040 ± 32 cm-1) and ωAxA = 3.1 ± 0.6 meV (25 ± 5 cm -1
). Comparing the wavenumber values below and above the 13.6-13.9 eV region, it could be suggested that one is dealing with the same vibrational normal mode.
For the assignment of ωΑand ωΒwe can only refer to the quantum mechanical calculations performed in
the present work. Wavenumbers related to the 2A' state of C2H3F+ have been calculated at different levels and the results are listed in table 4. Unambiguously ω Β= 435 ± 48 cm
-1
determined by PES fits at best the predicted 428 cm-1 value for ω9 ascribed to the CH2 in-plane rocking and F-CC bending motion.
Figure 6. (a) Deconvoluted HeI photoelectron spectrum of C2H3F between 13 eV and 21 eV and (b)
corresponding ∆-plot enhancing the fine structures in the successive bands.
Concerning the wavenumber ωA = 1040 ± 32 cm -1
, it has to be compared with the predicted ω4 = 1074 cm-1 and ω5 = 1176 cm-1 involving H-CC bending and C-F stretching respectively. Within the uncertainty limits on the experimental determination, ω4 would best correspond to ω Α but ω 5 could not be discarded, because the accuracy of the quantum chemistry calculations is not known. Referring to table 2, the transition involves strong changes in the C-F bond length and in the H-CC angles so that both normal modes could show extended progressions.
The 13.6-13.9 eV region (in bold in table 9) shows at least four features difficult to integrate in the above-mentioned progressions. As a matter of fact, an assignment in terms of vibrational normal modes is probably irrelevant here, because this region of the hypersurface is strongly perturbed by nonadiabatic interactions. From photoion-photoelectron coincidence (PIPECO) measurements [28] and dissociative photoionization mass spectrometric data [29] the four most important fragmentation channels of C2H3F
+
are open and in competition. The appearance energies for C2H2+, C2H2F+, C2HF+ and C2H3+ are respectively 13.51 eV, 13.64 eV, 13.72 eV and 13.84 eV [29]. They represent 60% of the total ionization measured at 20.7 eV [29]. A more accurate description of the strongly perturbed 13.6-13.9 eV region must very likely take into account the avoided crossing between the and the states of C2H3F+ ion identified by the present calculations (see section 4.2).
The PE band extending from 14.3 eV to 15.5 eV exhibits a more regular structure (see figure 6) giving rise to a fairly well-structured ∆-plot shown in figure 7(a). The energy positions of the features are listed in table 9. The adiabatic ionization energy could not be measured. Therefore, we started the analysis at 14.342 eV which corresponds to an excited vibrational level, whose energy is noted Emin, of the considered excited state of the C2H3F+ ion.
Figure 7. ∆-plot of the HeI-PES of C2H3F on an expanded ionization energy scale between (a) 12.9 eV and 15.5
eV and (b) 15.5 eV and 18.5 eV. Vertical bars indicate the vibrational structures and shaded areas with vertical bars locate the fragment appearance energies measured by photoionization mass spectrometry [29].
This band is assigned to the (6a')-1 ionization and corresponds to the state of C2H3F+ in agreement with previous calculations [4, 10]. A fairly simple progression likely involving a single vibrational normal mode is observed. The average spacing is ω = 110 ± 17 meV (887 ± 130 cm-1). This experimental value falls between two ab initio calculated values (see table 5), i.e. ω7 = 1094 cm
-1
and ω8 = 529 cm -1
using CAS(11,8) level calculations. Comparing the results for the wavenumbers characterizing the state of C2H3F
+
(see table 5) calculated at different levels, the CAS(11,8) level calculations provide ω values exceeding the B3LYP values by about 5-18%. This finding would argue for assigning ω = 887 ±130 cm-1 to the v7 mode corresponding to the H-CC bending excitation.
Table 8. Comparison of the vibrational wavenumbers (cm-1) characterizing the band in the
HeI-PES as reported in previous works, in the present work and those predicted by ab initio quantum mechanical calculations in this work and in [14].
Experiment Theory
Vibrational
normal modes [1] [2] [6] This work [14] This work
v4 1530 1570 1530 1565 ± 16 1737 1567 v7 1330 1330 1270 1278 ±12 1337 1246 v8 - - 850 839 ± 40 a or 968 ± 30a 1059 984 v9 510 500 500 500 ± 32 521 489 a
Table 9. Energy position (eV) of the fine structures observed in the second to seventh photoelectron bands of
C2H3F and their assignments.
State Energy (eV) Assignment(s)
12.953 IEad(0,0) 13.014 v9 13.083 vA a 13.143 v9 + vA 13.203 2vA 13.253 v9 + 2vA 13.313 3vA 13.363 v9 + 3vA 13.413 4vA (13.443) na 13.513 5vA 13.563 v9 + 5vA 13.653 na 13.703 na 13.783 na 13.873 na 13.952 nvA 14.013 (n + 1)vA 14.102 (n + 2)vA (14.192) na 2 A' 14.232 (n + 3)vA 14.342 Emin 14.442 Emin + v7 14.532 Emin + 2v7 14.672 - + 3v7 14.872 - + 5v7 14.992 - + 6v7 15.121 - + 7v7 15.221 - + 8v7 15.271 - + 9v7 2 A' 15.321 -+ 10v7 15.511 Emin 15.581 Emin + v8 15.681 -+ vB 15.751 Emin + v 4 15.821 Emin + v4 + v8 15.871 - + v4 + vB 15.971 Emin+ 2v4 16.060 Emin+ 2v4 + v8 2 A" 16.120 - + 2v4 + vB 16.300 Emin 16.400 Emin + vC 16.450 Emin + vB 16.520 Emin + v A 16.590 - + vA + vC (16.660) - + vA + vB 16.730 Emin + 2vA 16.810 - + 2vA + vC 16.930 Emin + 3vA 17.000 - + 3vA + vc 17.050 - + 3vA + vB 2 A' 17.109 Emin + 4vA
- + 4vA + vC - + 4vA + vB 17.299 Emin + 5vA 17.414 na 17.459 Emin 17.549 Emin+ vA 17.589 - + v9 2 A' 17.649 Emin+ 2vA 17.709 Emin + 2vA + v9 17.758 Emin + 3vA 17.809 - + 3vA+ v9 17.849 Emin + 4vA 17.889 - + 4vA+ v9 17.949 Emin + 5vA 17.998 - + 5vA+ v9 18.068 Emin' 18.133 Emin' + v9 18.188 Emin' + vC 18.238 - + vC+v9 18.308 Emin' + 2vC 18.363 17.189 2 A' 18.438 17.269 19.917 na 20.026 Emin 20.156 Emin +vA 20.266 - + 2vA 20.386 - + 3vA 20.506 - + 4vA 2 A' 20.636 - + 5vA na = not assigned. a
vA,vB, vC, see the text.
It is noteworthy to mention that the PES band exhibits a fairly regular intensity distribution except for Emin+3v7 at 14.672 eV. This member corresponds almost exactly to the energy range where two appearance energies, that is AE(CH2F
+
) = 14.60 eV and AE(CF+) = 14.74 eV, have been measured [29]. Furthermore, the perturbation of the state by an avoided crossing with the state and by a conical intersection with the state has been established by the present ab initio calculations (see section 4.2). Dissociative autoionization could also be invoked (see region c in the PAS, figure 3(b)).
As already pointed out, figure 6(a) very clearly shows the existence of a strong shoulder PES-band at about 16.16 eV. Sze et al [6] also mention a PES band at 16.0 eV.
According to the present ab initio quantum mechanical calculations, the 1a" orbital comes immediately below the 6a' orbital. Ionization from this orbital leads to the ionized state of C2H3F
+
. In their photoelectron spectroscopic and theoretical work, Bieri et al [4] assigned the 16.7 eV band to the (1a",5a') ionizations measured at 16.7 eV and calculated at 16.79 eV and at 17.13 eV respectively. Heaton and El-Talbi [11] calculated the (1a")-1 and the (5a')-1 ionization energies at about 17.0 eV. Sze et al [6] reversed the 5a' and 1a" orbital ionization energies, i.e. (5a')-1 and (1a")-1 were assigned to 16.0 eV and 16.7 eV respectively.
An attempt to analyse the structure of the band is presented in table 9 extending from 15.511 eV up to 16.120 eV. As shown in figure 7(b) probably three different vibrational normal modes are involved and are characterized by ωA = 230 ± 10 meV (1855 ± 80 cm-1), ωB = 147 ± 25 meV (1185 ± 200 cm-1) and ωc = 76 ± 8 meV (613 ± 64 cm-1). The predicted wavenumbers as calculated at the CAS(11,8) level are listed in table 5. Taking into account the above-mentioned remark about the CAS and B3LYP calculation levels, the ωA and ωc
could very likely be assigned to the v4 (C=C stretching) and v8 (C-F stretching and CH2 rock in-plane) vibrational motions, respectively calculated at ω4 = 1793 cm-1 and ω8 = 500 cm-1. The assignment for the less accurate ωB = 1185 cm-1 could be ω6 = 1276 cm
-1 .
The adiabatic ionization energy of the next PES-band having its vertical ionization energy at 16.71 eV is estimated to be IEad = 16.0 eV by linear extrapolation of the peak low-energy side. Reinke et al [2] reported IEad = 16.14 eV. It should be assigned to the (5a')-1 orbital ionization resulting in the state formation of C2H3F+.
An attempt to disentangle the vibrational structure from the ∆-plot shown in figure 7(b) is presented in table 9. Very likely three wavenumbers would account for most of the features, i.e. ωA = 220 ± 7 meV (1774 ± 56 cm-1), ωB = 142 ± 17 meV (1145 ± 150 cm
-1
) and ωc = 80 ± 12 meV (645 ± 100 cm -1
). The largest wavenumber seems to be characterized by a fairly strong anharmonicity and the Birge-Sponer diagram (with 0.90 correlation coefficient) provides ωAxA = 4.5 ± 1.2 meV (36 ± 10 cm-1). This observation could be linked to a strong perturbation of the hypersurface by, e.g., a conical intersection and/or an avoided crossing as mentioned at the end of section 4.2. A similar phenomenon was already pointed out for the state of C2H3F
+ .
The difficulties encountered in the calculation of the D 2A' state, owing to the multiple surface crossings prevented us from calculating the vibrational wavenumbers (see section 4.2). This state was found to be a transition state (see TS in table 5: presence of an imaginary wavenumber) in the Cs symmetry group. Experimentally, the ωA = 1774 ± 56 cm-1 could very probably be assigned to the C=C or C-H stretching motion, whereas ωc = 645 ± 100 cm
-1
would likely involve an H-CC bending motion and ωΒ= 1260 cm
-1
could be related to the C-F stretching vibration.
The PE band with its IEvert = 17.91 ± 0.01 eV is assigned to the (4a') -1
ionization predicted at 18.34 eV by theoretical calculations [4] and giving rise to the state of the C2H3F
+ ion.
In a first part, spreading up to 17.998 eV, this band seems to consist of one progression with ωA = 98 ± 8 meV (790 ± 64 cm-1) and its combination with ωB = 47 ± 10 meV (379 ± 80 cm-1). If the latter wavenumber can very likely be assigned to v9 (CH2 in-plane rocking), the former lies in the range of the v7 (H-CC bending) frequency, as observed for most of the lower lying ionic states.
Surprisingly, the ωΑ= 98 ± 8 meV progression is interrupted at 18.068 eV where a sudden intensity
increase is observed, highlighting a short progression with a larger wavenumber ωc = 123 ± 6 meV (992 ± 48 cm-1) which likely involves the C-F stretching motion.
Quantum mechanical calculations predicted the (3a')-1 orbital ionization energy at 20.86 eV [4]. The PES band observed at 20.2 eV was then assigned to the corresponding F 2A' state [4]. This energy corresponds to the band observed at 20.20 ± 0.01 eV in the present work but denoted in figure 6. This band shows two characteristics never mentioned earlier: it exhibits (i) a well-defined vibrational structure (see figure 6(b)) and (ii) a weak shoulder extending between 19.1 eV and 19.8 eV (see figures 2(b) and 6(a)).
Table 9 and figure 6(b) clearly show the regular vibrational progression involving a single wavenumber
ωA = 120 ± 8 meV (968 ± 32 cm-1) and starting at 19.917 eV. It can reasonably be assigned to a v7 vibration involving the H-CC bending motion.
The ∆-plot in the weak shoulder region (see figure 6(b)) is fairly noisy compared to the range below 13 eV: no regular structure could be observed. However, undoubtedly a C2H3F
+
excited vibronic state is concerned. The relative weakness of the transition could indicate that a first multiple electron transition is involved: we refer to it as the state in figure 6(a). Alternatively, it could be assigned to the (3a')-1 ionization leading to the state. Consequently, the upper structured band would then be assigned to the (2a')-1 ionization giving rise to the state which is predicted to be at 24.76 eV [4].
5.2. The TPE and CIS photo electron spectra
The TPES of C2H3F, recorded between 8 eV and 32 eV, is shown in figure 2(a). Except for the relative intensities of the bands the TPE spectrum reproduces almost the HeI PE spectrum. However, in the 12 eV photon energy range, a quite strong band appears in the TPES only. Additionally, data are obtained above the 21.22 eV
energy limit.
Dramatic intensity variations are observed between both spectra. When normalizing the intensity to the band, the to bands show large intensity increases of at least a factor 3 ( state) to 9 ( state). Clearly the intensity ratios within the two spectra are strongly perturbed also, e.g., intensity ratio being 1.6 in the HeI-PES and 0.8 in the TPE spectrum.
Except for the first band, the bands lying at higher energy are structureless at the resolution achieved in the present experiment. The result for the first band is shown in figure 1 and the position in energy of the features resolved in the TPES are listed in table 7. Good agreement is found between both Hel-PES and TPES experiments for the features observed under the present experimental conditions. Their assignments have already been discussed in detail (see section 5.1). Concerning the relative intensities of the individual vibronic transitions no significant differences have to be mentioned.
Contrary to the well of the potential hypersurface, its upper part can only be populated by autoionization. A fairly strong intensity increase of the threshold electron signal starts at 11.7 eV and a maximum is observed at 12.6 eV. Obviously this phenomenon is correlated with the presence of Rydberg states observed in the b-region of the photoabsorption spectrum (PAS) shown in figure 3(b) [9]. Owing to the large density of states, the fine structure could not be resolved.
At higher photon energies between 14 eV and 22 eV band maxima corresponding to vertical ionization energies have been measured (see table 1) and good agreement is found with the Hel-PES results. Above 20.2 eV very weak transitions are observed corresponding to broad structureless bands in the TPE spectrum. The energy positions are listed in table 1.
Ionization from the (1a')-1 inner-valence shell orbital has been calculated to appear at 39.56 eV [4], i.e. too high for the observed structures. The weakness of these transitions suggests that forbidden multiple electron transitions are involved. Sze et al [6] investigated the HeII-PES of C2H3F but reported only the analysis up to 22 eV.
The large relative intensity variations (and ionization cross-sections) between the HeI- and TPE spectra could only be interpreted with the help of both the CIS and the PAS spectra [9]. Both are shown in figures 3(a) and (b) in the 10-24 eV photon energy range. Five spectral regions (designated a-e) are related to energy ranges where Rydberg and/or valence transitions have been observed. The details of their assignment were discussed in an earlier work [9].
Vibrationally resolved CIS spectra have been recorded for the vibronic states and a typical example is shown in figure 3(a). The C2H3F
+
vibronic state at 10.55 eV shows a fairly constant cross-section over the wide 10.55-15.8 eV photon energy range. Only very weak b- and c-region contributions could be mentioned. Above 15.8 eV a strong cross-section increase is observed corresponding to the d-region of the PAS which is linked to the 4s or 4d Rydberg state. This state autoionizes to the (v4, υ = 1) state of the cation. As will be reported later [30], this situation will drastically change with further fluorine-substituted ethylenes.
At higher photon energies the CIS spectra were recorded at the successive vertical ionization energies corresponding to the to cationic states (see figure 3(a)). The present data particularly highlight the contributions of the neutral excited states to the cross-section variations for the production (and dissociation) of each individual ionic state.
The nature of the neutral states involved in the transitions observed in the 10-22 eV photon energy has been discussed in detail (see table 1 in [9]). Several excited valence and Rydberg transitions have been identified and were assigned to the successive features observed in the PAS. Most likely the Rydberg states thus observed contribute significantly to the ionization cross-section of C2H3F in its successive ionic states through autoionization. This latter phenomenon has to play an essential role, representing about 70-90% of the total ionizing contribution as is the case for the to ionic states.
6. CONCLUSIONS
The HeI photoelectron (HeI-PES), threshold photoelectron (TPES) and constant ion state (CIS) spectroscopies have been applied for the detailed investigation of the photoionization of C2H3F. These
techniques completed a previous investigation of the vacuum UV photoabsorption spectrum (PAS) of the same molecule [9]. The use of a subtraction method applied to the spectra allowed us to make a detailed examination of the abundant vibrational structure observed in the different PE bands. Ab initio quantum mechanical calculations applied to the C2H3F+ system proved to be essential for the assignment of the numerous structures present in the spectra. Several perturbations in the vibrational structure observed in various PE bands could be linked to the opening of fragmentation channels as well as to the presence of conical intersections and/or avoided crossings identified by the quantum mechanical calculations.
Acknowledgments
We are indebted to the University of Liege, the Fonds de la Recherche Fondamentale Collective (FRFC) and the Freie Universitat Berlin for financial support. RL and BL gratefully acknowledge the European Community for its support through its TMR (Contract EU-HPRI-1999CT-00028) and 13 (Contract RII 3CT-2004-506008). DD's contribution was supported by the Belgian program on Interuniversity Attraction Poles of the Belgian Science Policy (IAP n°P6/19).
References
[1] Lake R F and Thompson H 1970 Proc. R. Soc. A 315 323
[2] Reinke D, Baumgärtel H, Cvitaš T, Klasinc L and Güsten H 1974 Ber. Bunsen Gesell. Phys. Chem. 78 1145 [3] Reinke D, Krassig R and Baumgartel H 1973 Z Naturf 2S a 1021
[4] Bieri G, Asbrink L and Von Niessen W 1981 J. Electr. Spectr Rel. Phenom. 23 281 [5] Bieri G, Von Niessen W, Asbrink L and Svensson A 1981 Chem. Phys. 60 61 [6] Sze K H, Brion C E, Katrib E and El-Issa B 1989 Chem. Phy 137 369 [7] Locht R, Leyh B, Hottmann K and Baumgartel H 1997 Chem Phys. 220 207
[8] Hoxha A, Locht R, Leyh B, Dehareng D, Hottmann K, Jochims H W and Baumgärtel H 2000 Chem. Phys. 260 237 [9] Locht R, Leyh B, Dehareng D, Jochims H W and Baumgärtel H 2009 Chem. Phys. 362 97
[10] Meza S and Wahlgren U 1971 Theor. Chim. Acta 21 323 [11] Heaton M M and El-Talbi M R 1986 J. Chem. Phys. 85 7198
[12] Potts A W, Benson J M, Novak I and Svensson W A 1987 Chem. Phys. 115 253 [13] Pradie N A and Linnert H V 2007 J. Phys. Chem. A 111 4836
[14] Takeshita K 1999 Theor. Chem. Ace. 101 343
[15] Locht R, Leyh B, Hottmann K and Baumgartel H 1997 Chem Phys. 220 217
[16] Reichardt G, Noll T, Packe I, Rotter P, Schmidt J-S and Gudat W 2001 Nucl. Instrum. Methods A 467-468 458 [17] Locht R, Caprace G and Momigny J 1984 Chem. Phys. Lett. 111560
[18] Locht R, Leyh B, Denzer W, Hagenow G and Baumgärtel H 1991 Chem. Phys. 155 407 [19] Dunning T H Jr 1989 J. Chem. Phys. 90 1007
[20] Woon D E and Dunning T H Jr 1993 J. Chem. Phys. 98 1358 [21] Becke A D 1993 J. Chem. Phys. 98 5648
[22] Lee C, Wang W and Parr R G 1988 Phys. Rev. B 37 785
[24] Hegarty D and Robb M A 1979 Mol. Phys. 38 1795 [25] Eade R H E and Robb M A 1981 Chem. Phys. Lett. 83 362
[26] Bernardi F, Bottini A, McDougall J J W, Robb M A and Schlegel H B 1984 Faraday Symp. Chem. Soc. 19 137 [27] Frisch M J et al 2003 Revision B.04, Gaussian Inc., Pittsburgh PA
[28] Dannacher J, Schmelzer A, Stadelmann J-P and Vogt J 1979 Int. J. Mass Spectrom. Ion Phys. 31 175 [29] Kaufel R 1985 PhD Thesis Freie Universität Berlin