DOCTORAT DE L’UNIVERSITÉ DE TOULOUSE
Délivré par l'Université Toulouse III - Paul Sabatier Discipline ou spécialité : Astrophysique
Dr. Cecilia Ceccarelli Pr. Massimo Gervasi Dr. Thomas Giesen Pr. Jose Cernicharo Pr. Adam Walters Dr. Marco De Petris !!!! JURY Presidente et Rapporteur Rapporteur Rapporteur Examinateur Directeur de Thèse Co-Directeur de Thèse
Astronome, LAOG, Grenoble Professeur, Milano Bicocca, Italie Privat Dozent, Universität zu Köln, Allemagne Professeur, DAMIR/CSIC, Espagne
Professeur, UPS/CESR, Toulouse Chercheur, Università di Roma ‘Sapienza’, Italie
Ecole doctorale : Science de l’Univers, de l’Environnement et de l’Espace Unité de recherche : Centre d'Etude Spatiale des Rayonnements, UMR 5187
Directeur(s) de Thèse : Prof. Adam Walters - Dr. Marco De Petris
Présentée et soutenue par Valerio Lattanzi
Le 24/10/2008
Titre :
Les molécules comme outils pour l’astrophysique et la
cosmologie dans les bandes IRL/mm :
1.1 A brief history of molecules in interstellar space . . . 1
1.2 Astrophysical molecular spectroscopy . . . 3
1.3 Near future radio-astronomy projects . . . 5
1.3.1 Herschel space observatory . . . 5
1.3.2 Atacama Large Millimeter Array . . . 8
1.3.3 SOFIA . . . 10
1.4 Importance of laboratory measurements . . . 12
2 Molecular Databases for Radio-Astronomy 14 2.1 Detected molecules in ISM . . . 14
2.2 Main web databases for radio-astronomy . . . 17
2.2.1 Jet Propulsion Laboratory database . . . 17
2.2.2 The Cologne Database for Molecular Spectroscopy . . . 19
2.2.3 Other molecular databases for astrophysics . . . 20
2.3 Summary of web databases . . . 20
3 Jet Propulsion Laboratory experimental and analytical tools 25 3.1 Experimental setup . . . 27
3.1.1 Sources and input electronics . . . 27
3.1.2 Cells and sample handling . . . 29
3.1.3 Detection and readout electronics . . . 29
3.2 SubMillimetre Analysis Program . . . 31
3.3 The analysis: SPFIT & SPCAT software . . . 36
4 Formyl Ion 42 4.1 HCO+: observations in space and the laboratory . . . . 42
4.2 Ion chemistry in the interstellar clouds and HCO+ formation . . . . 43
4.2.1 The role of deuterium . . . 44
4.3 Laboratory background . . . 45
4.4 Rotational spectroscopy of linear molecules . . . 46
4.4.1 l-type doubling effect . . . . 49
4.4.2 Nuclear hyperfine splitting . . . 49
4.5 Experimental details . . . 50
4.6 Analysis . . . 54 iii
4.6.1 HCO+ . . . . 56
4.6.2 Rare Isotopologues . . . 61
4.7 Discussion . . . 65
5 Monodeuterated Methane 67 5.1 Methane in the interstellar medium . . . 67
5.2 Theory of symmetric top molecules . . . 69
5.3 Experimental details . . . 71
5.4 Analysis . . . 75
5.4.1 Perturbation Allowed transitions . . . 76
5.4.2 Ground State Combination Differences . . . 76
5.4.3 13CH 3D . . . 79
6 Formic Acid 81 6.1 Astrophysical interest of the species . . . 81
6.2 Spectroscopic background of formic acid . . . 82
6.3 Spectroscopy of Asymmetric Top molecules . . . 83
6.4 Experimental details . . . 87
6.5 Data analysis . . . 90
6.5.1 trans-isomers . . . . 93
6.5.2 cis-isomers . . . . 98
6.6 Final remarks . . . 100
7 Propane: a double internal rotor 104 7.1 Propane in the earth and planetary atmospheres and in the ISM . . . 104
7.2 Internal Rotation theory . . . 105
7.3 Spectroscopic studies of Propane . . . 111
7.4 Experimental details . . . 112
7.5 Analysis of a double rotor with SPFIT . . . 113
7.6 Discussion . . . 123
8 Extragalactic spectroscopy for Cosmology 126 8.1 Standard Model and alternative cosmologies . . . 126
8.1.1 The framework of Standard Cosmology . . . 126
8.2 TCM B in non-standard models . . . 130
8.2.1 Cosmic thermometer: CMB temperature from molecular absorption . . . 132
8.3 Instrumental configuration . . . 136
8.3.1 The Millimetre and Infrared Testagrigia Observatory . . . 138
8.3.2 MASTER radiometer . . . 141
8.4 The Acousto-Optical Spectrometer . . . 146
8.5 First tests and calibrations on the Acousto-Optical Spectrometer . . . 148
8.6 What’s next? . . . 155
Conclusions 160
A Radiative transfer and local thermodynamic equilibrium 162
B Publications 164
Jupiter and Saturn Oberon Miranda and Titania Neptune Titan Stars can frighten...you ( Roger Keith “Syd” Barrett, 1967)
This manuscript reflects in its structure the work done in two different astrophysical fields, with the central idea to show how the same science “tool” can be used to derive information in these two fields.
The “tool” that will be described in detail in the following chapters is rotational molecular spec-troscopy. We will show in the following chapters of this thesis, how the analysis of the rotational spectra of molecules can be used to constrain the physical and chemical properties of the interstellar medium in the local Universe; then how the same kind of information, but from molecules outside our Galaxy, can help to define the cosmological models used to describe the large-scale Universe. The first part of the work was mostly carried out in the Centre d’Etude Spatiale des Rayonnements (CNRS-Universit´e Paul Sabatier) in Toulouse, where data reduction and analysis were performed. Measurements were taken in spectroscopy laboratories mostly at the Jet Propulsion Laboratory in California. The second part has been conducted in the Experimental Cosmology Group of the Physics Department of “Sapienza” University in Rome.
Near-future radioastronomy instruments, such as the Herschel Space Observatory (HSO, to be launched in 2009) and the international interferometer ALMA (coming into service progressively from 2010) will take high-resolution measurements in the submillimetre and THz ranges, allowing us to obtain very detailed models of astrophysical objects, such as protostars. Some of the information to constrain these models will be based on the analysis of spectral surveys, which will contain up to tens of thousand of lines caused by a large number of molecular species that can be present. Many laboratory measurements in the THz region are still lacking; for this reason higher precision spec-troscopic data are required. The increased frequency range and higher sensitivity of next generation instruments holds the promise of detecting new exciting species such as complex organic molecules and Polycyclic Aromatic Hydrocarbons (PAH). However, not only spectroscopic data must be pro-vided for these species but also weaker and/or higher frequency lines of known molecules must be
known in order to make the identification possible. This implies new work on the isotopologues of known species and measurements of molecules in vibrationally excited states, especially those of lower energy. Also the idea of using molecular lines as a “probe” to characterise the physics and chemistry of astrophysical objects implies high-precision predicted or measured frequencies with as-sociated molecular parameters intervening in the calculation of the intensities. Much fundamental molecular data is still lacking for several reasons:
• the spectrum of the species has already been measured but not with the most modern
experi-mental apparatus or not at high frequency, or both.
• measurements have been focused only on the principal isotopologue and information on
impor-tant isotopic substituted species, such as the deuterated ones, are lacking. It has been shown recently that a much higher D/H ratio than predicted by elemental abundance can be ob-served in certain astrophysical regions, specifically around protostars. It would be interesting to study if this phenomenon occurs also for other isotopic species. Isotopomers such as 13C
(and sometimes even doubly substituted) are also used to obtain optically thin measurements.
• the species is reactive and the optimisation of laboratory conditions for its production in situ are critical and not always easy to achieve. For the lighter reactive species that can be
observed by Herschel only a few transitions are available in the laboratory and hence positive identification is not easy.
• the spectrum can be very hard to analyse, with a very large number of transitions.
For clarity of presentation the first part of this work will be presented in several chapters (from 1 to 7), in order to show the analysis performed for each different molecular species that has been studied.
The main motivation of this part of the work connected to the astrophysics of the interstellar medium and to near future radio-astronomy instruments will be presented in the first chapter. As will be discussed new telescopes will be earth-based, mounted on a jumbo-jet and launched into space. The main molecular databases developed for radio-astronomy will be presented in the second chapter. In this chapter the very first subject of my thesis work, consisting of an evaluation of the status of these databases will be presented, in order to better understand the need for new accurate high-resolution high-frequency measurements of molecular spectra.
All the experimental work presented in the thesis (excluding the last chapter) has been carried out at the microwave spectroscopy laboratory of the Jet Propulsion Laboratory (NASA-CalTech) in Pasadena, USA. In the third chapter will be shown the experimental apparatus used in this labora-tory and the software programs used for data reduction and analysis of the spectra.
that, excluding the study on the Propane molecule, this presentation reflects also the chronological order of the measurements and the corresponding analysis.
The second part of my work will be presented in chapter 8.
Precision Cosmology has started only recently, when the improvement in technology has allowed for sensitive observations of the Cosmic Microwave Background radiation (CMB). Cosmology has become an empirically rich subject with a justified standard model, but work is still needed to es-tablish it as accurate. From this perspective, primary cosmological tests of the standard Big Bang model are necessary.
In the first part of this chapter the standard cosmology model will be reviewed, highlighting the main successes and the reasons why other models are not completely ruled out yet. For this purpose I will show how the temperature of the CMB can be determined using molecular rotation lines both in emission and in absorption.
In the following sections I will present an instrument that will be able to retrieve this information. This experimental section will be devoted to the description of the general apparatus, consisting of a radiometer (called MASTER) developed and tested by the Radioastronomy group at University Milan-Bicocca, that will be coupled to the MITO (Millimetre and Infrared Testagrigia Observatory) telescope placed in the Italian Alps and operated by the Rome group.
The spectral analysis of the astrophysical radiation will be performed by an acousto-optical spectrometer, that has been developed in Arcetri, Florence (IRAINAF, Radioastronomy Institute -National Institute for Astrophysics). In the final part I will show the first tests and calibration of this spectrometer that I have performed in the laboratory in Rome during the second part of my thesis.
Finally in the annex will be presented the papers published in international journals, con-cerning the work developed during the last three years.
Astrophysical tool
The splendour of a night sky filled with glowing stars is one of the truly remarkable expe-riences of life. At first glance, the space between the stars seems to be empty, however, there must be some material from which stars can form. As we look more carefully at the interstellar space, we find that it is filled with a diffuse gas laced with microscopic dust particles. This combination of gas and dust is called the interstellar medium (ISM) and is the raw material from which stars are being formed. This material is found throughout the Universe, though mainly concentrated within galaxies, with very little found in between.
In this chapter we want to give a description of the astrophysical phenomena which induced our laboratory work, starting from a brief historical review of the identification of molecules in the interstellar medium. Then the information that can be derived from a molecular spectroscopy study of the ISM will be shown. Finally the near future radio astronomy projects will be described in relation to the motivation of our laboratory work.
Part of the physical quantities used in this chapter are derived and explained in the Annex A.
1.1
A brief history of molecules in interstellar space
Molecular line radiation was detected in late type stars with low surface temperatures, planetary atmospheres and comets in the 1930s. In 1941 interstellar absorption lines of CN were found toward the star ζ Oph; later, lines of CH+ and CH were identified. These results showed
that at least simple molecules exist in the interstellar medium (ISM), given the proper physical conditions.
Molecular line radio spectroscopy began in 1963 when Weinreb et al.[1] detected OH lines in absorp-tion toward the supernova remnant Cassiopeia A. The clouds containing OH are not associated with the radio sources Cas A, but are line-of-sight objects. Until 1968 all interstellar molecules detected consisted of only two atoms and this was believed to be a natural limit caused by low densities in the ISM. But then the line radiation of ammonia, NH3 was found by Cheung et al.[2]. Even more
spectacular was the discovery of a centimetre wavelength line of water vapour, H2O by the same
group. Toward some of the sources, the λ = 1.35 cm water vapour line showed intense radiation consisting of features with narrow linewidths. It was soon found that this emission was time vari-able. In 1969, Formaldehyde, H2CO was discovered by Snyder et al. [3] Later Palmer et al. [4]
found that in some regions, the 6 cm K-doublet line of H2CO is seen in absorption against the 2.7 K
microwave background, that pervades all of space and all kinetic temperatures are larger than this. In Local Thermodynamic Equilibrium (LTE), 2.7 K < Tex < TK1 must hold (see Annex A); thus absorption of the 2.7 K background must be caused by non-LTE effects: the population of the lower level is increased, so that the absorption is enhanced. This effect is caused by collision [5]. After this initial discovery period, perhaps the most important molecule found was carbon monoxide, in mid-1970. After 1970, the number of cloud maps and molecules discovered, steadily increased. The first detection of extragalactic molecular emission was in 1975.
As will be shown in the next chapter, the molecules detected in the ISM are, as of January 2008, more than 140. From the tables in chapter 2 (Tables 2.1 and 2.2), one notes first, that many of the molecules are organic. The remaining are mostly diatomic species, and belong to what is com-monly called inorganic chemistry. Aside from molecular hydrogen, the most widespread species are CO, OH, NH3, SiO and H2O. Nearly all the complex molecular species contain carbon. Among
these are formaldehyde (H2CO), cyanoacetylene (HC3N), formamide (NH2CHO) and ethyl alcohol
(CH3CH2OH). Most of the organic molecules are linear chains. It is not clear yet whether this
indi-cates a true deficiency of ring molecules, since the molecular structure of ring molecules are complex with a large number of energy levels. Thus even at low interstellar temperatures, the population on any one level is low since a large number of energy levels are populated. Some of the molecules are commonly found on earth; examples are NH3, HCN and NaCl. However, others, such as OH, CN,
CO+, HCO+ and N
2H are chemically unstable even under low-pressure laboratory conditions and
will quickly combine to form other, chemically stable species if collisions take place.
The discovery of formaldehyde caused some speculation regarding organic molecules in space and a possible link to life on earth; these became stronger when additional organic molecules like methanol 1The kinetic temperature is the temperature of a gas defined in terms of the average kinetic energy of its atoms or molecules and can be expressed as:
TK= 2 3k! 1 2mv 2 " where the brackets stand for the average value.
1.2
Astrophysical molecular spectroscopy
The study of the physical parameters of molecular clouds and stellar envelopes is an im-portant goal of molecular line astronomy. The major probes are polar molecules, such as CO, CS, HCO+ (one of the species analysed in this manuscript, see chapter 4) and their isotopic
substitu-tions, or isotopologues. The population of different energy levels are determined in LTE by the kinetic temperature TK and H2 density, or the radiation field. In the annex A the definition of
the optical depth τ of a line is shown; the integrated optical depth along a typical path through the medium increases linearly with the column density of the absorber as long as this material is optically thin. As the optical depth increases, the line profile becomes saturated and the integrated optical depth cannot continue to increase linearly with the column density. Hence to determine the column density of the energy levels connected by a transitions, measurements of the intensity of an optically thin line are required (see annex A). To determine the total column density, the excitation mechanism must be known in some detail. When measurements of a few transitions of the same species are made, these can be used as a probe for the physical state of the emitting or absorbing molecular cloud. In conducting search for new species, one must have some means to estimate the line intensities. If the excitation of the species in question is valid under LTE conditions, only kinetic temperature and total column density are important. However these excitation circumstances are the exception in the interstellar medium. If the excitation is collisional, LTE can be used as a first approximation. If molecular systems are exposed to intense infrared fields, radiative excitation may dominate. In extreme cases, both infrared fields and collisions are important for the excitation, and the combination can lead to large deviations from LTE.
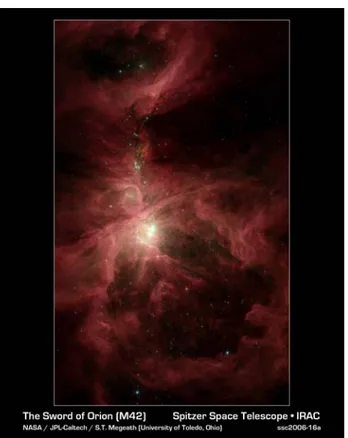
At the beginning of molecular line astronomy, identification was often based on one single transition. However this procedure can be hazardous taking into account the possibility that several different species may give rise to a transition at the same frequency within experimental precision. As ex-pected, highly excited lines are found in warmer and denser sources. One such source is the hot core region of Orion (Fig. 1.1); in its hot core, H2 densities are ∼ 107 cm−3 and kinetic temperatures
TK ∼ 160 K to 200 K. These high values insure that many transitions are excited (Fig. 1.2). Usually the first result obtained from any molecular line measurement is the conversion of line intensity, integrated over linewidth, into a column density. Ultimately from molecular astronomy, one hopes to be able to determine the complete chemical and isotopic content of a molecular cloud; a more distant goal is to determine the origin and lifetime of the cloud. Other aims are to relate
Figure 1.1: Spitzer Space Telescope image of the inner part of the Orion nebula acquired with the IRAC instrument (Credit: NASA/JPL-CalTech/Univ. of Toledo).
the excitation of the molecule in question, which may deviate from LTE. Although molecular line studies may be complex, there is no other method of studying the interiors of molecular clouds, which are the densest parts of the interstellar medium. All star formation is thought to occur in molecular clouds. There is observational evidence that the newly born stars will interact with their surroundings, perhaps causing new generations of stars to form. In addition, molecules form a substantial part of the envelopes of low-mass red giant stars. Thus, molecular line measurements allow an estimate of the amounts of elements and isotopes produced in the central stars and then returned to the ISM. Finally, molecular line measurements allow a study of molecules in the low-pressure, low-density, low-temperature environments which are difficult to obtain on earth; in the ISM one can more easily find “non terrestrial” species, or molecular excitation conditions not found in a laboratory.
1.3
Near future radio-astronomy projects
We want now briefly describe the near future projects suited to study in more details and with new technologies the “molecular universe”. We restrict the discussion to these new projects that were a major motivation for the work carried out and do not consider other existing facilities such as the French-German-Spanish IRAM observatory that are explained elsewhere.
1.3.1
Herschel space observatory
The ESA Herschel Space Observatory (HSO), scheduled for launch in early 2009, will be the largest ever infrared space observatory. Equipped with a 3.5 meter diameter reflecting telescope and it will observe at wavelengths that have never previously been explored. After a four-month journey from Earth, Herschel will spend a nominal mission lifetime of three years in orbit around the second Lagrange point of the Sun-Earth system (L2). The HSO’s primary objectives are to study the formation of galaxies in the early universe and their subsequent evolution; to investigate the creation of stars and their interaction with the ISM; to observe the chemical composition of the atmospheres and surfaces of comets, planets and satellites; to examine the molecular chemistry of the universe. The science payload will be equipped with three instruments, PACS, SPIRE and HIFI. The Photodetector Array Camera and Spectrometer is a camera and low to medium
res-Figure 1.2: Emission lines from two massive star-forming regions, G29.96 (top) and IRAS 23151+5912 (bottom) acquired with the Submillimeter Array (SMA) [6].
5 SIS 1162.2 GHz 1241.8 GHz 19"" 4.0 GHz
6+7 HEB 1412.2 GHz 1907.8 GHz 13"" 2.4 GHz
Table 1.1: HIFI frequency coverage and band allocation. The first 5 mixer bands use SIS (superconductor-insulator-superconductor) mixers; bands 6 and 7, use Hot-Electron Bolometers (HEBs)
olution spectrometer for wavelengths in the range 55-210 µm. It will employ four detector arrays, two bolometer arrays and two Ge:Ga photoconductor arrays. The bolometer arrays will be dedi-cated for wideband photometry, while the photoconductor arrays will be employed exclusively for spectroscopy with a resolution of a few thousand. PACS will be able to operate either as an imaging photometer, or as an integral field line spectrometer.
The Spectral and Photometric Imaging REceiver is a camera and low to medium resolution spectrometer complementing PACS for wavelengths in the range 200-670 µm. It comprises an imag-ing photometer and a Fourier Transform Spectrometer (FTS), both of which use bolometer detector arrays. There are a total of five arrays, three dedicated for photometry and two for spectroscopy.
HIFI is the Heterodyne Instrument for the Far Infrared and of particular relevance to the motivation for work carried out in this thesis. It is designed to provide spectroscopy at high to very high resolution over a frequency range of approximately 480-1250 and 1410-1910 GHz (625-240 and 213-157 microns). This frequency range is covered by 7 “mixer” bands, with dual horizontal and vertical polarisation, which can be used one pair at a time (Table 1.1).
The mixers act as detectors that feed either, or both, the two spectrometers on HIFI. An instantaneous frequency coverage of 2.4 GHz is provided with the high frequency band 6 and 7 mixers, while for bands 1 to 5 a frequency range of 4 GHz is covered. The data is obtained as dual sideband data which means that each channel of the spectrometers reacts to two frequencies (separated by 4.8 to 16 GHz) of radiation at the same time. For many situations, this overlapping of frequencies is not a major problem and science signals are clearly distinguishable. However, particularly for complex sources containing a high density of emission/absorption lines, this could lead to problems with data interpretation. Deconvolution is therefore necessary for the data to create single sideband data. This is especially important for spectral scans covering large frequency ranges on sources with many lines. There are four spectrometers on board HIFI: two Wide-Band Acousto-Optical Spectrometers
(WBS) able to cover the full IF range available (4GHz) at a single resolution (1.1 MHz); and two High Resolution Autocorrelation Spectrometers (HRS) with several possible resolutions from 0.125 MHz to 1.00 MHz. One of each spectrometer type is available for each polarisation. They can be used either individually or in parallel. The Wide-Band Spectrometers cover the full intermediate frequency bandwidth of 2.4 GHz in the highest frequency bands (bands 6 and 7) and 4 GHz in all other bands. The High Resolution Spectrometers have variable resolution with sub-bands sampling up to half the 4 GHz intermediate frequency range. Sub-bands have the flexibility of being placed anywhere within the 4 GHz range. At the outset of the mission, the major scientific objectives of the HIFI instrument are:
• to probe the physics, kinematics, and energetics of star forming regions through their cooling
lines, including H2O;
• to survey the molecular inventory of the wide variety of regions that participate in the life-cycle
of stars and planets;
• to search for low-lying transitions of complex species and thus study the origin and evolution
of the molecular universe;
• to determine the out-gassing rate of comets through measurements of H2O and to study the
distribution of H2O in the giant planets;
• to measure the mass-loss history of stars which regulates stellar evolution after the main
sequence, and dominates the gas and dust mass balance of the Interstellar Medium;
• to measure the pressure of the interstellar gas throughout the Milky Way and resolve the
problem of the origin of the intense Galactic [CII] at 158 µm emission measured by COBE;
• to determine the distribution of the12C/13C and14N/15N ratios in the Milky Way and other
galaxies (to constrain the parameters of the Big Bang and explore the nuclear processes that enrich the ISM);
• to measure the far-infrared line spectra of nearby galaxies as templates for distant, possibly
primordial galaxies.
1.3.2
Atacama Large Millimeter Array
The Atacama Large Millimeter Array (ALMA) project is an international effort supported by the European ESO, the american NRAO and the Japanese NAOJ to build and operate a large millimetre and sub-millimetre array at high altitude in northern Chile. The ALMA array will be composed of up to 80 high-precision antennas, located on the Chajnantor plain of the Chilean Andes
km. Resolutions as fine as 0.005"" will be achieved at the highest frequencies, a factor of ten better than the Hubble Space Telescope. The first 12m antenna arrived in 2007; nine ALMA antennas are now on-site in Chile: four antennas from Mitsubishi Electric Co. (Melco) and five antennas from VertexRSI. Although data from the pathfinder APEX (Atacama Pathfinder EXperiment) are already available, the early science of the ALMA project is planned for 2010.
The Atacama Large Millimeter Array (ALMA) will be the forefront instrument for studying the cool universe - the relic radiation of the Big Bang, and the molecular gas and dust that constitute the very building blocks of stars, planetary systems, galaxies, and life itself.
The power of ALMA will enable new science in many areas, examples of which are highlighted below. The design of the instrument is being driven by three key science goals:
1. the ability to detect spectral line emission from CO or CII in a normal galaxy like the Milky Way at a redshift of z = 3, in less than 24 hours of observation;
2. the ability to image the gas kinematics in protostars and in protoplanetary disks around young Sun-like stars at a distance of 150 pc, enabling the study of their physical, chemical and magnetic field structures and to detect the tidal gaps created by planets undergoing formation in the disks;
3. the ability to provide images at an angular resolution of 0.01 arcsec, and precise images at an angular resolution of 0.1 arcsec. Here the term “precise image” means being able to represent, within the noise level, the sky brightness at all points where the brightness is greater than 0.1% of the peak image brightness.
These three goals drive the large collecting area, the spectral capabilities, and the number of elements of ALMA. This remarkable instrument will be able to:
• use the emission from CO to measure the redshift of star-forming galaxies throughout the
universe. The spacing between successive transitions of CO shrinks with redshift as (1 + z), and the large instantaneous total bandwidth of ALMA will make possible blind surveys in order to establish the star-forming history of the universe, without the uncertainties inherent in optical and UV studies caused by dust extinction;
• probe the cold dust and molecular gas in nearby galaxies, allowing detailed studies of the
interstellar medium in different galactic environments, the effect of the physical conditions on the local star formation history, and galactic structure;
• image the complex dynamics of the molecular gas at the centre of our own Galaxy with
unprecedented spatial resolution, thereby revealing the tidal, magnetic, and turbulent processes that make stellar birth and death at the Galactic Centre more extreme than in the local Solar neighbourhood;
• reveal the details of how stars form from the gravitational collapse of dense cores in molecular
clouds. The spatial resolution of ALMA will allow the accretion of cloud material onto an accretion disk to be imaged, and will trace the formation and evolution of disks and jets in young protostellar systems. For older protostars and pre-main sequence stars ALMA will show how planets form, sweeping gaps in circumstellar and debris disks;
• uncover the chemical composition of the molecular gas surrounding young stars, including
establishing the role of the freeze-out of gas-phase species onto grains, the re-release of these species back into the gas phase in the warm inner regions of circumstellar disks, and the sub-sequent formation of complex organic molecules. ALMA will have the large total bandwidth, high spectral resolution, and sensitivity needed to detect the myriad of lines associated with heavy, pre-biotic molecules such as those which may have been present in the young Solar System;
• image the formation of molecules and dust grains in the circumstellar shells and envelopes of
evolved stars, novae, and supernovae. ALMA will resolve the crucial isotopic and chemical gradients within these circumstellar shells, which reflect the chronology of the invisible stellar nuclear processing;
Many of these measurements will require new more-complete spectral data to match the high-sensitivity and large spectral coverage.
1.3.3
SOFIA
The Stratospheric Observatory For Infrared Astronomy, along with the Spitzer Space Tele-scope and HSO are the premier observatories for infrared and sub-millimeter astronomy in the US and Europe. SOFIA, a joint project of NASA and the German Space Agency (DLR), is a 2.5-meter telescope in a Boeing 747-SP aircraft designed to make sensitive infrared measurements of a wide range of astronomical objects. It will fly at and above 12.5 km, where the typical precipitable water column depth is less than 10 µm and where the telescope will collect radiation at wavelengths from 0.3 µm to 1.6 mm. The telescope is located in a open cavity in the aft section of the aircraft and has a view out of the port side of the aircraft. Observations are restricted to elevations between +20 and +60 degrees. The telescope is inertially stabilised and the pointing accuracy is expected to be better than 1 arcsec and tracking should be better than 0.5 arcsec. Because of the telescope motion
than 120 scientific flights of at least 8 to 10 hours in duration per year; it is expected to operate for at least 20 years.
The first generation of science instruments for SOFIA consists of 9 imagers and spectrographs span-ning the entire wavelength range. Except for one combination of instruments, only one science instrument will be flown at any given time. Science instruments will be changed at most only once every other week. In addition to these instruments, SOFIA will carry a water vapour monitor, which will report the precipitable water vapour level along a fixed line of sight. The resulting opacity values will be used to calibrate data acquired with the science instruments.
Of paricular relevance to the present thesis, the CAltech Submillimeter Interstellar Medium Investi-gations Receiver (CASIMIR) will be a sensitive submillimeter and far-infrared heterodyne receiver for SOFIA. The receiver will use sensitive superconducting mixers, including both tunnel junction (SIS) and hot electron bolometers (HEB). The local oscillators will be continuously tunable, and will consist of Gunn oscillators or HEMT power amplifiers followed by frequency multipliers. The goal of this instrument, still in development, is to cover the 500-2100 GHz frequency range in seven bands: SIS mixers in four bands up to 1200 GHz, and HEB mixers in three bands covering 1200-2100 GHz. Up to four of these frequency bands could be selected for use on a given flight; if necessary, the selection of frequency bands could be changed between flights. The HEB mixers will not be available at first light on SOFIA. The receiver will have an intermediate-frequency (IF) bandwidth of 4 GHz, which will be processed by a high resolution backend spectrometer (most likely an acousto-optic spectrometer with 1 MHz resolution), as well as a low resolution (30 MHz) analogue correlator. Offering both imaging and spectroscopy, SOFIA is designed to complement both large ground-based telescopes (e.g., Keck, Gemini, JCMT) and the current and future generation of space-based tele-scopes (Spitzer, Herschel, JWST). Many of the instruments used on SOFIA will be forerunners of those on board Herschel, and therefore SOFIA will be employed to prepare for, or follow up, Herschel observations. Since SOFIA’s 20 year lifetime is substantially longer than that of either Spitzer or Herschel, follow up studies with SOFIA will continue long after these satellite missions have ended. Topics to be addressed by SOFIA observations include the study of:
• interstellar cloud physics and star formation in our galaxy;
• proto-planetary disks and planet formation in nearby star systems; • origin and evolution of biogenic atoms, molecules, and solids;
• composition and structure of planetary atmospheres and rings, and comets; • star formation, dynamics, and chemical content of other galaxies;
• the dynamic activity in the centre of the Milky Way;
• ultra-luminous IR Galaxies (ULIRGS) as a key component of the early universe.
1.4
Importance of laboratory measurements
From what we have seen in the previous sections, the near future radioastronomy instru-ment will offer an incredible opportunity to unveil the physics and chemistry of the interstellar medium.
The Herschel Space Observatory, and specifically its HIFI instrument, will open for the first time a new window, above 1 THz for high-spectral-resolution measurements. Taking as example the Fig. 1.2, acquired with the Submillimeter Array, we can imagine what HIFI will able to do, consider-ing that the spectral resolution of the latter instrument will be up to 8 times more than the SMA [7]. This high resolution must be coupled with the available catalogue of the molecular species known or expected in the ISM. Looking at the databases, such as the Jet Propulsion Laboratory catalogue or University of Cologne database (see next chapter), two main points should be stressed. First of all, “high quality data”, meaning in our case data whose uncertainties are well below (ideally 10%) of the HIFI spectral resolutions, is still lacking for many species, especially in the region above 1 THz. Secondly, there is still quite a lack of laboratory data of complex organic molecules and hence, a corresponding low quality in predicted frequencies available on the databases for these species.
The ALMA array will cover a lower frequency range than HIFI but, it will be the most sensitive instrument in its operational wavelengths with a unique spatial resolution. This means that a great part of the signal that in the astrophysical spectra acquired with the present facilities (such as in Fig. 1.2) looks like noise but probably contains many lines below the detection-limit, will be resolved by the ALMA sensitivity. New lines could be associated to isotopic species, mainly deuter-ated and13C substituted, or rotational transitions of already known species, in excited vibrational
states. The identification of these lines will be necessary in order to search for the spectra of new and possibly exciting species such as more complicated organics or PAHs. Also, the incomparable spatial resolution of this array will make possible to spatially resolve regions of high molecular complexity, such as hot corinos (the inner regions surrounding Sun-like protostars, where the dust temperature exceeds 100 K). Again new spectral data will be required
such as the formyl ion (HCO+), Methane (CH
4) and Formic Acid (HCOOH). Then in chapter 7 the
analysis of the rotational spectra of a spectrally complex species Propane (CH3CH2CH3), including
excited torsional states, will be given. This type of species shows the affect of internal rotation that is common in many of the complex organic molecules that should be studied in order to prepare for new studies of star-forming regions involving for example the new instruments mentioned above.
Radio-Astronomy
The continuous growth of the number of detected species in the interstellar medium com-bined with the augmentation of the molecules studied in spectroscopy laboratories has led to the creation of several molecular databases to offer a direct link between the two different communities. First of all a brief review of the molecules detected in the interstellar medium (ISM) will be made. Then a description of two of the main molecular databases for radio-astronomy will be given: the database maintained by the Jet Propulsion Laboratory molecular spectroscopy group and the Uni-versity of Cologne database. Finally, our review of the information presented in these catalogues will be discussed.
2.1
Detected molecules in ISM
Since the first molecular spectra detected in the 1940s, observing electronic transitions of CH, CH+, and CN, many other species have been identified in the interstellar medium. As might as
expected, the number of known interstellar molecules is growing with the sensitivity and the spatial resolution of the instruments, that allow us to inspect localised regions and less intense molecular features. As of January 2008, there are more than 140 species listed as detected in the interstellar medium or circumstellar shells; the number of molecules detected in extragalactic sources is 36 plus 2 tentative detections (see CDMS web site).
Tables 2.1 and 2.2 list all the species detected in the interstellar and circumstellar media, as of January 2008. It’s worth noticing that there are some molecules whose detection is weakly proved and still an sargument of discussion. In particular, two molecules have been reported as detected whose
detection has been questioned fairly convincingly in subsequent papers. These species, not reported in these tables, are aminoacetic acid (aka glycine), H2N CH2COOH, and 1,3-dihydroxypropanone,
(CH2OH)2CO, (aka dihydroxyacetone).
The detection of the former molecule was reported by [8], who claimed a large number of positively identified lines in SgrB2(N-LMH), Orion KL and W51 e1/e2. However successive papers brought to the attention of the scientific community that there seems to be some inconsistencies in the intensities of the lines. In particular, some of the observed lines seem to be too weak by a substantial amount that seems to be incompatible with the derived abundances and rotational temperatures; this casts doubt on these abundances and on the interstellar detection (see Snyder et al.[9]).
In 2005, there was a report on the detection of 1,3-dihydroxypropanone in SgrB2(N-LMH) by Widicus Weaver & Blake [10], in which the column density derived was very high, about a factor three higher than that of formaldehyde. However a more recent paper by Apponi et al. [11] seriously questions the findings. In this work, no line was identified unambiguously and the upper limit derived for 1,3-dihydroxypropanone was lower than the column density derived above by a factor of about 300. Recently the Harvard group led by McCarthy detected the first anion in the ISM. First, in 2006, two rotational transitions, J = 4 − 3 and J = 5 − 4 of the hexatriynylide ion, C6H−,
were observed in the interstellar cloud TMC-1 [12]. Just few months later, the butadiynylide ion, C4H−, was detected by Chernicharo et al. [13] toward IRC+10216 in five rotational transitions from
J = 9− 8 to J = 15 − 14 which occur in the 3 and 2 mm regions. The third negative ion detected
was octatetraynylide, C8H−, observed toward TMC-1 in four rotational transitions between 24 and
16 mm by Br¨unken et al. [14] and almost simultaneously by Remjian et al. [15] in observations toward the carbon rich star IRC+10216 in five rotational transitions at 12 and 7 mm.
As might be expected the number of molecules detected in the extragalactic sources, table 2.3, is much less than in our galaxy. Extragalactic molecular spectroscopy was until a few years ago limited to selecting the strongest features seen in the Galactic centre and disk and looking for them toward well selected extragalactic targets. Recently a couple of works have reported extragalactic spectral surveys largely increasing our knowledge of the central region of sturburst galaxies. The first census of the molecular content of an external galaxy was reported by Wang et al. [16], who observed 19 molecular species toward NGC 4945, using the Swedish-ESO Submillimetre Telescope (SEST). The first unbiased molecular line survey toward an extragalactic source, namely the central region of NGC 253, was performed by Mart´ın et al. [17], identifying 111 spectral features as transitions from 25 different molecular species with observations at the 30m IRAM telescope, between 2001 and 2004. The latest species detected in extragalactic regions is the ion H3O+, observed by van der
Tak et al. [18]; observations of the 364 GHz line of p − H3O+ were carried out towards the centres
of M82 and Arp 220, using the James Clerk Maxwell Telescope (JCMT). The main limitations to extragalactic spectroscopy has so far been sensitivity, a weak point that the scientific community
H2 C3∗ c-C3H C5∗ C5H C6H AlF C2H l-C3H C4H l-H2C4 CH2CHCN AlCl C2O C3N C4Si C2H4∗ CH3C2H C2* C2S C3O l-C3H2 CH3CN HC5N CH CH2 C3S c-C3H2 CH3NC CH3CHO CH+ HCN C 2H2∗ H2CCN CH3OH CH3NH2 CN HCO NH3 CH4∗ CH3SH c-C2H4O CO HCO+ HCCN HC 3N HC3NH+ H2CCHOH CO+ HCS+ HCNH+ HC 2NC HC2CHO C6H−
CP HOC+ HNCO HCOOH NH
2CHO SiC H2O HNCS H2CNH C5N HCl H2S HOCO+ H2C2O l-HC4H*? KCl HNC H2CO H2NCN l-HC4N NH HNO H2CN HNC3 c-H2C3O NO MgCN H2CS SiH4∗ H2CCNH? NS MgNC H3O+ H2COH+ NaCl N2H+ c-SiC3 C4H OH N2O CH3∗ PN NaCN SO OCS SO+ SO 2 SiN c-SiC2 SiO CO2∗ SiS NH2 CS H+ 3∗ HF H2D+, HD+2 SH* SiCN HD AlNC FeO? SiNC O2 HCP CF+ SiH? PO
Table 2.1: From CDMS, molecules in the interstellar medium or circumstellar shells, as of 01/2008. Molecules with 2-7 atoms. All the species have been detected through their pure rotational spectra. The asterisked species have been detected by their rovibration or electronic (C2, CH and CH+) spectrum. Probable and questionable detections are labelled with a question mark.
8 atoms 9 atoms 10 atoms 11 atoms 12 atoms 13 atoms CH3C3N CH3C4H CH3C5N HC9N C6H6*? HC11N HC(O)OCH3 CH3CH2CN (CH3)2CO CH3C6H C2H5OCH3? CH3COOH (CH3)2O (CH2OH)2 C7H CH3CH2OH CH3CH2CHO H2C6 HC7N CH2OHCHO C8H l-HC6H*? CH3C(O)NH2 CH2CHCHO? C8H− CH2CCHCN C3H6 H2NCH2CN
Table 2.2: From CDMS, molecules in the interstellar medium or circumstellar shells, as of 01/2008. Molecules with 8-13 atoms. All the species, except the asterisked ones, have been detected through their pure rotational spectra. Probable and questionable detections are labelled with question mark.
hope to resolve with near future radio astronomy projects, such as the Herschel Space Observatory, the ALMA array and the SOFIA project.
2.2
Main web databases for radio-astronomy
During the past years, web interface molecular databases have been created. Looking at the growing number of species detected in the interstellar and extragalactic medium it’s become crucial to have a link between the astronomical and the spectroscopy laboratory spectroscopy communities. An important incentive to create this link has been that the relevant laboratory data is scattered over many journals and very many issues. Among the databases listing microwave and THz data we want to focus our attention in this section to two of the main ones, largely used by the radio astronomical community. One of the keys of the successes of these two databases, other than their continuous update, is the homogeneity in the format used.
2.2.1
Jet Propulsion Laboratory database
The line catalogue maintained by the microwave molecular spectroscopy group of the Jet Propulsion Laboratory (hereafter JPL) dates back to 1985 [19], when its first version offered a computer catalogue of submillimetre, millimetre, and microwave spectral lines up to 10 THz. Since then the spirit of this database has been to offer an interface, nowadays in a Web-based version1,
based on the present and projected needs of both astronomers and atmospheric scientists [20]. The catalogue gives predictions resulting from least-squares fits of measured spectral lines, mostly
CS HNC HOCO CH+* N 2H+ C3H CN OCS H3O+ SO HCO SiO H2S CO+? SO 2 NO HOC+ NS C2S
Table 2.3: From CDMS, molecules detected in extragalactic regions, as of 01/2008. All the species, except the asterisked ones, have been detected through their pure rotational spectra. Probable and questionable detections are labelled with question mark.
obtained from the literature. For each species documentation is available in printed form as a JPL publication [21] and also on the catalogue Web site. This provides the intensity and frequency limit in the catalogue, partition functions at representative temperatures, assumed dipole moments, literature citations for the experimental lines, and a brief description of the nature of the Hamiltonian model used in the calculation. The catalogue files are composed of 80-character lines, with one line entry per spectral transition giving the quantum numbers, the centre-frequency in MHz and the assumed uncertainty. The intensity for each transition is also reported in units of nm2M Hz, based
on the integral of the absorption cross-section over the spectral line shape. The value of the intensity is calculated for 300K and is obtained from:
Iba(T ) = ! 8π3 3hc " νba(Sbai µ2i)[e−E !!/kT − e−E!/kT] 1 Qrs (2.1) where νba is the line frequency, E""and E" are the lower and upper state energies, respectively, Qrs is the rotation-spin partition function (using the same zero of energy as E""and E"), Si
bais the line strength and µi is the dipole moment along the molecular axis i.
In general, where not explicitly stated in the documentation, no vibrational partition func-tions is included for the intensity calculation.
Other useful information are listed in the catalogue such as the partition function, the lower state energy in cm−1 relative to the lowest energy spin-rotation level in the ground vibronic state, the upper state degeneracy, an identifier tag of the species and a code allowing the quantum numbers to be identified. The tag consists of six digits; the first three represent the mass number of the molecule and the last three are an identification number for the given mass (see section 2.3). For a detailed description of the quantum number format used in the catalogue see the next chapter. There is also
a directory file which lists each species by name and tag and gives the total number of lines for that species, the version number of the catalogue file and the base 10 logarithm of the partition function for temperatures of 300, 225, 150, 75, 37.5, 18.75, and 9.375K, respectively. The total number of species listed in this catalogue, is continuously increasing and is 365 as of August 2008.
2.2.2
The Cologne Database for Molecular Spectroscopy
While the JPL catalogue is suited for different purposes, from astronomy to atmospherical and planetary science, the Cologne Database for Molecular Spectroscopy2 (hereafter CDMS) is
devoted principally to radioastronomy. The first version of this database dates back to 2001 [22] with 111 species listed; currently (February 2008) the total number is 447. The entries of the catalogue are not restricted to species already observed in the ISM and circumstellar medium (CSM), but also include molecules that may be found in the future. Therefore the database can be, and has been used to identify new molecules in space.
The format of the catalogue entries is identical to JPL. For each entry a list of transitions in MHz or in cm−1with related uncertainties is available. A documentation file for each species gives information about the chemical formula, minor isotopologues, excited vibrational states, version number and the person responsible for creating the entry. Furthermore it lists sources of the experimental data, consideration for spin-statistics, fine and hyperfine structure, partition function, and molecular properties, such as rotational constants and dipole moment component values. It’s worth noticing that for each species whether it has been observed in the ISM or CSM or in extragalactic regions is reported. All the information relating to astronomical observations are listed in a single web page that summarises all the species detected in the ISM, CSM and extragalactic regions, from which tables 2.1, 2.2, and 2.3 are derived. References to the relative astronomical publications can be found by a link on this page especially for the most recently detected species.
In view of the radio-astronomical purpose of the catalogue, each isotopologue and each vibrational state is given as a separate entry, even if they have been treated together in the fit to make the predictions. However, for diatomic species, excited vibrational states are given together with the ground vibrational state as long as these excited states are relevant for astronomical observations. For the same reason, when fine or hyperfine splitting is of relevance for astronomical observations only for a number of the transitions listed, most commonly the general entry does not include this splitting: but separate files are available that contain this information for a selected quantum number or frequency range.
Among these, one of the most used is the database of Frank Lovas at the National Institute of Standards (NIST, USA). This Web based database3 provides the rest frequencies for observed
in-terstellar molecular microwave transitions, along with uncertainties and references to astronomical and laboratory publications of each transition.
The Splatalogue catalogue4is a transition-resolved compilation of the JPL, CDMS and Lovas/NIST
lists containing 865 chemical species. This is a molecular spectroscopy database developed at the National Radio Astronomy Observatory (NRAO, USA), whose main goal is supporting the ALMA Working Group on spectral line frequencies.
The Leiden Atomic and Molecular Database5 (LAMDA) is the catalogue maintained by the van
Dishoeck group at the University of Leiden (The Netherlands). The aim of this project is to provide users of radiative transfer codes with the basic atomic and molecular data needed for the excitation calculations. Line data of a number of astrophysically interesting species are summarised, including energy levels, statistical weights, Einstein A-coefficients and collisional rate coefficients. Currently the database contains atomic data for 3 species and molecular data for 24 different species. In addition, several isotopologues including deuterated species are available.
The BASECOL6database is devoted to collisional ro-vibrational excitation of molecules by colliders
such as atoms, ions, molecules or electrons. It is supervised by an international working group of molecular physicists and astrophysicists involved in the calculations and use of rovibrational cross-sections, and maintained by Marie-Lise Doubernet at the Paris-Meudon Observatory.
2.3
Summary of web databases
Chronologically, the very beginning of my thesis work was devoted to creating a summary of spectral data available for radioastronomy, with the clear idea to define priorities for new mea-surements and analyses. For this purpose we created a table in which we have listed all the species detected in the interstellar and extragalactic media and reported by the JPL or the CDMS web
3http://physics.nist.gov/cgi-bin/micro/table5/start.pl 4http://www.splatalogue.net/
5http://www.strw.leidenuniv.nl/ moldata/ 6http://basecol.obspm.fr/
catalogue. We also included a few other potentially detectable species and (whether detected or not) isotopologues and vibrationally excited states of detected species.
The full version of this table can be found on the CESR CASSIS Web page7. Another important
goal of this work is to give to the astronomical community a “suggested” database for each species of interest. Equally the spectroscopic community can use this table to have a first and rapid idea of the quality and availability of laboratory data for specific species. Compiling this table we have chosen for each entry a specific databse for reference. This choice is mostly based on two criteria which are in general correlated
The first criterion is the date of the last measurements, or analysis when different. This choice takes into account the advancement in laboratory techniques and the consequential improve-ment in the measureimprove-ment accuracies.
The second criterion is the extent of the frequency and quantum number range of the measurements used. It will be shown in the next chapters how an extrapolation based on low frequency data must be treated carefully in order to avoid bad assignments in astrophysical spectra. Moreover, while interpolations (within existing frequency and quantum number ranges) are generally reliable, extrapolation should always be viewed with some caution; this is especially true if the input data set is small, if the Hamiltonian converges slowly (e.g. for light hydride species), or for species with large amplitude motions or with vibration-rotation interactions. Exceptionally other criteria such as giving hyperfine structure or including more vibrational states etc. may be used in the choice of database. In just a few cases both databases are cited since each has an advantage to be chosen according to the astrophysical measurements to be taken.
In the present version the table is composed of 29 columns that we will now describe in detail.
1. The species are first sorted by their number of atoms, column # in the table, from the simplest diatomics, up to the most complex molecules so far detected composed of 13 atoms (and one entry for HC13N potentially detectable).
2. The second column gives the species tag. The code is the same as that used by the databases themselves, that is a six-digit number wwwxyz, in which the first three digits www indicate the molecular weight in atomic mass units, the fourth digit x identifies the database (0 for JPL and 5 for CDMS), and the last two digits yz are used to separately identify species with the same molecular weight. Charlotte Vastel (CESR) has created a database based on entries in JPL and CDMS in which she separates ortho and para species of the same molecule, in this case entries are denoted respectively by y = 9 and y = 8.
(b) ∗∗ Ortho and para species are treated separately;
(c) ∗ ∗ ∗ The first transition of the species is about 1 THz or higher; (d) ! For these molecules predictions may have substantial uncertainties; (e) ? Where the detection is not sure yet;
4. The next three columns give the minimum measured, the maximum measured and the maximum predicted frequency in MHz. As previously stated this information is among the most relevant in this table, giving a first idea of the validity of the data for a specific molecule. As a rule of thumb, when a predicted frequency is far higher than the maximum measured one, it must be treated carefully.
5. Information concerning the measured quantum numbers can be found in the next four columns. The lowest and highest measured principal quantum number J (or N) is given, and the same information for its projection along the symmetry axis K (or Kafor asymmetric tops). The remarks concerning the validity of frequency extrapolations concern also predictions extrapolated far from the quantum number range measured.
6. The year of the last measurement of the species is reported in the next column. When this year does not coincide with the latest analysis performed by the database managers the latter is also listed in brackets.
7. The database chosen is given in the next column. This could be improved in the near future with a direct link to the appropriate Web page for the species considered.
8. In the next column the energy, in units of cm−1, is reported for the lowest vibrational level of the molecule. This gives some idea on the probability of finding this state in the cold interstellar medium.
9. A brief summary of the spectroscopy and astrophysics notes given later is given in the next column.
10. The next column gives the quantum number format (QNF) used by the databases, which indicates the choice of the quantum numbers used to define the transitions. A description of the QNF will be given in the next chapter.
11. Two columns give additional astrophysical and spectroscopical information. In the former can be found details about astrophysical detection and associated references. The latter gives details concerning the quality of the laboratory data, specificities such as fine or hyperfine structure and details of the analysis that are mostly resumed from information given on the database Webpages. Additional information may also be given, particularly concerning work that is not yet included in the databases. This information may later be included in the CASSIS package as part of the online help.
12. The species name is given in the next column of the table.
13. The next eleven columns are checkboxes for regions where the molecule has been identified in space.
The whole table can be downloaded directly from the link given. As can be seen, the table is quite large and hence just a brief extract is given here (Fig. 2.1). Due to new astrophysical detections, new database entries (several per month proving the amount of ongoing spectroscopy work), and a time-consuming process to improve and extend the information given; the table is updated approximately once every six months.
# TAG MOLECULE Min.Meas. (MHz) Max Meas. (MHz) Max Pred. (MHz) J Max meas. (or N) J Min meas. (or N) Last M. (entry)
Database
Lowest v level cm-1
Extra info spectro
Extra info astro
2 31507 CF+ v = 0,1 205170.4490 410304.7810 3857077.1182 4 1 1990 (2005) CDMS 1766.36?
Predictions should be viewed with caution above 1 THz. The excited state predictions should be viewed with caution throughout. The partition function takes into account both vibrational states. Detection toward the PDR Orion-Bar was reported by D. A. Neufeld et al. Discovery of Interstellar CF+ Astron. Astrophys. 454, L37–L40 (2006).
2 42505 SiN 87045.3570 741702.6260 1779777.0401 17 1 2006 CDMS 1138.4
The prediction contains 14N hyperfine splitting throughout even though it will be negligible in the submillimeter region. Calculations of frequencies with predicted uncertzainties much larger than 100 kHz should be viewed with some caution. The dipole moment is ab initio. IRC+10216, Sgr B2(M), L15-L18 see CDMS 2 47006 PO 64973.9510 980644.0000 2630371.2929 1983 (1997) JPL
The dipole is unknown so a unit dipole (1.0 Debye) was used in the calculations. See other notes on JPL. Oxygen rich circumstellar envelope VY Canis Majoris
2 61506 29SiS v=0 a 2 53463.3480 888189.9940 2579245.2911 50 2 2007 CDMS
Rotational transitions including those in vibrationally excited states
IRC+10216 see CDMS 3 4501 H2 D + ** 155987.1850 1370146.0000 17321556.4842 3 0 2005 CDMS 2206.3
Except on 4 lines measured. Ortho and para should be treated separately at low T; available through links in the documentation file. First detection by Stark et al. 1999. 372 GHz ortho recently measured by Caselli et al. A&A Lett in prestellar core L1544. Tracer of massive very cold cores?
3 29506 N2 H + (v = 0) * 93173.4035 745209.8680 3978512.1958 8 0 2005 (2006) CDMS
Superflouous entry for JPL removed from table. A separate hyperfine (14N) calculation is provided for J"
! 4. See notes on info page concerning
partition function and sextic distorsion constants.
P. Caselli, P. C. Myers, and P. Thaddeus, 1995, Astrophys. J. 455, L77.
3 30002 H 13CO + 86754.2884 1127120.8128 3450112.8615 13 0 2007 JPL
Both JPL and CDMS (30504) incoporate the most recent data of V. Lattanzi, A. Walters, B. J. Drouin and J.C. Pearson, 2007, Astrophys. J. 662. For the hyperfine structure at low J see CDMS webpage. (1) E. M. Gregersen and N. J. Evans II, 2001, Astrophys. J., 553, 1042. (2) J. Schmid-Burgk, D. Muders, H. S. P. Müller, and B. Brupbacher- Gatehouse; 2004, Astron. Astrophys., 419 949.
3 30509 N2 D + * 77109.2581 693806.1560 3824865.5487 9 0 2004 (2006) CDMS
A separate hyperfine (14N) calculation is provided for J"
! 4. The deuterium hyperfine splitting is
unlikely to be resolved. The dipole moment was assumed to be the same as that of the main isotopomer L. Dore, P. Caselli, S. Beninati, T. Bourke, P. C. Myers, and G. Cazzoli, 2004, Astron. Astrophys. 413, 1177.
4 18501 NH 2 D 7561.9200 854515.3000 10139983.9143 0 20 2004 CDMS
Ortho and para should be treated separately at low T ; available through links in the documentation file. Sgr B2, Orion KL and Orion Nebula see CDMS
4 19503 H3 O + 307192.4100 396272.4120 9985382.6446 3 1 1999 (2007) CDMS
New analysis also considers FIR laser sideband measurements and gs combination differences. See other notes on CDMS website. Orion KL, OMC-1, Sgr B2, hot core sources, Orion BN–IRc2?: see CDMS
experimental and analytical tools
After the description of the motivations and the general principles of our research work, a specific description of data acquisition and analysis will now be given. The general idea followed for all the species analysed is summarised in Fig. 3.1.
First of all a detailed study of what is already known about the species is carried out, making use of all the available information in the literature. This step is crucial in order to have a full idea of what has already been done and to make a first prediction of the spectrum in the region selected for the following measurements. A comprehensive analysis of previous work is also useful to have the first constraints on the experimental setup to be used to have the best signal, especially when the species to be analysed is reactive and needs to be created in-situ (see for example next chapter). Once the experimental details have been defined data acquisition is carried out, making use of hardware and software developed by the JPL spectroscopy laboratory. The custom-designed software allows a real-time knowledge of the acquiring spectrum as it is acquired so that small adjustments of experimental conditions can be made to continuously optimise the signal.
The resulting spectra are stored in files easily readable by the SubMillimetre Analysis Program (SMAP), also developed by the laboratory. A file with all the transitions assigned is then created and analysed with the SPFIT program [23]. Subsequently new predictions may be made with SPCAT to measure in other frequency regions. Finally a new catalogue entry for the species is made in the JPL database.
In the following sections an overview of the experimental setup and the analysis software will be given.
Study of the species
Measurements
Data Acquisition
SMAP SPFIT / SPCAT
Experimental setup
developed in this laboratory ([24], [25]). The setup is composed of a computer controlled commer-cial synthesiser and millimetre-wave module driving a series of amplifiers followed by a series of wide-bandwidth frequency doublers and triplers. In fact, this laboratory spectrometer is based on the general approach adopted for the local oscillator for the Herschel Space Observatory (HSO), utilising a number of technologies developed for the Heterodyne Instrument for the Far Infrared on the HSO and for the Atacama Large Millimeter Array. The technology is essentially based on planar GaAs Schottky barrier varactor diodes as frequency multipliers (see multiple references in Drouin et al. [24]) and broadband monolithic millimetre-wave power amplifiers [26]. A schematic plot of the spectrometer is shown in Fig. 3.2
Figure 3.2: Block diagram of the frequency multiplied submillimetre spectrometer [24].
3.1.1
Sources and input electronics
The radiation source of the spectrometer is a sweep synthesiser source connected to a high-quality external reference signal. The synthesiser (Hewlett Packard 8340b) is computer controlled through a standard general purpose interface bus (GPIB) and is used in phase-locked continuous-wave mode for all measurements. The general requirement for high-sensitivity absorption measure-ments is that the sweep synthesiser has a low phase-noise output and no RF blanking when stepping. The 5 MHz standard available at JPL locks the sweep synthesiser to 1:1011.
at-Device Multiplier Range (THz) Maximum Power (µW) Typical Power (µW) Harmonic content AMC-15 4 0.05-0.07 4000 2000 <-30 dB AMC-10 6 0.07-0.11 3000 1000 <-30 dB Agilent 83558A 6 0.07-0.12 2000 1000 <-30 dB MUT-05 3 0.14-0.22 400 50 <-30 dB MUT-04 3 0.18-0.27 120 40 <-30 dB VDI 1.9×5 5 0.40-0.60 40 10 -20 dB ×6, ×7 VDI 1.5×6 6 0.60-0.75 100 30 -20 dB ×4 VDI 1.2×5 10 0.77-0.85 50 10 <-30 dB JPL ×2×2×2 8 0.70-0.83 800 50 . . . JPL ×2×2×3 12 0.84-0.95 400 50 -23 dB ×8 JPL ×2×2×3 12 1.05-1.28 100 30 -26 dB ×16 JPL ×2×3×3 18 1.55-1.65 12 4 . . .
Table 3.1: Multiplier chains used in the JPL spectrometer [24].
tached at the output of the source RF, is swept simultaneously with the sweep synthesiser. This notch filter suppresses signals more than 50 MHz from the selected 11–18 GHz RF by more than 35 dB. Two types of commercial frequency sextuplers are utilised to reach 0.07–0.12 THz, the Agilent 83558A or the Millitech AMC–10. Since these modules produce only a few mW, amplification of the millimetre wavelength radiation is absolutely critical to create sufficient drive power for cascaded multipliers. Monolithic microwave integrated circuit amplifiers (MMIC) utilising a 0.1 µm gate GaAs process for 0.060–0.120 THz or a 0.1 µm gate InP process are utilised. Two to four cascaded doublers or triplers follow the power amplifiers and generate the submillimetre wavelength radiation; these are dc biased with an Agilent E3610 power supply connected to the bias input through an ampere meter and a two-step RC protective circuit. All multipliers are disconnected from the bias supplies during power on operations and connected or disconnected only with the power supplies set to 0V. All rack devices and power supplies are filters, surge protected, and battery supported with an uninterruptible power supply. Overvoltage and electrostatic damage to the multiplier circuitry is minimised with this equipment. The amplifier gates and drains are also biased with E3610 supplies using the same procedure. Multiplier bias is applied before amplifier bias prior to application of RF at turn on. In this way there is no possibility for RF-induced self-bias with no dc applied. Negative current from a self-biased circuit, depending on frequency and power input, can cause irreversible damage to the multiplier diodes. Turn off is the reverse sequence.
Frequency measurements from 50 to 850 GHz are made utilising commercial multiplier chains from Millitech, Agilent and Virginia Diodes (VDI). The frequency ranges, power characteristics and known harmonic contents of these and the JPL-built devices are listed in table 3.1.
In this arrangement two or three GaAs millimetre wavelength amplifiers produce 40–120 mW; at 400–600 GHz a quintupler (VDI 1.9×5) produces 10–40 µW; at 600–750 GHz a doubler


![Figure 4.7: Residual analysis for HCO + ground state data as in Tinti et al. [77].](https://thumb-eu.123doks.com/thumbv2/123doknet/2144215.8982/75.892.207.791.423.759/figure-residual-analysis-hco-ground-state-data-tinti.webp)


