HAL Id: hal-00940299
https://hal.inria.fr/hal-00940299
Submitted on 2 Feb 2016
HAL is a multi-disciplinary open access
archive for the deposit and dissemination of
sci-entific research documents, whether they are
pub-lished or not. The documents may come from
teaching and research institutions in France or
abroad, or from public or private research centers.
L’archive ouverte pluridisciplinaire HAL, est
destinée au dépôt et à la diffusion de documents
scientifiques de niveau recherche, publiés ou non,
émanant des établissements d’enseignement et de
recherche français ou étrangers, des laboratoires
publics ou privés.
SLA-based Profit Optimization in Cloud Bursting PaaS
Djawida Dib, Nikos Parlavantzas, Christine Morin
To cite this version:
Djawida Dib, Nikos Parlavantzas, Christine Morin. SLA-based Profit Optimization in Cloud Bursting
PaaS. 14th IEEE/ACM International Symposium on Cluster, Cloud and Grid Computing, May 2014,
Chicago, United States. �hal-00940299�
SLA-based Profit Optimization in Cloud Bursting PaaS
Djawida Dib1, Nikos Parlavantzas2, Christine Morin1 1Inria -2INSA, Campus de Beaulieu, 35042 Rennes cedex, France
Email:{Djawida.Dib, Nikos.Parlavantzas, Christine.Morin}@inria.fr
Abstract—PaaS (Platform as a service) is an increasingly popular cloud model, providing a complete development and hosting environment for cloud applications. As the use of PaaS becomes pervasive, defining and maintaining SLAs (Service Level Agreements) between PaaS customers and providers becomes essential. Useful SLAs should provide guarantees on application quality properties (e.g., response time) rather than on resource availability (e.g., number of virtual machines). Current PaaS offerings either provide no support for providing such guarantees or provide support targeting a restricted set of application types. In this paper, we propose an SLA-driven PaaS architecture, called Meryn, which supports cloud bursting and is designed to be easily extensible to host new application types. Meryn relies on a decentralized optimization policy that aims at maximizing the overall provider profit, taking into account the payment of penalties incurred when quality guarantees are unsatisfied. We implemented and evaluated a prototype of the Meryn system through a series of simulations on the Grid5000 testbed.The results show that our approach provides up to 14.77% more profit for the provider and uses up to 80.99% less public clouds resources compared with a basic approach.
Keywords-Platform as a Service (PaaS); Service Level Agree-ment (SLA); Profit Optimization; Cloud Bursting
I. INTRODUCTION
PaaS (Platform as a service) is an increasingly popular cloud model that delivers a complete development and hosting environment for cloud applications (e.g., [1]-[15]). This environment typically builds on virtualized resources owned by the PaaS provider or leased from public clouds on demand. PaaS customers deploy their applications in this environment while being completely shielded from manag-ing the underlymanag-ing resources, drastically reducmanag-ing application management costs.
With the increasing use of PaaS, defining and maintaining SLAs (Service Level Agreements) between PaaS customers and providers becomes essential. In its most basic form, an SLA is a contract that specifies the service guarantees expected by the customers, the payment to the provider, and potential penalties when the guarantees are not met. A main limitation of current PaaS offerings is that the provided guar-antees are based exclusively on resource availability (e.g., number of virtual machines, memory size), rather than on application QoS properties (e.g., response time, throughput), which are more meaningful and useful to customers. As a result, it becomes the responsibility of PaaS customers to
ensure QoS properties for their applications, which limits the value of PaaS systems.
Two main challenges arise in developing PaaS systems that manage the QoS properties of their hosted applica-tions. First, the system should efficiently use private and public resources, avoiding penalties due to unsatisfied QoS guarantees, and maximizing provider profit. To address this challenge, the PaaS requires an automated resource management solution that dynamically distributes resources among customers applications, taking into account the SLAs and adapting to changing workloads and resource prices. Second, the system should support extensibility with regard to programming frameworks. Indeed, a great variety of programming frameworks have proven to be widely useful and are currently part of PaaS offerings, including web appli-cation frameworks, MapReduce, batch frameworks, and task farming frameworks. To address this challenge, the resource management solution should impose limited modifications to existing programming frameworks, allowing them to take most of the resource management decisions regarding their hosted applications.
This paper focus on the design of a cloud bursting PaaS system architecture, called Meryn, that supports optimizing the provider profit while being extensible with respect to programming frameworks. The architecture relies on a de-centralized scheme to control the dynamic distribution of private resources among programming frameworks and to manage bursting to public clouds, when necessary. The paper also present a profit optimization policy that aims at maxi-mizing the overall provider profit while taking into account the payment of penalties, if SLAs are unsatisfied. The policy optimizes the use of private resources, particularly in peak periods, before renting any public cloud resources. The opti-mization policy is guided by the SLAs of hosted applications and resource prices. We implemented a prototype of our approach and demonstrated its effectiveness in optimizing the provider profit through a series of simulations. The results show that our approach provides up to 14.77% more profit for the provider and uses up to 80.99% less public cloud resources compared with a basic approach.
The remainder of the paper is organized as follows. In section II we discuss the related work in the field. In section III we present our cloud bursting PaaS architecture, and in section IV we present our profit optimization policy. In section V we investigate the example of computation
appli-cations. We present and evaluate our prototype in section VI. Finally we conclude in section VII.
II. RELATEDWORK
There is a growing number of commercial [1][2][3][4][5] and open source [6][7][8][9][10] PaaS systems as well as research PaaS platforms proposed in the literature [11][12][13][14][15]. However, few of them support appli-cation hosting on multiple IaaS clouds [11][6][7][3][4], and those who support it do not provide policies to automatically select resources from a set of IaaS clouds. Furthermore, none of the aforementioned systems provide a policy for optimizing the provider profit.
There is significant work focused on such optimization problems. In [16] the authors focus on time and cost sensitive execution for data-intensive applications executed in a hybrid cloud. They consider two different modes of execution: (1) Cost constraint-driven execution, where they minimize the time of execution while staying below a user-specified cost constraint, and (2) Time constraint-driven execution, where they minimize the cost while completing the execution within a user-specified deadline. They propose a model based on a feedback mechanism in which compute nodes regularly report their performance to a centralized resource allocation subsystem, and the resources are dynam-ically provisioned according to the user constraints.
In [17] the authors propose a decentralized economic approach for dynamically adapting the cloud resources of composite web service applications, so as to meet their SLA performance and availability goals in the presence of varying loads or failures. Their approach consists of checking and adapting the placement and the number of replicas of ap-plication components for minimizing the operational cost of the application. The application components act as individual optimizers and autonomously replicate, migrate across VMs or terminate based on their economic fitness.
In [18] the authors consider the SLA-based resource allocation problem for multi-tier applications in cloud com-puting. Their objective is to optimize the total profit from the SLA contracts, reduced by the operational cost. A solution is proposed based on providing an upper bound on the total profit and applying an algorithm based on force-directed search.
In [19] the authors propose a resource allocation algorithm for SaaS (Software as a Service) providers to minimize infrastructure cost and SLA violations. To achieve this goal, they propose mapping and scheduling mechanisms to deal with the customer-side dynamic demands and resource-level heterogeneity. The mechanisms minimize the cost by optimizing the resource allocation within a VM, and thus allowing a cost-effective use of resources.
Similarly to the above works our profit optimization solution is performed under SLA constraints. However, our solution is unique in the following aspects:
• It manages resources in a decentralized way with al-most no modification in the resource allocation policies of existing programming frameworks. Thus, the PaaS system may be easily extended with new frameworks.
• It relies on a general model of a cloud bursting PaaS environment, not targeting a specific type of applica-tions.
• It optimizes the PaaS provider profit through estimating
the cost of different options for hosting applications and considering the payment of penalties, if SLAs are unsatisfied.
III. ARCHITECTURE
Our cloud bursting PaaS architecture, called Meryn [20], relies on private and public cloud resources. The private resources are virtualized and shared between multiple elastic Virtual Clusters (VCs). We define a VC as a set of VMs running on private resources plus possibly some VMs rented from public IaaS clouds. Each VC is associated with a spe-cific application type, and is managed using a corresponding programming framework. For example, it is possible to use the Oracle Grid Engine (OGE) framework to manage a VC that hosts batch applications, and the Hadoop framework to manage a VC that hosts MapReduce applications. Note that for each programming framework we create a customized VM disk image with the suitable software stack for the creation of VMs of the corresponding VC.
Each VC has an initial amount of resources obtained through a fair sharing of private resources or according to past usage traces. Then, according to specific policies VCs may exchange the private resources among each other. The overall resource management is fully decentralized where each VC autonomously manages its own resources and decides when to burst into public cloud resources. The final users submit their applications through a common and uniform interface, whatever the type of their applications.
The main components of the Meryn system, shown in Figure 1, are a Client Manager, a Cluster Manager for each VC, an Application Controller for each hosted application and a Resource Manager.
Client Manager: Provides users with a uniform submis-sion interface, and is responsible for receiving submissubmis-sion requests and transferring them to the corresponding Cluster Manager. It also enables users to get the results of their applications.
Cluster Manager:Consists of two parts, a generic part and a framework-specific part. The generic part is the same for all Cluster Managers and consists in managing resources, deciding when to release or acquire resources to or from the other VCs, and also deciding when to rent additional resources from public clouds. The framework-specific part depends on the hosted type of applications as well as the framework. This part makes no change to the framework
Private resources Public resources VM manager
Resource Manager
Cluster Manager Cluster Manager
Client Manager VC. a VC. b Private VM Public VM Users Add/Remove private VMs Add/Remove public VMs SLA negotiation Submission Results VMs exchange Request transmitting App. 1 App. 2 App. 1 Controller App. 2 Controller App. 3 App. 4 App. 3 Controller App. 4 Controller
Figure 1. Architecture of Cloud Bursting PaaS System
but is adapted to its interface for translating the users sub-mission requests format to another format compatible with the framework. This part is also responsible for proposing SLAs and negotiating them with the users.
Application Controller: Is responsible for monitoring the execution progress of its associated application and the satisfaction of its agreed SLA. This component is mainly based on mechanisms provided by the framework.
Resource Manager:Provides support functions to initially deploy the system and to transfer VMs from one VC to another one. The Resource Manager interacts with a VM manager software, such as Nimbus [21], OpenNebula [22] or Snooze [23].
The application submission process starts when the user contacts the Client Manager and gives a description of his/her application. Based on the application description the Client Manager determines its corresponding VC and acts as an intermediary between the user and the Cluster Manager. The Cluster Manager and the user negotiate the SLA terms, through the Client Manager, until mutual agreement. Then, the user transfers the executable file and the potential input data of the application toward the corresponding VC. The Cluster Manager translates the application description to a template compatible with the corresponding programming framework, launches a new Application Controller instance, and submits the application to the framework. The Appli-cation Controller monitors the progress of its appliAppli-cation and regularly checks the satisfaction of its agreed SLA. If an SLA violation is detected, the Application Controller in-forms the Cluster Manager in order to calculate the possible penalties. Finally, the Client Manager provides a way for
the user to retrieve the results of his/her application from the Cluster Manager.
A. Technical Mechanisms for Extending a VC
Horizontally scaling up a VC is performed either using private VMs taken from other VCs or using public clouds VMs. Below we describe in more detail the used technical mechanisms for each option.
Obtaining VMs from other VCs. The transfer of VMs from a source VC to a destination VC operates as follows. First, the Cluster Manager of the source VC selects the VMs to remove, removes them from the programming framework and requests the Resource Manager to shut them down. Then, the Cluster Manager of the source VC informs the Cluster Manager of the destination VC about the availability of the VMs. The Cluster Manager of the destination VC requests the Resource Manager to start new VMs with the corresponding VM disk image, gets their corresponding IP addresses, configures them and adds them to its program-ming framework resources.
Obtaining VMs from Public Clouds. The cloud bursting of a VC operates as follows. First, the Cluster Manager of the corresponding VC requests a selected public cloud to create the VMs, Goets their corresponding IP addresses, con-figures them and adds them to its programming framework resources. When the VC finishes using the public VMs, its Cluster Manager removes the VMs from the programming framework and asks the corresponding public cloud to stop them. Note that before enabling a VC to burst into public clouds, we first make sure that the corresponding VM disk images are saved in the set of public clouds that may be used.
B. Policies for Extending a VC
In our system we assume that users pay for running their applications. The user payment does not depend on whether the application is executed on private or public resources but depends only on the provided QoS. To achieve the objective of maximizing the PaaS provider profit, we try to minimize the cost of running the applications by using only private resources when they are available. However, when a new application arrives in a peak period and all the private resources of its corresponding VC are used by other applications, the corresponding VC should be extended either using public cloud resources or getting more private resources. In the following we define three policies to extend a VC in a peak period.
Basic. The basic policy is very naive. It statically parti-tions the private resources between VCs, and when a new job arrives in a peak period its corresponding VC rents additional resources from a public cloud.
Advanced. The advanced policy enables the transfer of resources from one VC to another one. Thus when a new job arrives in a peak period its corresponding VC first checks if
it can get available private resources from other VCs before renting additional resources from a public cloud.
Optimization. The optimization policy goes one step further than the advanced policy in optimizing the use of private resources. When a new job arrives in a peak period, its corresponding VC checks if it can get available private resources from other VCs, as in the advanced policy. However if no VC has free resources, the policy decides between two options: renting additional resources from a public cloud or getting them from the running applications in the same or different VCs. Obviously, if the last option is selected, the QoS properties of the running applications may be impacted, and the payment of a penalty should be considered. More details about the profit optimization policy will be presented in the next section.
IV. PROFITOPTIMIZATIONPOLICY A. Model and Notations
We consider a PaaS system that consists of M VCs, vcs = {vc1, vc2, ..., vcM}; and N hosted applications, A = {A1, A2, ..., AN}. Each VC vcj hosts a subset of
applications, vcjA, wherePM
j=0vc
j
A= N . Each application
holds a number of VMs Aivmsthat may be private Aiprivate, or public Ai
public (Aivms = Aiprivate+ Aipublic). The VMs
have a price vmprice fixed by the PaaS provider, a private
cost vmprivatecost estimated by the provider and a public cost
vmpubliccost obtained from public IaaS clouds. The VM price
enables the provider to charge the hosted applications, where the VM costs enable the calculation of the cost of the hosted applications for the provider.
The profit optimization policy is called each time a request req for hosting a new application is received and no VC has available private resources for running it. The objective of the policy is to maximize the overall PaaS provider profit, which consists in maximizing the request profit plus the sum of all hosted applications profit (equation. 1). To achieve this, we try to avoid giving public cloud resources for the request by getting private resources from the running applications. The resources could be obtained from only one application or from a subset of applications. The QoS promised in the SLAs of the impacted applications may deteriorate and as a result the provider loses some revenue through the payment of penalties. Therefore, we ensure that the extra profit we get from the request using private VMs would be more than the penalties of the impacted applications.
The PaaS provider may also care about its reputation and may not afford to impact all the hosted applications for improving its profit. Therefore, we can consider the fol-lowing constraint. The percentage of impacted applications in the overall PaaS system should be less or equal to a predefined threshold, where the threshold is the maximum authorized percentage of impacted applications (equation 2). See notations in table I.
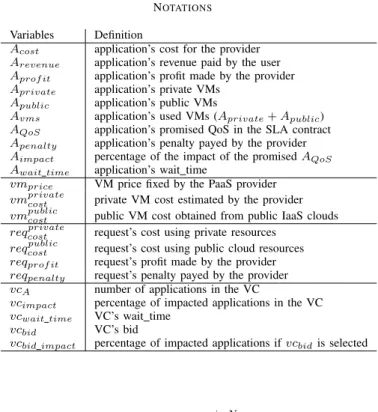
Table I NOTATIONS
Variables Definition
Acost application’s cost for the provider
Arevenue application’s revenue paid by the user
Aprof it application’s profit made by the provider
Aprivate application’s private VMs
Apublic application’s public VMs
Avms application’s used VMs (Aprivate+ Apublic)
AQoS application’s promised QoS in the SLA contract
Apenalty application’s penalty payed by the provider
Aimpact percentage of the impact of the promised AQoS
Await time application’s wait time
vmprice VM price fixed by the PaaS provider
vmprivatecost private VM cost estimated by the provider
vmpubliccost public VM cost obtained from public IaaS clouds reqcostprivate request’s cost using private resources
reqcostpublic request’s cost using public cloud resources reqprof it request’s profit made by the provider
reqpenalty request’s penalty payed by the provider
vcA number of applications in the VC
vcimpact percentage of impacted applications in the VC
vcwait time VC’s wait time
vcbid VC’s bid
vcbid impact percentage of impacted applications if vcbidis selected
Objective : max(reqprof it+ i=N X i=0 Aiprof it) (1) Constraint : Pj=M j=0 vc j A× vc j impact N 6 threshold (2) B. Algorithm
To maximize the provider profit, when there are no available private resources, the policy compares the cost of getting private resources from the running applications to the cost of getting resources from public clouds. We consider two ways for getting private resources from the running applications. The first way is to get or borrow resources from the applications during their execution. This way impacts the running applications with a cost called a bid, where the bid is the sum of penalties of the impacted applications. The second way is to wait until some resources are released by the running applications. This way keeps the running applications unaffected but impacts the request with a waiting time before using the resources, called wait time. More specifically, the policy operates as shown in algo-rithm 1. First we get the VM prices of a set of public IaaS clouds, select the cheapest one, and compute the request’s public cost accordingly. Then, all VCs in the PaaS system give their wait time (vcwait time), the percentage of their
impacted applications (vcimpact), and propose a bid and
give the corresponding percentage of impacted applications
(vcbid, vcbid impact). Each Cluster Manager has its own way
to compute its bid and wait time based on application type-specific knowledge. Note that vcimpact represents the
arrival of the request, and doesn’t change if the wait time option is selected because this option does not impact the running applications in the VC. However, the bid option impacts at least one more application in the VC, thus ∀vcj∈ vcs vcj
bid impact> vc
j
impact.
Afterwards, in a loop we select the smallest proposed bid and calculate the corresponding average percentage of impacted applications, bidimpact, where the computation of
the average takes the request into account. If bidimpact
satisfies the constraint of impacting less applications than the threshold, we exit the loop. Otherwise, we select the next smallest bid and perform the same check until we find a bid that satisfies the constraint or exhaust all bid proposals. Then, in the same way we select the shortest wait time and compute its cost as the possible penalty of the request,
reqpenalty. We compare the bid and the wait time cost and
select the cheapest option that satisfies our constraint. The request’s private cost is calculated as the cost of running the new application on private resources plus the selected bid or the cost of the selected wait time. Finally, according to the comparison of the request’s private and public cost, the policy decides which VMs to use.
The main assumption of this policy is that Cluster Man-agers can estimate penalties of impacted applications as well as the required waiting time for releasing resources and its corresponding cost. These estimations are based on the price functions defined in the SLA contract and can exploit application type-specific performance models.
V. COMPUTATIONAPPLICATIONS
In this section we investigate the example of computation applications to illustrate a concrete application of the profit optimization policy. We define a computation application as an application that runs for a finite duration without manual intervention, using a fixed or variable set of resources. In the next subsections, we define an SLA function for computation applications. Then we present our methods to compute the wait time and the bid.
A. SLA (Service Level Agreement)
The establishment of an SLA contract requires an ap-plication description provided by the user that contains the application’s characteristics and requirements. Based on the provided description, two SLA metrics are defined: a deadlineand a price. The deadline, referenced as Adeadline,
represents the overall time for running an application and giving results to the user. The deadline is calculated as the sum of the application’s runtime, Aruntime, and the
required time for processing the application submission, processing time. The price is the amount of money paid by the user to the provider for running his/her application, referenced as Aprice, and calculated as the product of the
application’s runtime and used VMs and the VM price fixed by the provider. If the deadline is exceeded, a penalty
Algorithm 1 Profit Optimization Policy Require: request (reqvms), threshold
Ensure: VMs
get vm prices from a set of pubic clouds
vmpubliccost = min(vm prices)
reqcostpublic= cost(req, vmpubliccost )
∀vcj∈ vcs get (vcj
wait time), (vc
j
impact),
and (vcjbid, vcjbid impact)
// Find the smallest bid that satisfies the constraint checked vcs = ∅
repeat
bid = vcxbid such that vcxbid=
j=M min j=0vc j bid & vcx∈ checked vcs/ bidimpact= vcxA×vcx bid impact+ Pj=M j=0,j6=xvc j A×vc j impact N +1 checked vcs.add(vcx)
until (bid impact < threshold)∨ (checked vcs = vcs) // Find the smallest wait time
wait time = vcx
wait time such that vcxwait time =
j=M
min
j=0vc
j wait time
wait timeimpact=
Pj=M
j=0 vc j impact+1 N +1
wait timecost= reqpenalty
// choose between bid and wait time cost
if (bidimpact< threshold) ∧ (wait timeimpact < threshold)
then
if bid < wait timecost then
additional cost = bid else
additional cost = wait timecost
end if
else if (bidimpact < threshold) then
additional cost = bid
else if (wait timeimpact< threshold) then
additional cost = wait timecost
else
additional cost = ∞ end if
reqcostprivate= cost(req, vm
private
cost ) + additional cost
// choose between private and public resources if reqprivatecost 6 req
public
cost then
get VMs from vcx else
get VMs from public cloud end if
Apenalty is calculated proportionally to the delay and an
α value, and deduced from the initial price. The delay,
Adelay, is calculated as the difference between the real
application’s completion time and the agreed deadline. The α value determines how fast the penalty increases. A high α value is more advantageous for the provider while a low one is more advantageous for the user (see equations 3). In this model, we assume that VMs are charged per second, following the current trend for increasingly shorter billing periods in cloud platforms.
From the user point of view, the computation details of the deadline and the price are transparent. The user specifies one of the two SLA metrics, the deadline or the price, plus possibly the α value. Whenever possible the provider proposes accordingly the second SLA metric. A new negotiation round is launched until the user and the provider agree. From the provider point of view, the computation of the deadline and the price is based on the determination of the application’s runtime and used VMs. In this paper we assume that it’s possible to predict the runtime based on the used VMs and vice-versa for the type of applications hosted in a particular VC. Several methods for performing this prediction have been proposed in the literature, such as [24] for MapReduce applications and [25] for scientific applications.
Adeadline= Aruntime+ processing time (3a)
Aprice= Aruntime× Avms× vmprice (3b)
Apenalty=
Adelay× Avms× vmprice
α , α > 0 (3c)
Arevenue= Aprice− Apenalty (3d)
B. Wait time Computation
The method we use for calculating the wait time of a VC is very simple. As shown in Algorithm 2, first we calculate the wait time of all applications where the wait time of a computation application is computed as the remaining time for the application to finish its execution. We perform an ascending sort of the applications according to their corresponding wait time. Then, in a loop we select the application with the smallest wait time and compare the number of its private VMs to the number of requested VMs. If it is greater or equal, we consider the application’s wait time as the VC wait time and exit the loop. Otherwise, we increment a variable vms, which is initialized to zero, by the number of the application’s private VMs. Then, we select the next application with the smallest wait time and perform the same check, and so on for the rest of applications. We exit the loop if (1) we find an application holding enough VMs, or (2) the number of VMs in the variable vms
Algorithm 2 VC Wait time Computation Input: reqvms
Output: vcwait time
∀Ai∈ vc
A, calculate Aiwait time
ascending sort vcA according to Await time
// initializing variables
vcwait time= ∞; vms = 0;
for (i = 0; i + +; i < vcA) do
if Aiprivate> reqvmsthen
if Aiwait time6 vcwait time then
vcwait time= Aiwait time
break end if
else if vcwait time < ∞ then
break else
vms+ = Ai
private
if vms> reqvms then
vcwait time= Aiwait time
end if end if end for
becomes greater or equal to the requested VMs. Thus, the VC’s wait time is respectively (1) the selected application’s wait time, or (2) the wait time of the last application having incremented vms. Otherwise the loop ends and the VC’s wait time remains infinity, as it was initialized.
C. Bid Computation
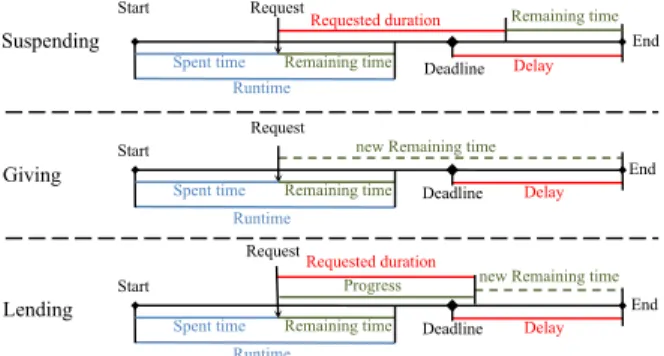
To propose a bid, the VC’s Cluster Manager considers impacting its applications using one of three possible forms of impact. The first form consists in suspending applications until the request finishes its execution. The second form consists in giving a subset of applications resources to the request and finish their executions only with the remaining VMs. The third form consists in lending a subset of appli-cations resources to the request and getting them back once the request finishes its execution. The three forms of impact (suspending, giving, and lending) may potentially lead the applications to exceed their agreed deadlines by a given delay. Obviously, the estimation of the delay depends on the form of impact. Note that not all computation applications may undergo the three forms of impact. We differentiate here between two types of computation applications: rigid and elastic. Rigid applications require a fixed amount of resources, while elastic applications can be adapted to use different amounts of resources. Elastic applications may undergo the three forms of impact while rigid applications may only be suspended. In the following we explain how we estimate the delay of rigid and elastic applications.
Rigid Applications Delay. To estimate the delay of a rigid application, we consider suspending the application during
a requested duration that includes the request runtime and the time for transferring VMs to the request and getting them back later. Thus, we first compute the application’s spent time from its submission until the time the request is received, see Fig. 2. Then, we deduce the remaining time as the predicted application’s runtime minus the spent time. Afterwards, we estimate the time when the application ends its execution as the remaining time plus the requested duration and compare it to the deadline. If the estimated application’s end time is before the deadline, then the delay is zero. Otherwise the delay is calculated as the difference between the end time and the deadline.
Elastic Applications Delay. To estimate the delay of an elastic application we have first to select the correct form of impact. If the application holds the required number of VMs or less, the application may only be suspended and its delay is calculated in the same way as that of a rigid application. Otherwise, if the application holds more VMs than required, we estimate its delay that corresponds to giving the resources and its delay that corresponds to lending the resources. Then, we select the form of impact according to the smallest delay, because a smallest delay implies a smallest penalty.
Initially for both impact forms, giving and lending, we calculate the spent time and the remaining time of the application, as we do for rigid applications. However, after giving or lending the resources, the remaining time of the application changes in a different way according to the impact form, see Fig. 2. If the resources are given then the new remaining time is calculated as the multiplication of the initial remaining time and the initial number of VMs, all divided by the remaining number of VMs (equation 4a). In addition, we estimate the application end time to be just the new remaining time, independently of the requested duration. If the resources are lent then the new remaining time is calculated in two steps. First, we compute the application execution progress during the period we lend resources, as the requested duration multiplied by the temporarily remaining VMs and all divided by the initial number of VMs (equation 4b). Then, we compute the new remaining time as the initial remaining time minus the calculated progress (equation 4c). And here we estimate the application end time to be the requested duration plus the new remaining time. Finally, we compare the application’s end time to the deadline to deduce the possible application’s delay. Giving VMs: new remaining t = A i remaining t× Aivms Ai remaining vms (4a) Lending VMs: progress = A i remaining vms× duration Ai vms (4b)
new remaining t = Airemaining t− progress (4c)
Suspending Runtime Deadline Spent time Requestedduration Remainingtime Start Request Delay
new Remainingtime
End Remainingtime
Runtime
Deadline
Spent time Remainingtime Start
Request
Delay
End
Giving
new Remainingtime
Runtime
Deadline
Spent time Remainingtime Start Request Delay End Lending Requestedduration Progress
Figure 2. Application times according to the three impact forms.
Once the delay of each application is estimated, we cal-culate the corresponding penalty according to equation 3c. Then we calculate the VC’s bid almost similarly as we do for calculating the VC’s wait time. As shown in algorithm 3, we calculate the applications penalty as well as their impact. The application impact is calculated here as a ratio between the delay and the deadline, Aimpact =
Adelay×100 Adeadline . The provider may not allow this ratio to exceed a fixed threshold in order to not displease its users too much. Then, we perform an ascending sort of the applications according to their penalties. The VC’s bid may be obtained from only one application that holds enough private VMs for the request or from a set of applications. In the second case the VC’s bid is calculated as the sum of penalties of all the applications in the set.
VI. EVALUATION
Our evaluation consists of a comparison of the three different policies with the purpose of maximizing the overall PaaS provider profit while limiting the deadline violations. A. Implementation
Our Meryn prototype, implemented in shell script, is built upon the Snooze VM manager software and supports batch and MapReduce applications using respectively Oracle Grid Engine OGE 6.2u7 and Hadoop 0.20.2 frameworks.
To calculate applications cost and revenue we defined the cost of a public cloud VM, the cost of a private cloud VM and the VM price for the end user as follows. The cost of a public cloud VM is based on the per-hour Amazon EC2 pricing of a standard medium VM instance in the Ireland datacenter1 divided by 3600 (the number of seconds per
hour), giving 0.00003612$/s. The cost of a private cloud VM is based on the per hour power cost of one core, reported in [26]. The reported cost is converted to dollars, multiplied by 2 (as medium VM instances have 2 cores), and
Algorithm 3 VC Bid Computation Input: reqvms, reqruntime, threshold
Output: vcbid
∀Ai ∈ vc
A, calculate Aipenalty and Aiimpact
ascending sort vcA according to Apenalty
// initializing variables
vcbid= ∞; A set = ∅; vms = 0; bid = 0;
for (i = 0; i + +; i < vcA) do
if (Ai
private> reqvms) then
if (Ai
bid6 vcbid) ∧ (Aiimpact6 threshold) then
vcbid= Aipenalty
break end if
else if vcbid< ∞ then
break else
if Ai
impact 6 threshold then
vms+ = Ai private bid+ = Ai penalty if vms> reqvmsthen vcbid= bid end if end if end if end for
divided by 3600 (the number of seconds per hour), giving 0.0000064497$/s. The VM price for end users is calculated as the cost of a public cloud VM multiplied per 2, giving 0.00007224$/s. This is justified by the fact that our system offers an extra service compared to IaaS providers. B. Environment Setup
We evaluated our prototype through a series of simula-tions on the Grid’5000 experimental testbed [27], using the parapluie and the paradent clusters of the Rennes site. The parapluie cluster consists of 40 HP Proliant DL165 G7 nodes supplied with 2 AMD Opteron(tm) 6164 HE processors (each with 6 cores at 1.7 GHz), 48 GB of memory, and Gigabit Ethernet network interfaces. The paradent cluster consists of 64 Carri System CS-5393B nodes with 2 Intel Xeon L5420 processors (each with 4 cores at 2.5 GHz), 32 GB of memory, and Gigabit Ethernet network interfaces.
We used two different workloads, one for the batch VC and one for the MapReduce VC. The batch workload follows the Lublin workload model [28]. To adapt this model to our scenario, we consider the number of nodes in each Lublin request as the number of VMs of the job; and this number is limited to 128 simultaneous VMs for each job. In order to generate a shorter workload we changed the following parameters of the Lublin workload model: the number of jobs from 1000 to 100, the maximum job runtime from two days to one hour, and the maximum inter-arrival time
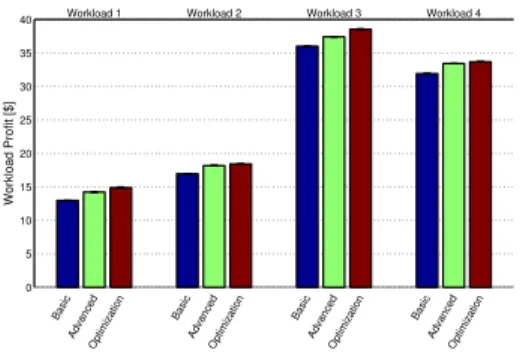
Workload 1 Workload 2 Workload 3 Workload 4
0 5 10 15 20 25 30 35 40
Basic Basic Basic Basic Advanced Advanced Advanced Advanced
Optimization Optimization Optimization Optimization
Workload Profit [$]
Figure 3. Workload profit comparison per policy. Profit shown is the sum
of profits of all jobs.
Table II
PROFITRATES OF THE ADVANCED AND OPTIMIZATION POLICIES COMPARED TO THE BASIC POLICY.
workload 1 workload 2 workload 3 workload 4
Advanced 9.75 % 7.12 % 3.91 % 4.69 %
Optimization 14.77 % 8.59 % 7.06 % 5.50 %
from five days to half an hour. The MapReduce workload is based on the distribution of job sizes and inter-arrival times at Facebook, reported in [29]. The workload consists of 100 jobs randomly submitted over 25 minutes with a mean inter-arrival time of 14s. We generated five instances of each workload, batch and MapReduce, and randomly combined them to get five workloads (workload 1, workload 2, ..., workload 5). Each workload consists of one batch workload instance and one MapReduce workload instance that will be submitted together.
In the optimization policy, we set the percentage thresh-old of impacted applications to 50% and the applications impact threshed to 100%. Each simulation in this paper was performed at least five times and the results are presented as means ± standard deviations.
C. Results Analysis
We evaluate the three policies according to three metrics: profit, VMs usage, and completion time.
Figure 3 shows the workload profit for the four workloads. The workload profit presented in the figure is the sum of profits of all jobs in the workload, where the profit of one job is calculated as the job’s revenue minus the job’s cost. We see that in the four workloads the optimization policy provides the best profit for the provider while the basic policy provides the worst one. In table II we show the rate of profit gains obtained with the advanced and optimization polices compared to the basic policy. The optimization rates differ from one workload to another one, from 5.50% to 14.77% with the optimization policy and from 3.91% to 9.75% with the advanced policy. These differences vary inversely with the amount of the used public cloud resources,
0 20 40 60 80 100 VMs Usage Proportion A B C Workload 1 A B C Workload 3 A B C Workload 4 A B C Workload 2 Local VC Bid Latency Cloud
A = Basic B = Advanced C = Optimization
Figure 4. VMs usage proportion for each workload and policy, calculated
as the number of the used VMs multiplied by the usage duration. Table III
PERCENTAGE OF THE USED PUBLIC CLOUDVMS.
workload 1 workload 2 workload 3 workload 4
Basic 45.09 % 48.77 % 96.46 % 73.26 %
Advanced 20.47 % 30.89 % 60.38 % 62.70 %
Optimization 8.57 % 19.84 % 52.80 % 56.15 %
as seen in figure 4.
Figure 4 shows the used VMs proportions for each work-load and policy. The used VMs are obtained either from private resources or from public cloud resources Cloud VMs. The private resources may be Local VMs (obtained from the available VMs on the local VC), VC VMs (obtained from available VMs on another VC), Bid VMs (obtained from running applications), or wait time VMs (obtained by waiting the execution end of running applications). Each proportion in the figure represents a percentage of the used VMs compared with total VMs used. We see in the figure that the policy which uses the less public cloud VMs is the optimization policy, followed by the advanced policy, while the basic policy is the one which uses the more public cloud VMs. The optimization policy uses up to 80.99% less public cloud resources compared to the basic policy (find more details in table III). This usage scheme of public cloud VMs is directly reflected in the overall provider profit.
Table IV
PERCENTAGE OF(A)DELAYED APPLICATIONS AND(B)AVERAGE DELAY OF DELAYED APPLICATIONS WITH THE OPTIMIZATION POLICY.
workload 1 workload 2 workload 3 workload 4
A 12.40% 24.70 % 10.60 % 18.90 %
B 36.76 % 45.23 % 36.83 % 47.76 %
We notice that in the optimization policy wait time VMs are more used than Bid VMs. We believe that the reason is related to two factors. First, Bid VMs are often acquired following a suspending or giving impact form which leads to stop and restart VMs two times, first time for giving the VMs to the request and second time for giving the VMs
Workload 1 Workload 2 Workload 3 Workload 4
0 1000 2000 3000 4000 5000 6000
Basic Basic Basic Basic Advanced Advanced Advanced Advanced
Optimization Optimization Optimization Optimization
Workloads Completion Time [s]
Figure 5. Workloads completion time (seconds), from the submission of
the first job to the completion of the final job.
back to their corresponding applications. This may highly affect the completion time of the impacted applications as well as their penalties. Thus often the proposed bid is higher than the wait time cost, and thus it is not selected. Second, the time for exchanging VMs is comparable to the average applications runtime in our workloads. Thus, waiting the end of the execution of running applications often takes a comparable time and with a more attractive cost.
Figure 5 shows the completion time of the four workloads. We define workload completion time to be the elapsed time between the arrival of the first job in the workload to the completion of the final job in the workload. We see that workload completion time with basic and advanced policies is almost the same for the four workloads. However, workload completion time with the optimization policy is slightly higher, especially in workload 1 (1.2% higher) and workload 2 (2.94% higher). This overhead in workloads completion time with the optimization policy is mainly due to the incurred delay of the impacted applications.
In these simulations the deadlines of all applications in the four workloads were satisfied with the basic and the advanced policies. However, as a cost of improving the provider profit with the optimization policy, there are some applications that exceeded their deadlines in each workload, see table IV. Nevertheless in all workloads, the percentage of delayed applications neither goes beyond the impacted applications threshold (set at 50%), nor does the average delay percentage of delayed applications go beyond the applications impact threshold (set at 100%).
VII. CONCLUSION
In this paper, we focused on optimizing the provider profit under SLA constraints in a cloud bursting PaaS environment. We presented a cloud bursting PaaS architecture based on elastic virtual clusters and able to host diverse types of applications, as well as three policies for resizing the virtual clusters in peak periods. We presented the profit optimiza-tion policy and investigated the example of computaoptimiza-tion applications to give a concrete application of the policy. We implemented a prototype that supports rigid and elastic
computation applications and evaluated it through a series of simulations that compare the three policies. Results showed that the profit optimization policy improves the provider profit up to 14.77% compared to a basic policy.
We will continue this work in three main directions. First, we intend to perform the evaluation with real experiments. Second, we intend to investigate additional billing models, beyond per-second billing. Finally, we will extend the pro-totype to support additional application types and associated QoS properties, beyond batch and MapReduce applications and deadlines.
ACKNOWLEDGMENT
D.Dib’s PhD Grant is is co-funded by the Brittany Coun-cil. Experiments presented in this paper were carried out using the Grid’5000 experimental testbed, being developed under the INRIA ALADDIN development action with sup-port from CNRS, RENATER and several Universities as well as other funding bodies (see https://www.grid5000.fr).
REFERENCES
[1] “Windows azure,” http://www.windowsazure.com/. [2] “Google app engine,” http://cloud.google.com/appengine/. [3] “Rightscale,” http://www.rightscale.com/.
[4] “Orangescape,” http://www.oracle.com/us/solutions/cloud/
platform/.
[5] “Aws beanstalk,” http://aws.amazon.com/fr/elasticbeanstalk/. [6] “Vmware cloud foundry,” http://www.cloudfoundry.com/. [7] G. Pierre and C. Stratan, “ConPaaS: a platform for hosting
elastic cloud applications,” IEEE Internet Computing, 2012. [8] “Open shift,” https://www.openshift.com/.
[9] “Cloudify,” http://www.cloudifysource.org/. [10] “Tsuru,” http://www.tsuru.io/.
[11] F. Paraiso, P. Merle, and L. Seinturier, “Managing elasticity across multiple cloud providers,” in Proceedings of the 2013 international workshop on Multi-cloud applications and
fed-erated clouds, ser. MultiCloud ’13. ACM, 2013.
[12] S. V. Costache, N. Parlavantzas, C. Morin, and S. Kortas, “Themis: Economy-Based Automatic Resource Scaling for Cloud Systems,” in 14th IEEE International Conference on High Performance Computing and Communications, 2012. [13] A. Lage Freitas, N. Parlavantzas, and J.-L. Pazat, “An
In-tegrated Approach for Specifying and Enforcing SLAs for Cloud Services,” in The IEEE 5th International Conference on Cloud Computing (CLOUD 2012), 2012.
[14] A. Iordache, C. Morin, N. Parlavantzas, E. Feller, and P. Riteau, “Resilin: Elastic mapreduce over multiple clouds,” in CCGRID, 2013.
[15] S. Kibe, S. Watanabe, K. Kunishima, R. Adachi, M. Yam-agiwa, and M. Uehara, “Paas on iaas,” in Proceedings of the 27th International Conference on Advanced Information Networking and Applications, ser. AINA ’13, 2013. [16] T. Bicer, D. Chiu, and G. Agrawal, “Time and cost sensitive
data-intensive computing on hybrid clouds,” Cluster Comput-ing and the Grid, IEEE International Symposium on, 2012. [17] N. Bonvin, T. G. Papaioannou, and K. Aberer, “Autonomic
sla-driven provisioning for cloud applications,” in CCGRID, 2011.
[18] H. Goudarzi and M. Pedram, “Multi-dimensional sla-based resource allocation for multi-tier cloud computing systems,” in Proceedings of the 2011 IEEE 4th International Conference on Cloud Computing, ser. CLOUD ’11, 2011.
[19] L. Wu, S. Garg, and R. Buyya, “Sla-based resource allocation for software as a service provider (saas) in cloud computing environments,” in CCGrid, 2011.
[20] D. Dib, N. Parlavantzas, and C. Morin, “Meryn: open, sla-driven, cloud bursting paas,” in Proceedings of the first ACM workshop on Optimization techniques for resources
management in clouds, ser. ORMaCloud ’13. ACM, 2013.
[21] “Nimbus,” http://www.nimbusproject.org/.
[22] D. Milojicic, I. M. Llorente, and R. S. Montero, “Opennebula: A cloud management tool,” Internet Computing, IEEE, 2011. [23] E. Feller, L. Rilling, and C. Morin, “Snooze: A scalable and autonomic virtual machine management framework for private clouds,” in CCGRID, 2012.
[24] N. B. Rizvandi, A. Y. Zomaya, A. J. Boloori, and J. Taheri, “On modeling dependency between mapreduce configuration parameters and total execution time,” CoRR, 2012.
[25] L. Carrington, A. Snavely, and N. Wolter, “A performance prediction framework for scientific applications,” Future Gener. Comput. Syst., 2006.
[26] R. Tudoran, A. Costan, G. Antoniu, and L. Boug´e, “A performance evaluation of azure and nimbus clouds for sci-entific applications,” in Proceedings of the 2nd International Workshop on Cloud Computing Platforms, ser. CloudCP ’12. ACM, 2012.
[27] “Grid5000,” https://www.grid5000.fr/.
[28] U. Lublin and D. G. Feitelson, “The workload on parallel supercomputers: modeling the characteristics of rigid jobs,” J. Parallel Distrib. Comput., 2003.
[29] M. Zaharia, D. Borthakur, J. Sen Sarma, K. Elmeleegy, S. Shenker, and I. Stoica, “Delay scheduling: a simple tech-nique for achieving locality and fairness in cluster schedul-ing,” in Proceedings of the 5th European conference on