To cite
Musielak, Marion and Brusseau, Mark L. and Marcoux,
Manuel and Morrison, Candice and Quintard, Michel Determination
of Chlorinated Solvent Sorption by Porous Material-Application to
Trichloroethene Vapor on Cement Mortar. (2014) Transport in
Porous Media . ISSN 0169-3913
O
pen
A
rchive
T
OULOUSE
A
rchive
O
uverte (
OATAO
)
OATAO is an open access repository that collects the work of Toulouse researchers and
makes it freely available over the web where possible.
This is an author-deposited version published in :
http://oatao.univ-toulouse.fr/
Eprints ID : 11588
To link to this article :
DOI: 10.1007/s11242-014-0321-8
http://dx.doi.org/10.1007/s11242-014-0321-8
Any correspondance concerning this service should be sent to the repository
administrator:
[email protected]
Determination of Chlorinated Solvent Sorption by Porous
Material—Application to Trichloroethene Vapor on
Cement Mortar
Marion Musielak · Mark L. Brusseau · Manuel Marcoux · Candice Morrison · Michel Quintard
Abstract Experiments have been performed to investigate the sorption of trichloroethene
(TCE) vapor by concrete material or, more specifically, the cement mortar component. Gas-flow experiments were conducted using columns packed with small pieces of cement mortar obtained from the grinding of typical concrete material. Transport and retardation of TCE at high vapor concentrations (500 mg L−1)was compared to that of a non-reactive gas tracer (Sulfur Hexafluoride, SF6). The results show a large magnitude of retardation (retardation factor = 23) and sorption (sorption coefficient = 10.6 cm3g−1)for TCE, compared to neg-ligible sorption for SF6. This magnitude of sorption obtained with pollutant vapor is much bigger than the one obtained for aqueous-flow experiments conducted for water-saturated sys-tems. The considerable sorption exhibited for TCE under vapor-flow conditions is attributed to some combination of accumulation at the air-water interface and vapor-phase adsorption, both of which are anticipated to be significant for this system given the large surface area associated with the cement mortar. Transport of both SF6and TCE was simulated success-fully with a two-region physical non-equilibrium model, consistent with the dual-medium structure of the crushed cement mortar. This work emphasizes the importance of taking into account sorption phenomena when modeling transport of volatile organic compounds through concrete material, especially in regard to assessing vapor intrusion.
Keywords Vapor intrusion · NAPL · Sorption · Concrete · Effective diffusion
M. Musielak · M. Marcoux (
B
)INPT - UPS, Institut de Mécanique des Fluides de Toulouse (IMFT), Allée Prof. Camille Soula, Université de Toulouse, 31400 Toulouse, France e-mail: [email protected]
M. L. Brusseau · C. Morrison
School of Earth and Environmental Sciences, University of Arizona, Tucson, AZ, USA M. Quintard
1 Introduction
The issue of vapor intrusion in buildings has received great attention during the last decades (Little et al. 1992;Odeh et al. 2006;Abreu and Johnson 2005;Yu et al. 2009;Provoost et al. 2010). For example, vapor intrusion has become a potential primary risk driver for sites contaminated by chlorinated solvents. Assessing the vapor intrusion potential for a contaminated site requires characterization of contaminant transport and fate from the source to the indoor air. Several authors have studied the transport of gas-phase contaminant from soil to indoor air, i.e., through the concrete slab of building foundations, and have developed associated mathematical models. According toBlondeau et al.(2003), the main obstacle in the development and application of models capable to simulate vapor intrusion for realistic building configurations is the lack of experimental data for the physical parameters involved in the equations, especially sorption and diffusion coefficients for VOC transport in concrete material.
Some studies have investigated the sorption of trichloroethene (TCE) and other chlorinated-solvent compounds by clay soils and calichess (Itakura et al. 2003;Akyol et al. 2011;Lu 2011). Conversely, very few investigations of volatile organic compounds (VOC) sorption by concrete material have been reported. For example,Luo and et Niu(2006) mea-sured partition coefficients of some VOCs in cement, using laboratory emission cells.Akyol et al. (2011) have measured the sorption of aqueous phase TCE by caliche soil (crust of soil cemented by Ca and Mg carbonates), often considered as a “natural concrete mate-rial”. However, no literature was found reporting the sorption of vapor TCE by concrete material.
Concrete material is a very complex and heterogeneous porous medium, composed mainly of cement, sand, rock fragments (aggregate), and water. As far as sorption is concerned, it is expected that the cement “phase” plays a determinant role. The purpose of this study is to characterize the sorption of TCE by concrete material, focusing on the contributions provided by the cement component.
2 Materials
The concrete material used for this study was prepared by the CSTB (Centre Scientifique et Technique du Bâtiment, Marne-La-Vallée, France). This material represents a typical concrete widely used in construction in France. The major composition of the concrete material and the cement paste is provided in Table1. Physical properties of the concrete sample are presented in Table2.
The results of prior research indicate that the sand and rock fragments have minimal influ-ence on the adsorption of vapors by concrete materials, as for water vapor (Baroghel-Bouny 2007). This was further tested by conducting preliminary experiments using the gravimetric dynamic vapor sorption method (DVS). Adsorption of water vapor by the different compo-nents of the concrete material, i.e., cement paste, sand, siliceous aggregates, and limestone aggregates was measured, and the results confirmed that the cement paste is the predominant source of adsorption. This is expected to be true as well for sorption of TCE, considering that TCE sorption by silica (the primary component of the sand and rock fragments comprising the concrete) is very low (Mahal et al. 2010). Thus, the experiments will focus on the cement paste.
The mineralogical composition of cement can vary and reflects component makeup in addi-tion to hydraaddi-tion history, weathering, etc. Mineral phases can for instance include portlandite,
Table 1 Initial composition of the concrete material and cement
Composition of the concrete material Major chemical composition of the cement CEMII/A (%)
Component Dosage (kg m−3)
Cement (CEM II/A 32,5 CE CP2 NF) 350 CaO 62.38
Sand 0/8 (≪ Bouaffle Recomposé ≫) (silica) 982 SiO2 15.58
Gravel (≪ 4/14 RC La Brosse ≫) 814 Al2O3 4.16
Superplasticizer (Chrystoplast Oméga 132) 2 SO3 2.83
Water 196 Fe2O3 1.81
MgO 0.79
K2O 0.78
Table 2 Properties of the concrete sample
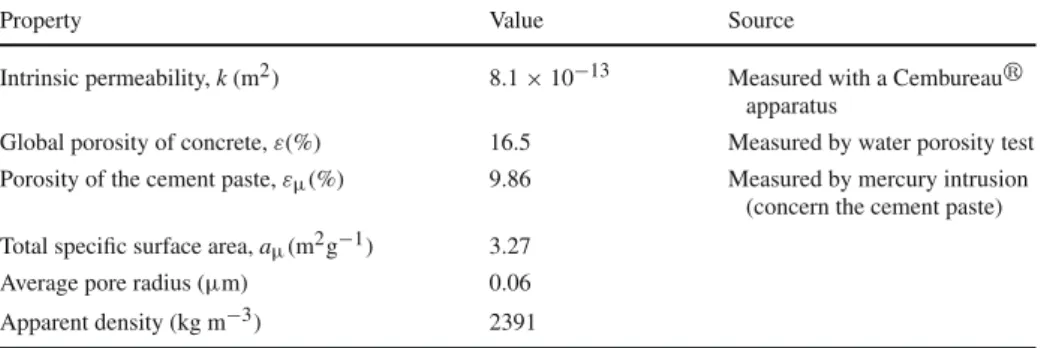
Property Value Source
Intrinsic permeability, k (m2) 8.1 × 10⁻¹³ Measured with a Cembureaur apparatus
Global porosity of concrete, ε(%) 16.5 Measured by water porosity test Porosity of the cement paste, εµ(%) 9.86 Measured by mercury intrusion
(concern the cement paste) Total specific surface area, aµ(m2g−1) 3.27
Average pore radius (µm) 0.06
Apparent density (kg m−3) 2391
a variety of calc-silicate phases in various Ca–Si ratios (some of which being hydrated), and minor additional phases (including monosulfate, hydrogarnet, ettringite, gypsum, and cal-cium ferrite). The present study aims to evaluate the global macroscopic sorption of TCE obtained on the chosen representative cement at macroscopic scale. Some further studies can be considered in order to evaluate the roles that can have these various mineral phases on the sorbent behavior of the each specific cement.
The cement paste samples were created by grinding the concrete to obtain small pieces (<3 mm), which were sorted to exclude the rock fragments. It should be clarified that what is termed here “cement paste” is actually the equivalent of a mortar, containing cement and sand mixed and cemented together. The particle size was chosen taking into account that the use of particles smaller than those used herein can induce artifacts, according toBaroghel-Bouny
(2007).
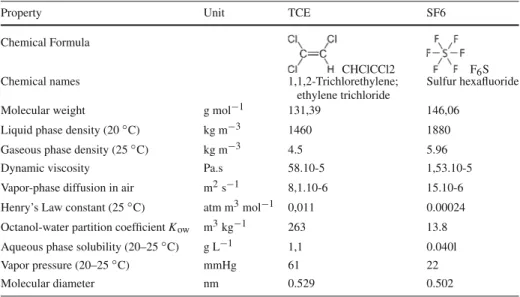
TCE was selected as the model chlorinated-solvent VOC given its ubiquitous occur-rence as a groundwater contaminant and its particular relevance for vapor intrusion issues. TCE has a non-dimensional Henry’s coefficient of approximately 0.4 and an aqueous solubility of approximately 1200 mg L−1 (Schwarzenbach et al. 1993). SF6 was used as a nonreactive tracer to characterize the advective–dispersive properties of the packed columns. Because of its low partitioning coefficient, and its absence of significant retardation by sorption during transport through porous media, SF6 is known to be a useful detector of NAPL pools and residual zones (Wilson and Mackay 1996).
Table 3 Physical–chemical properties of TCE and SF6 (EPA and NIST database, CRC Handbook of
Chem-istry and Physics)
Property Unit TCE SF6
Chemical Formula
CHClCCl2 F6S
Chemical names 1,1,2-Trichlorethylene;
ethylene trichloride
Sulfur hexafluoride
Molecular weight g mol−1 131,39 146,06
Liquid phase density (20◦C) kg m−3 1460 1880
Gaseous phase density (25◦C) kg m−3 4.5 5.96
Dynamic viscosity Pa.s 58.10-5 1,53.10-5
Vapor-phase diffusion in air m2s−1 8,1.10-6 15.10-6 Henry’s Law constant (25◦C) atm m3mol−1 0,011 0.00024 Octanol-water partition coefficient Kow m3kg−1 263 13.8
Aqueous phase solubility (20–25◦C) g L−1 1,1 0.040l
Vapor pressure (20–25◦C) mmHg 61 22
Molecular diameter nm 0.529 0.502
Table3recalls relevant physical–chemical properties of TCE and SF6.
The TCE was mixed with air to create the target injection concentration. The SF6was pre-mixed in a balance of nitrogen (99.8 % purity, Air Liquide) at a concentration of 66 µg L−1.
3 Experimental Study
3.1 Experimental Setup
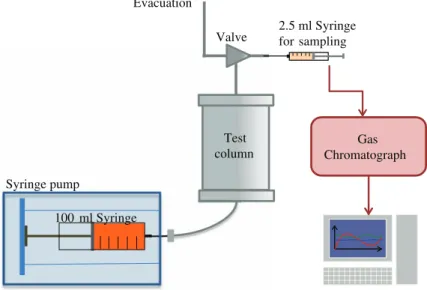
Column experiments were performed to determine the retardation of TCE in the cement mortar under dynamic conditions. The experimental apparatus was derived from the one used byBrusseau et al.(1997) andPopovicova and Brusseau(1998). It is constructed with stainless steel (SS) to obtain an inert system (Fig.1). We used 3.2-mm SS tubing and SS Swagelok fittings (Swagelok, Arizona Valves and Fittings Co., Phoenix, AZ, USA) for all connections. The column is 70 mm long and has an internal diameter of 21 mm.
3.2 Operating Procedure
The cement mortar was oven dried at 60◦C prior to use. The media were then packed into the column. Given that laboratory air was injected into the column, it is anticipated that the porous medium equilibrated with the ambient relative humidity, producing a very low water content (∼1 %). The pore volume (PV) of the column was calculated from the known mass and apparent density of the cement material packed into the column, and corresponds to the total volume of macro-porosity in the column.
For the TCE experiments, TCE vapor in a balance of laboratory air was prepared in a 100-ml glass syringe (SGE gas tight syringe 100MR-LL-GT). The concentration of TCE in
Test column Gas Chromatograph Syringe pump 100 ml Syringe Evacuation 2.5 ml Syringe for sampling Valve
Fig. 1 Experimental apparatus
the syringe was measured for samples collected before and after injection to ensure tem-poral constancy, and averaged approximately 500 mg L−1. This vapor was injected in the column at a constant flow rate of 1 mL min−1(equivalent to a mean pore-gas velocity of 9×10⁻³cm s−1), using a syringe pump (KD Scientific KDS-210 Syringe pump). A pulse of 6.4 PV of TCE vapor (see exact data for each experiment in Table3) was injected, followed by injection of fresh air, at the same flow rate, to effect elution. Effluent samples (2 mL) were collected periodically using a gas tight Luer lock syringe (SGE gas tight syringe, 2.5 mL). These samples were transferred to 20 mL headspace vials and analyzed by gas chromatog-raphy (GC/FID, Shimadzu GC-17A).
The SF6experiments were conducted in the same manner as the TCE experiments. Sam-ples were analyzed using GC/ECD (Shimadzu GC-17A). Four sets of experiments were conducted. The characteristics of each column are provided in Table4.
3.3 Data Analysis
Breakthrough curves of TCE and SF6were analyzed using the method of moments to calculate the retardation factor and the input mass recovery in the system, as described inGovindaraju and Das(2007). The zero-th temporal moment was calculated by determining the total mass of component eluted from the column, and then normalized to the injected known mass to obtain the mass recovery in the system. The component mean travel time in the system was determined by subtracting one half of the injection pulse width from the ratio of the first temporal moment to the zero-th moment. The ratio of TCE and non-reactive tracer travel times was used to calculate the retardation factor of TCE. The absolute temporal moments (µ), normalized absolute moment (µ∗), and central moments (m) were calculated as (Govindaraju and Das 2007 ) µn = ∞ ! 0 TnC(Z , T )d T (1)
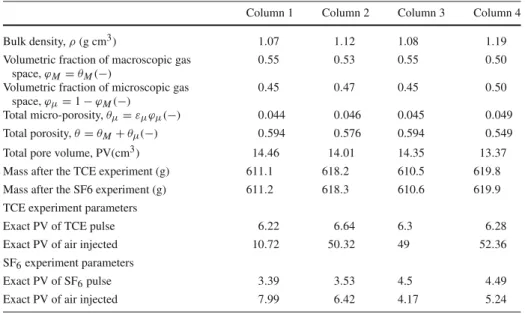
Table 4 Characteristics of the columns
Column 1 Column 2 Column 3 Column 4
Bulk density, ρ (g cm3) 1.07 1.12 1.08 1.19
Volumetric fraction of macroscopic gas space, ϕM = θM(−)
0.55 0.53 0.55 0.50
Volumetric fraction of microscopic gas space, ϕµ= 1 − ϕM(−)
0.45 0.47 0.45 0.50
Total micro-porosity, θµ= εµϕµ(−) 0.044 0.046 0.045 0.049
Total porosity, θ = θM+ θµ(−) 0.594 0.576 0.594 0.549
Total pore volume, PV(cm3) 14.46 14.01 14.35 13.37
Mass after the TCE experiment (g) 611.1 618.2 610.5 619.8 Mass after the SF6 experiment (g) 611.2 618.3 610.6 619.9 TCE experiment parameters
Exact PV of TCE pulse 6.22 6.64 6.3 6.28
Exact PV of air injected 10.72 50.32 49 52.36
SF6experiment parameters
Exact PV of SF6pulse 3.39 3.53 4.5 4.49
Exact PV of air injected 7.99 6.42 4.17 5.24
µ∗n = µn µ0 (2) mn = 1 µ0 ! (T − µ∗1)nC(Z , T )d T , n ≥2 (3)
The moment analysis was conducted only on the data sets containing the most data (i.e., TCE#2 and #4; and SF6#1 and #3), because it has been proved that an incomplete break-through curve significantly affects moment calculations (Govindaraju and Das 2007). The results for the first three moments (µ) and central moments (m) are shown in Table5.
Calculations of the transport parameters from the moments were done according to the following equations (Govindaraju and Das 2007)
v = L m1
, and D = m2v 3
2R2L for a non-reactive tracer (4)
and: β = 1 − 3(m2Pe −2R 2)2 2RPe(m3Pe −6m2R) , ω = 2(1 − β) 2R2Pe m2Pe −2R2 (5) 4 Mathematical Modeling
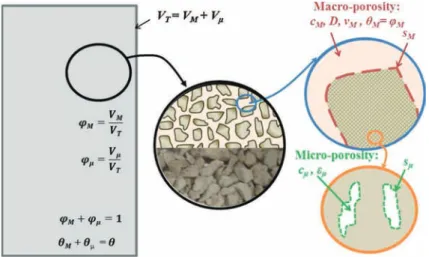
The cement mortar medium used in this study is comprised of aggregates with significant internal micro-porosity (Fig. 2). Thus, the system is treated as a bi-continuum (dual- or double porosity) medium composed of two distinct pore domains: the term macro-porosity will describe the volume of gas around the cement paste aggregates (i.e., the pore-space between cement paste pieces, on the order of millimeters) and its relative parameters will be indicated by the subscript “M”; while the micro-porosity will refer to the cement paste material porosity (with a mean pore radius of 5.7 × 10⁻⁸m as estimated from mercury intrusion tests), and its relative parameters will be indicated by the subscript “µ”.
Fig. 2 Schematic representation of the two pore domains in the column. VT,VM, and Vµ are the total,
macroscopic, and microscopic volumes, respectively (L3); ϕMand ϕµare the volume fraction of macroscopic
and microscopic domains, respectively (−); θMand θµare the total porosity of the macro and micro-domains,
respectively; εMand εµare the local porosity of the macro and micro-domain, respectively (−), and εM= 1,
thus ϕM = θMand θµ= ϕµεµ; cMand cµare the local concentrations of TCE (M L−3)in the macro and
micro-regions; sMand sµare the sorbed concentrations of TCE (M L−3)on the cement paste material in the
macro-pores and micro-pores region, respectively. On the bottom of the middle drawing is a photograph of the cement paste pieces.
Modeling transport in dual-porosity media has received a lot of attention in the literature (Brusseau and Rao 1990;Quintard and Whitaker 1998;Ahmadi et al. 1998;Genuchten et al. 1974;Genuchten and Wagenet 1989;Nkedi-Kizza 1984;Landereau et al. 2001). For such systems, a dual-porosity physical non-equilibrium model is generally used:
For the macro-region averaged concentration: (θM+ fρ KD) ∂cM ∂t = θMD ∂2cM ∂x2 − q ∂xM ∂x − α(cM− cµ) (6) For the micro-region averaged concentration:
"θµ+ (1 − f )ρ KD# ∂ cµ
∂t = α(cM− cµ), (7) where cMand cµare the intrinsic mass concentration (M L−3)averaged over a representative volume of the macro and micro-regions respectively (M L−3); ρ is the bulk density of the porous medium (M L−3); θµand θMare the micro and macro-porosity, respectively (−); q is the gas filtration velocity (L T−1), f is the fraction of the sorption sites that is in direct contact with the mobile phase in the macro-porosity (−); and α is the mass transfer coefficient (T−1). The variable f refers to systems in which the macro-region may have grains fully accessible to the flow and that may represent a significant surface area, hence a significant adsorbed mass. Given the artificial preparation of our material, this area, which could as a first approximation be assimilated to the cement grain external area, is likely to be very small compared to the internal grain specific area.
Based on the physical equilibrium model, one may write the following non-dimensional equations (Genuchten and Wierenga 1976;Van Genuchten 1981), which are
a combination of the averaged equations for the macro and micro-domains: βR∂CM ∂T + (1 − β)R ∂Cµ ∂T = 1 Pe ∂2CM ∂X2 − ∂CM ∂X (8)
the micro-domain mass balance equation being written as (1 − β)R∂Cµ
∂T = ω(CM− Cµ), (9)
where the dimensionless parameters are defined as follows: CM= cM c0 ,Cµ= cµ c0 ,X = x L,T = vt L. (10) and where CMand Cµare the relative concentrations of component in the macro and micro-domains, respectively (−), c0is the influent concentration of component (M L−3),xand L are the linear distance in the direction of the flow and column length respectively (L); X is the relative distance (−); t is the time (T ); T is the normalized time corresponding to the equivalent pore volume injected at time t (PV); v is the mean pore-gas velocity (L T−1)in the macro-pores and is assumed to be constant; and D is the dispersion coefficient for the macro-region (L2T−1). This formulation leads to four governing dimensionless parameters
Pe = vL D , R =1 + ρKD θ , β = θM+ fρ KD θ + ρKD , ω = αL θ v, (11) where Pe is the Péclet number (−); R is the retardation factor (−); β is the fraction of equilibrium sorption sites (−); and ω is called the Damköhler number (−).
Simulation of transport will be based on Eqs. (8) and (9), solved for a semi-finite column and a finite pulse-input. We will use the following boundary and initial conditions (Genuchten and Parker 1984): lim X →0+ $ CM− 1 Pe ∂CM ∂X % =& 1 0 ≤ T < T1 0 T ≥ T1 (12)
For the outflow boundary condition (concentration at x = L), it is convenient to assume a zero concentration gradient far away from x = L:
lim CM X →∞
(X, T ) =0, CM(X,0) = Cµ(X,0) = 0 (13)
The least square method was also used to estimate the transport parameters, using the popular parameter estimation program, CXTFIT (Toride et al. 1995). The variables Pe, R, β, and ω were obtained from the optimization process, and then D (=vL/Pe) was estimated from the known values of the column length L and the pore-gas velocity v.
Goodness-of-fit of the models to the data was evaluated by calculating coefficient deter-mination (r2)and root mean square error (RMSE).
RMSE = ' ( ( ) *+ C∗− ˆC∗, nd− nf , (14)
where C∗is the measured relative concentration of TCE at time t; ˆC∗is the predicted relative concentration of the component at time t; ndis the number of data; and nf the number of fitted parameters.
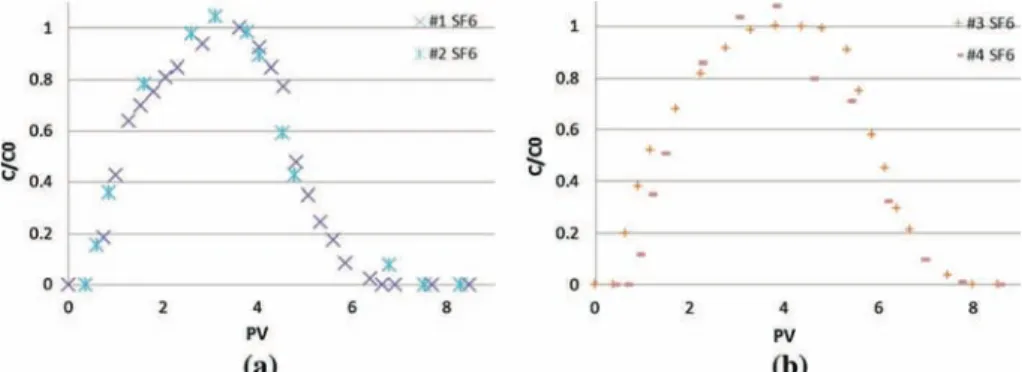
Fig. 3 SF6Breakthrough curves: a for a 3.5 PV pulse, b for a 4.5 PV pulse
Fig. 4 Comparison of breakthrough curves for SF6and TCE experiments
5 Results
5.1 Data Analysis Results
The results of the replicate tracer experiments are consistent, indicating good reproducibility. Breakthrough curves for the non-reactive tracer (SF6)are presented in Fig.3.
They exhibit negligible retardation (R=1.1), indicating no sorption of SF6 by the cement paste material. Conversely, the breakthrough curves for TCE (Fig. 4) exhibit significant retardation, with R values of approximately 23. The mass recoveries are close to 100 % for all experiments (Table5).
The higher than 100 % values obtained for TCE experiments may be explained by analyt-ical uncertainties. Larger first moments were obtained for TCE compared to SF6, confirming that TCE is retarded, while moving through the column. Larger second and third moments for TCE suggest that TCE exhibits greater tailing compared to SF6.
5.2 Transport Modeling Results
The objective of the mathematical modeling analysis was to support delineation of the processes influencing transport, e.g., physical non-equilibrium, and to determine the val-ues of the relevant parameters. SF6 and TCE and breakthrough curves were simulated by solving Eqs. (6) and (7), using CXTFIT on excelr. Simulation results are shown in Fig.5
Table 5 Moments calculations
Results exp#4 TCE exp#2 TCE exp#3 SF6 exp#1 SF6
Pulse width (PV) 6.90 7.22 4.88 3.66 µ0 7.27 8.30 4.72 3.53 µ1 199.46 175.09 17.62 10.34 µ2 6494 7584.10 77.13 35.48 µ3 242346 287732.01 372.44 136.14 Mass recovery (%) 105.4 115.14 96.71 96.64 m1 23.99 22.60 1.30 1.10 m2 140.35 164.05 2.40 1.48 m3 1116.37 1385.87 −0.02 0.50
Fig. 5 Modeling results
Table 6 Results of parameters estimation from moment analysis (MOM) and least squares method (CXTFIT)
for SF6 experiments (values in italics for β and f were >1, but reduced to 1 consistent with physical limitations)
Exp #1 SF6 Exp #3 SF6
MOM CXTFIT MOM CXTFIT
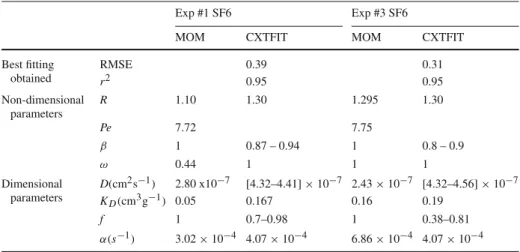
Best fitting obtained RMSE 0.39 0.31 r2 0.95 0.95 Non-dimensional parameters R 1.10 1.30 1.295 1.30 Pe 7.72 7.75 β 1 0.87 – 0.94 1 0.8 – 0.9 ω 0.44 1 1 1 Dimensional parameters D(cm2s−1) 2.80 x10⁻⁷ [4.32–4.41] × 10−7 2.43 × 10⁻⁷ [4.32–4.56] × 10−7 KD(cm3g−1) 0.05 0.167 0.16 0.19 f 1 0.7–0.98 1 0.38–0.81 α(s−1) 3.02 × 10⁻⁴ 4.07 × 10⁻⁴ 6.86 × 10⁻⁴ 4.07 × 10⁻⁴
Table 7 Results of parameters estimation from moment analysis (MOM) and least squares method (CXTFIT)
for TCE experiments
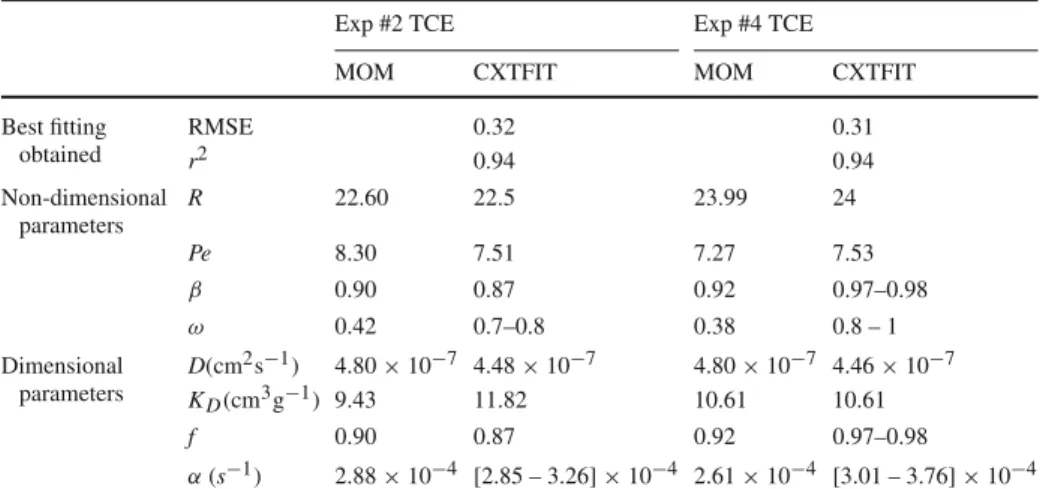
Exp #2 TCE Exp #4 TCE
MOM CXTFIT MOM CXTFIT
Best fitting obtained RMSE 0.32 0.31 r2 0.94 0.94 Non-dimensional parameters R 22.60 22.5 23.99 24 Pe 8.30 7.51 7.27 7.53 β 0.90 0.87 0.92 0.97–0.98 ω 0.42 0.7–0.8 0.38 0.8 – 1 Dimensional parameters D(cm2s−1) 4.80 × 10⁻⁷ 4.48 × 10⁻⁷ 4.80 × 10⁻⁷ 4.46 × 10⁻⁷ KD(cm3g−1) 9.43 11.82 10.61 10.61 f 0.90 0.87 0.92 0.97–0.98 α(s−1) 2.88 × 10⁻⁴ [2.85 – 3.26] × 10−4 2.61 × 10⁻⁴ [3.01 – 3.76] × 10−4
Fig. 6 Best fittings obtained for SF6 experiment #1, with the equilibrium model and the PNE model
The physical non-equilibrium (PNE) model provided good simulations of the measured SF6breakthrough curves. In comparison, the single-porosity (equilibrium) model provided poorer matches. As shown in Fig. 6 and Table 7, for example, the best r2 obtained for modeling experiment SF6#1 with a simple equilibrium model was only 0.89, whereas is was 0.95 with the PNE model.
5.3 Discussion
The results show that the physical non-equilibrium model also describes well the transport of TCE in the cement paste material. But the results for the value of f , close to 1, may imply that the micro-porosity of the cement paste might not have a significant impact on the mass transfer, and thus the small pieces of cement paste could simply be considered as aggregates, where sorption will occur only on the surface. Inspection of Tables5and6reveals that similar
mass transfer values were obtained for both tracers. This suggests that the tailing observed for TCE is a manifestation of physical non-equilibrium effects as opposed to rate-limited sorption.
Reasonably good agreement was observed between parameters obtained with the moment analysis method and the conventional least squares optimization method. The most significant deviations were observed for the kinetic parameters, β and ω. This is to be expected, given the sensitivity of the moments method to data truncation.
As noticeable result, compared to SF6, TCE experienced significant retardation for the vapor transport experiments. Given that all of the concrete material properties were held constant, causes of the retardation can firstly be associated to physical–chemical properties (Table3) where TCE exhibits a much higher partition coefficient and Henry’s law constant than SF6
It is of interest to evaluate more precisely the processes contributing to this retardation, which can include sorption by fully water-solvated solids, retention by bulk water, accumu-lation at the air-water interface, and vapor-phase adsorption by incompletely water-solvated solids.
A set of aqueous-flow miscible-displacement experiments was also conducted for water-saturated conditions to measure sorption for these conditions. The columns were prepared in a similar manner, and aqueous solutions of 10 and 100 mg L−1were used for injection. Analysis of the results of these experiments provided KDvalues of 1.14 and 0.65 L kg−1
for the 10 and 100 mg L−1, respectively, indicating sorption is non-linear. Application of the Freundlich isotherm to these data produces KFand n values of 2 and 0.756, respectively.
These results obtained from aqueous-flow experiments indicate a relatively small magni-tude of sorption of TCE under water-saturated conditions. These results, in conjunction with values for Henry’s constant and water content (Table3), can be used to determine the contri-bution of the first two processes, respectively, which is calculated to comprise approximately 10 %.
The considerable sorption exhibited for TCE under vapor-flow conditions is thus attributed to some combination of accumulation at the air-water interface and vapor-phase adsorption. Both of these processes are anticipated to be significant for this system given the large surface area associated with the cement mortar. The total specific surface area measured by mercury intrusion is 3.27 m2g−1for the cement material, whereas silica sands have specific surface areas typically in the range of less than 1 m2g−1). The contributions of these two processes are difficult to differentiate at the very low water contents associated with the experiments (e.g.,Peng and Brusseau 2005).
6 Conclusion
Column experiments have been conducted in order to investigate the sorption and transport behavior of TCE vapor in cement paste material. High retention of TCE vapor by the material was observed. This translated to a mean retardation factor of 23.3, and a sorption coefficient of 10.6 cm3 g−1. Transport of TCE and the non-reactive tracer was described well by the physical non-equilibrium model, indicating that the grains of cement paste material can be represented as dual-porosity medium.
The vapor-phase experiments were conducted at room atmospheric conditions, in equili-bration with the laboratory humidity (as an equivalence to a water-solvated surface), so at very low water contents (∼1 %). This condition represents a limiting case, with the contributions from both accumulation at the air-water interface and vapor-phase adsorption expected to be
close to maximum. The high values of the sorption coefficient and retardation factor indicate that the sorption of TCE vapor by cement material should not be neglected in transport mod-els, and especially in vapor intrusion models. These results also highlight that, in the case of a polluted site, if remediation is implemented and the source of TCE removed, a concrete slab could still release TCE for a long time period (depending on the slab dimension). Conversely, if a new construction is built over a contaminated field, one may measure null concentration of contaminant in the indoor air for a certain time, because of the retardation induced by the sorption. However, concentrations in the indoor air would be expected to exceed zero at some point in the future, with the time delay related to the magnitude of retardation.
Acknowledgments This research was supported by the French National Research Agency (ANR-PRECODD FLUXOBAT). Additional support was provided by the U.S. NIEHS Superfund Research Pro-gram (Grant #ES 4940). The authors thank Jon Mainhagu and Hakan Akyol from the SWES department of University of Arizona, for their help on experimental measurements. We thank the Laboratoire de Chimie Agro-industrielle (LCA, ENSIACET) for the loan of the DVS apparatus, and especially Guadalupe Vaca Med-ina for her assistance. We thank also the Laboratoire des Matériaux et Durabilité des Constructions (LMDC, INSA Toulouse) for its participation on porosity measurements.
References
Abreu, L.D.V., Johnson, P.C.: Effect of vapor source: building separation and building construction on soil vapor intrusion as studied with a three-dimensional numerical model. Environ. Sci. Technlol. 39, 4450–4561 (2005)
Ahmadi, A., Quintard, M., Whitaker, S.: Transport in chemically and mechanically heterogeneous porous media V: two-equation model for solute transport with adsorption. Adv. Water Resour. 22, 59–86 (1998) Akyol, N.H., Yolcubal, I., Yüksel, D.I.: Sorption and transport of trichloroethylene in caliche soil. Chemosphere
82, 806–816 (2011)
Baroghel-Bouny, V.: Water vapour sorption experiments on hardened cementitious materials. Part I: Essential tool for analysis of hygral behaviour and its relation to pore structure. Cem. Concr. Res. 37(3), 414–437 (2007)
Blondeau, P., Tiffonnet, A.L., Damian, A., Amiri, O., Molina, J.L.: Assessment of contaminant diffusivities in building materials from porosimetry tests. Indoor Air 13, 302–310 (2003)
Brusseau, M.L., Rao, P.S.C.: Modeling solute transport in structured soils: a review. Geoderma 46, 169–192 (1990)
Brusseau, M.L., Popovicova, J., Silva, J.A.K.: Characterizing gas-water Interfacial and bulk-water partitioning for gas-phase transport of organic contaminants in unsaturated porous media. Environ. Sci. Technol. 31(6), 1645–1649 (1997)
Govindaraju, R., Das, B.: Temporal moment analysis for solute transport in porous media, Chap 5 in moment analysis for subsurface hydrologic applications. Water Sci. Technol. Libr. 61, 105–141 (2007)
Itakura, T., Airey, D.W., Leo, C.J.: The diffusion and sorption of volatile organic compounds through kaolinitic clayey soils. J. Contam. Hydrol. 65, 219–243 (2003)
Landereau, P., Noetinger, B., Quintard, M.: Quasi-steady two-equation models for diffusive transport in frac-tured porous media: large-scale properties for densely fracfrac-tured systems. Adv. Water Resour. 24, 863–876 (2001)
Little, J.C., Daisey, J.M., Nazaroff, W.W.: Transport of subsurface contaminants into buildings. Environ. Sci. Technol. 26, 2058–2066 (1992)
Lu, C., Bjerg, P.L., Zhang, P., Broholm, M.M.: Sorption of chlorinated solvents and degradation products on natural clayey tills. Chemosphere 83, 1467–1474 (2011)
Luo, R., et Niu, J.L.: Determining diffusion and partition coefficients of VOCs in cement using FLEC. Build. Environ. 4, 1148–1160 (2006)
Mahal, M.K., Murao, A., Johnson, G.R., Russo, A.E., Brusseau, M.L.: Non-ideal behavior during complete dissolution of organic immiscible liquid: 2. Ideal Porous Media Water Air Soil Pollut. 213(1–4), 191–197 (2010)
Nkedi-Kizza, P., Bigger, J.W., Selim, H.M., Van Genuchten, M.T., Wierenga, P.J., Davidson, J.M., Nielsen, D.R.: On the equivalence of two conceptual models for describing ion exchange during transport through an aggregated soil. Water Resour. Res. 20, 1123–1130 (1984)
Odeh, A.M., Abu-El-Sha’r, W., Al-Ruzouq, R.: Gas transport through concrete slabs. Build. Environ. 41, 492–500 (2006)
Peng, S., Brusseau, M.L.: Impact of soil texture on air–water interfacial areas in unsaturated sandy porous media. Water Resour. Res. 41(3), 1–8 (2005)
Popovicova, J., Brusseau, M.L.: Contaminant mass transfer during gas-phase transport in unsaturated porous media. Water Resour. Res. 34, 83–92 (1998)
Provoost, J., Bosman, A., Reijnders, L., Bronders, J., Touchant, K., Swartjes, F.: Accuracy of seven vapour intrusion algorithms for VOC in groundwater. J. Soils Sedim. 10, 473–483 (2010)
Quintard, M., Whitaker, S.: Transport in chemically and mechanically heterogeneous porous media IV : large-scale mass equilibrium for solute transport with adsorption. Adv. Water Resour. 22, 33–57 (1998) Schwarzenbach, R.P., Gschwend, P.M., Dieter, M.: Environmental Organic Chemistry. Wiley, New York (1993) Toride, N., Leij, F.J., Van Genuchten, M.T.: The CXTFIT Code for estimating transport parameters from lab-oratory or field tracer experiments, version 2.0., U.S. Salinity Lablab-oratory, Agricultural Research Services, U.S. Department of Agriculture, Riverside (1995).
Van Genuchten, M.T., Wagenet, R.J.: Two-site/two-region models for pesticide transport and degradation: theoretical development and analytical solutions. Soil Sci. Soc. Am. J. 53, 1303–1310 (1989)
Van Genuchten, M.T.: Non-equilibrium transport parameters from miscible displacement experiments, Research Report 119, U. S. Salinity Laboratory, Riverside, pp 88 (1981)
Van Genuchten, M.T., Davidson, J.M., Wierenga, P.J.: An evaluation of kinetic and equilibrium equations for the prediction of pesticide movement through porous media. Soil Sci. Soc. Am. J. 38, 29–35 (1974) Van Genuchten, M.T., Wierenga, P.J.: Mass transfer studies in sorbing porous media I. Anal. Solut. Soil Sci.
Soc. Am. J. 40, 473–480 (1976)
Van Genuchten, M.T., Parker, J.C.: Boundary conditions for displacement experiments through short laboratory soil columns. Soil Sci. Soc. Am. J. 48, 703–708 (1984)
Wilson, R.D., Mackay, D.M.: SF6 as a conservative tracer in saturated media with high intragranular porosity or high organic carbon content. Gr. Water 34, 241–249 (1996)
Yu, S., Unger, A.J.A., Paker, B.: Simulating the fate and transport of TCE from groundwater to indoor air. J. Contam. Hydrol. 107, 140–161 (2009)